Are Consumer Discretionary Stocks Saying Something?
A look at the health of the US consumer
As the calendar flips over to June, the debate over whether the US consumer is in good shape or are struggling wages on.
Everyday we continue to hear these mixed signals. There is data that shows that some are struggling, while other data shows consumers are in the best position ever financially.
One area of the stock market that has been giving a signal of late has been the consumer discretionary sector. These are non-essential goods and services. Items like cars, household appliances, specialty items, luxury goods and leisure.
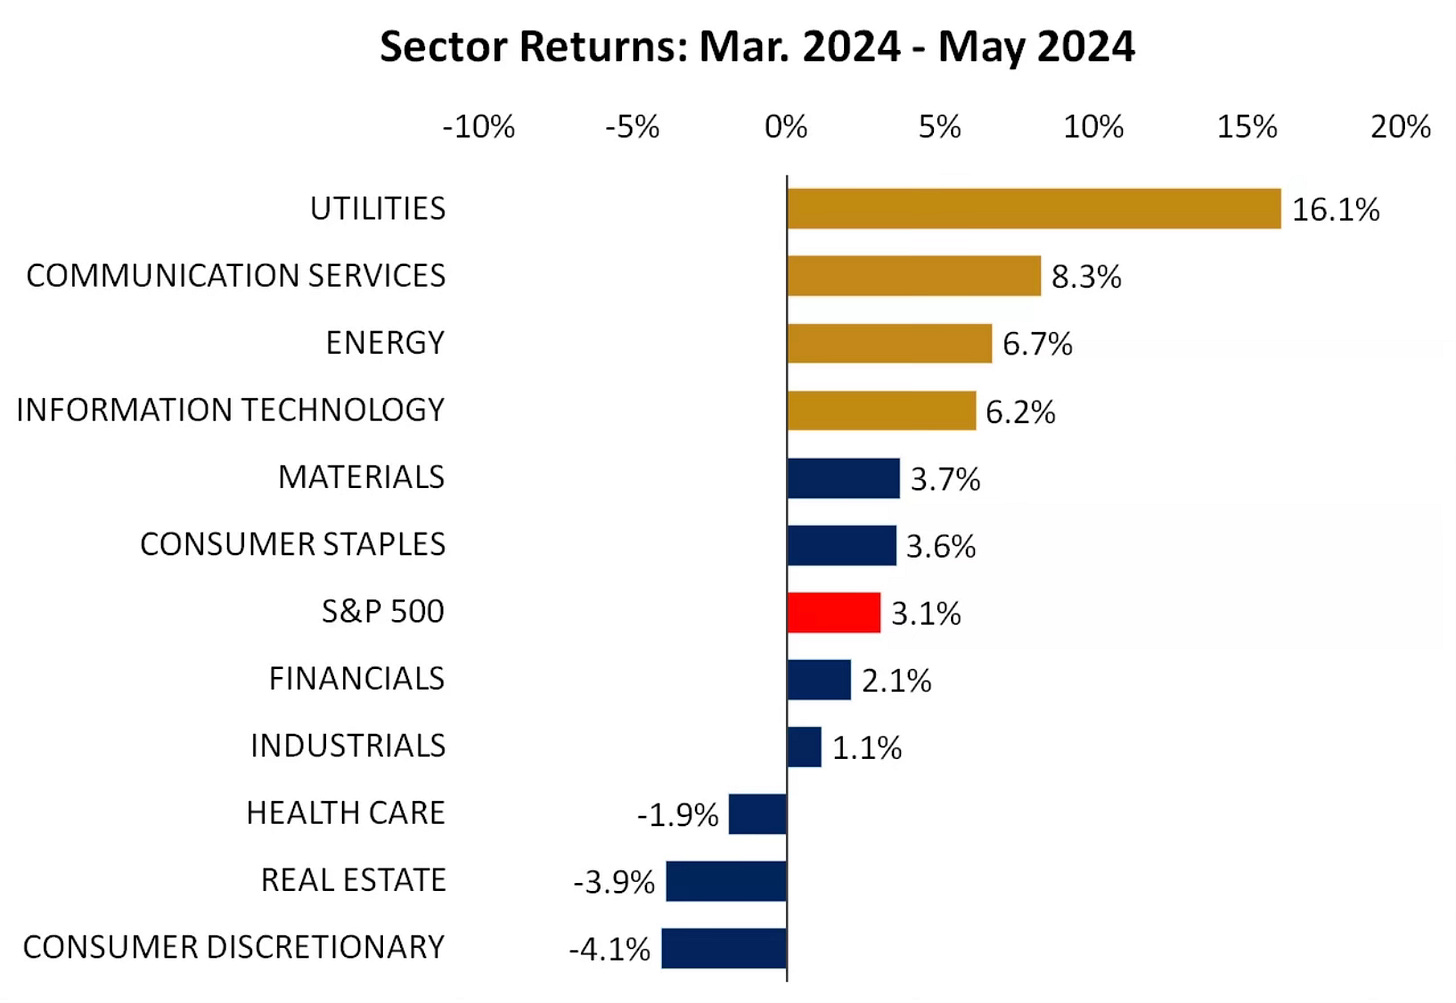
Over the past three months we’ve now seen the consumer discretionary sector start to trail all other sectors.
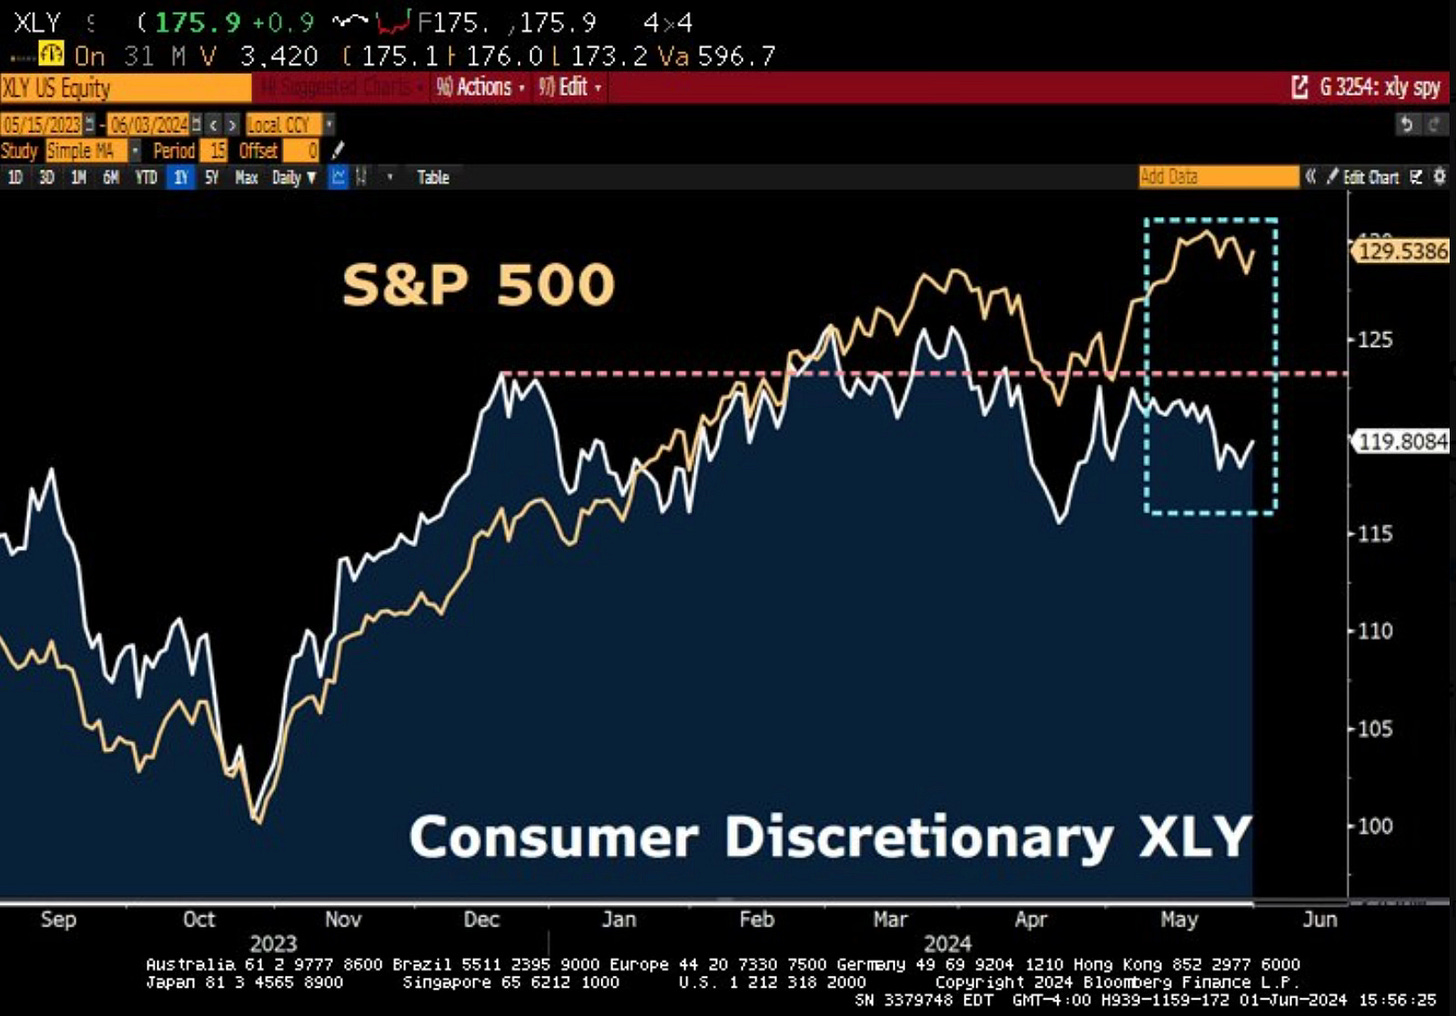
You can see the widening performance gap between the S&P 500 and the XLY (Consumer Discretionary Select Sector SPDR Fund).
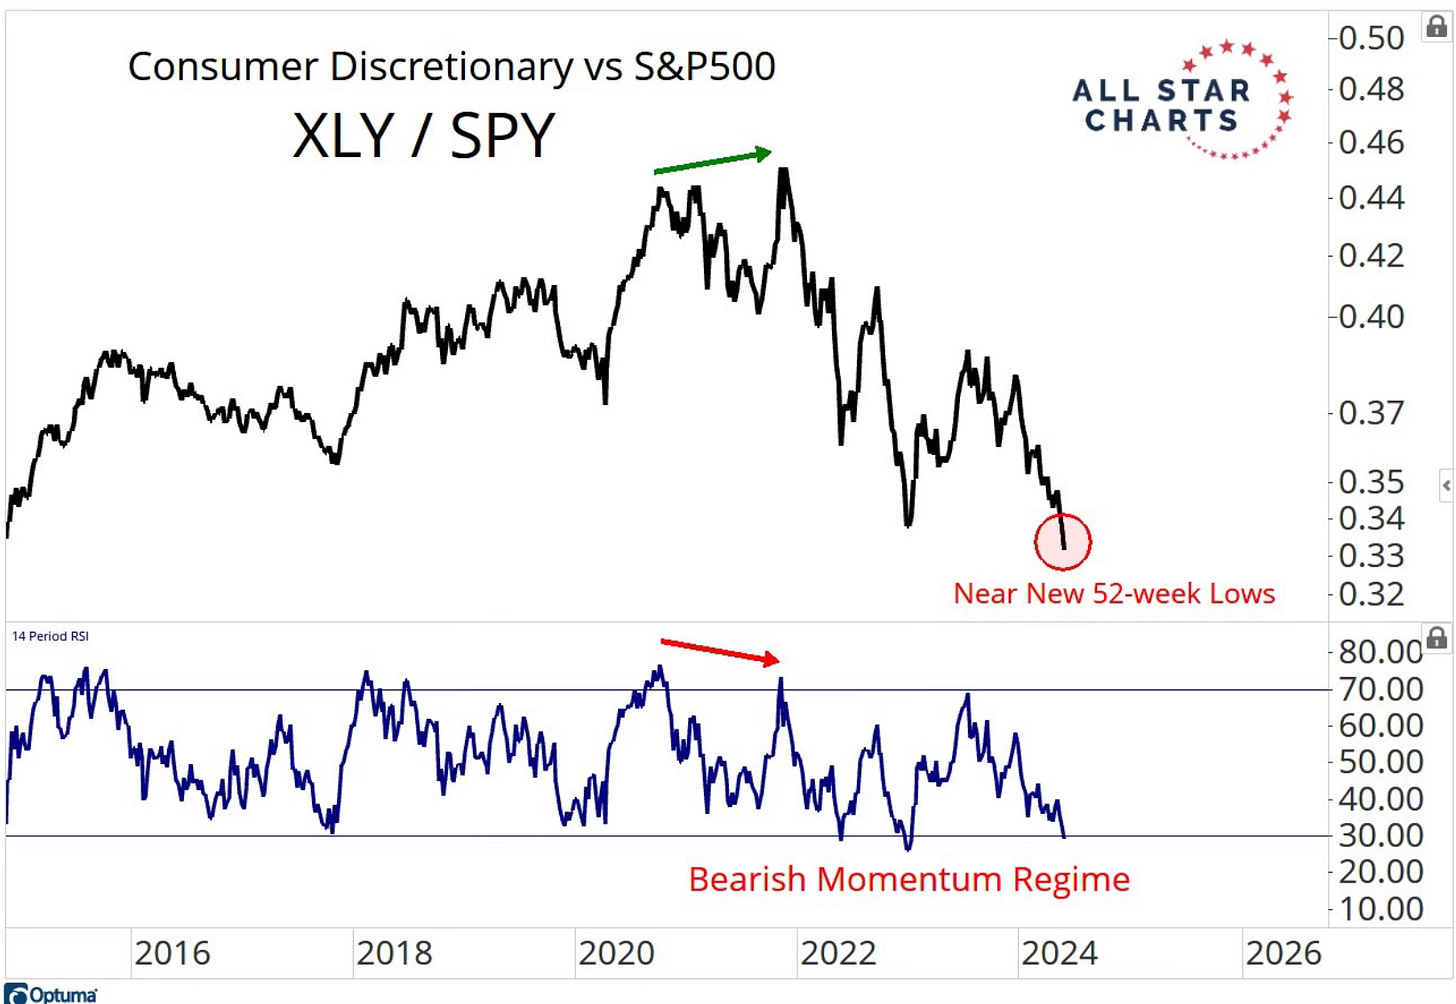
We’re now seeing new 52-week lows for Consumer Discretionary relative to the S&P 500.
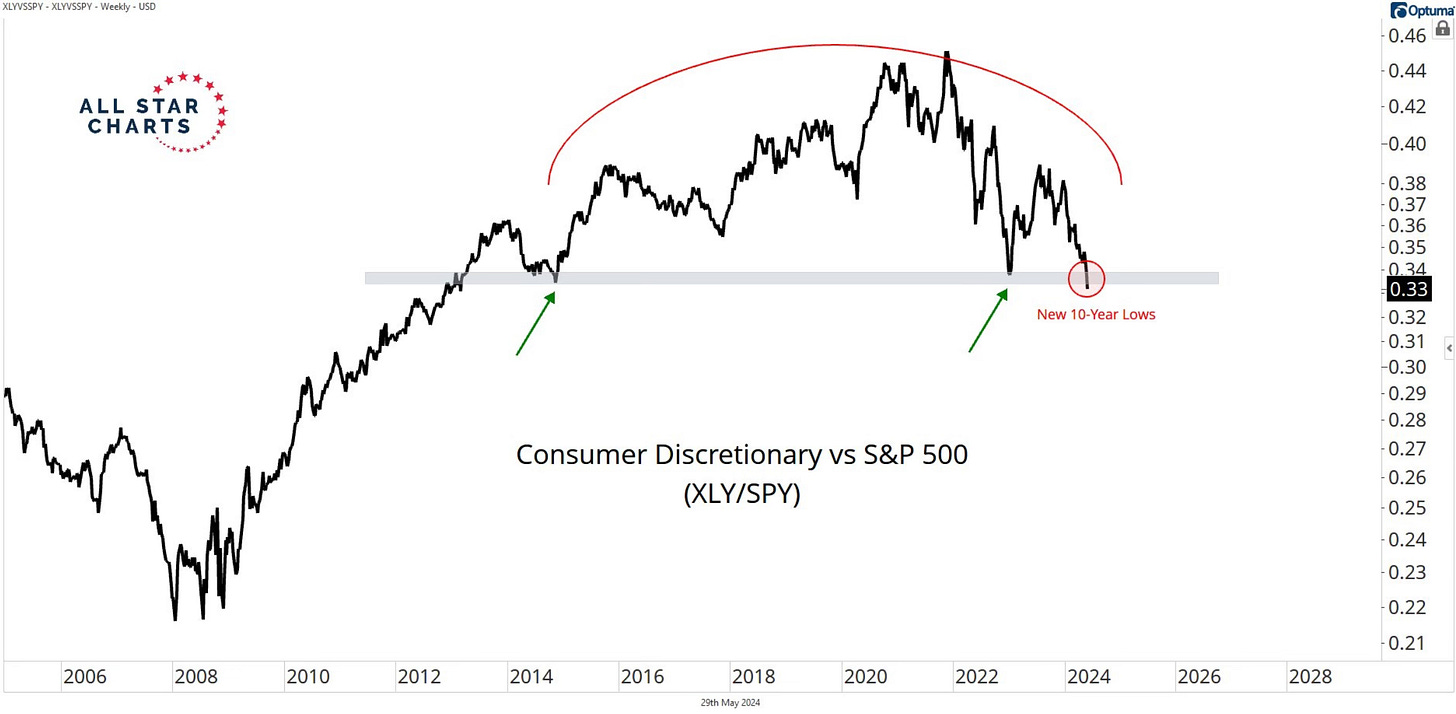
But it has got even worse than that. Consumer Discretionary is now hitting new 10- year lows relative to the S&P 500.
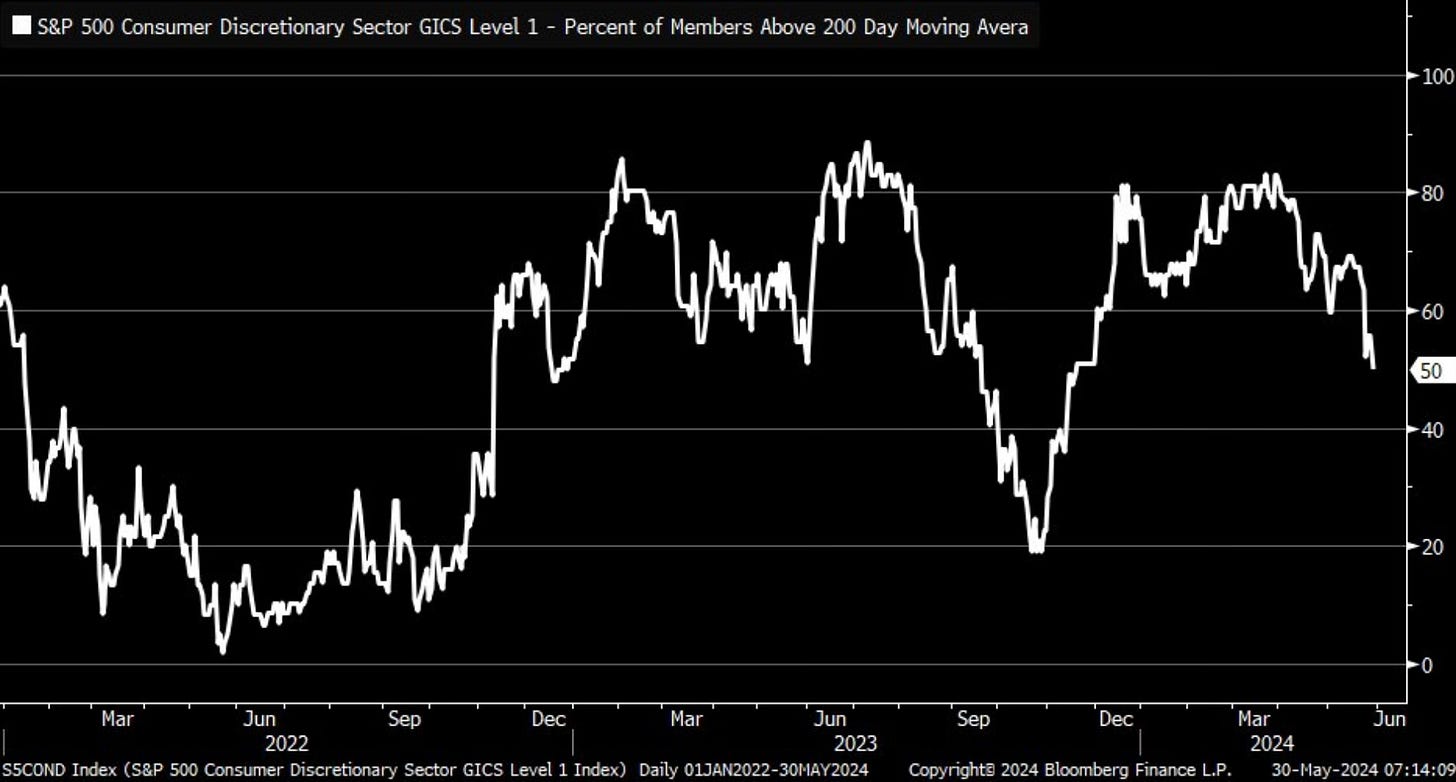
Now less than half the members of the Consumer Discretionary sector are trading above their 200-day moving average. That’s the lowest level since November.
Money has also been flowing out of the sector. Consumer Discretionary flows are the most negative dating back to April of 2022.
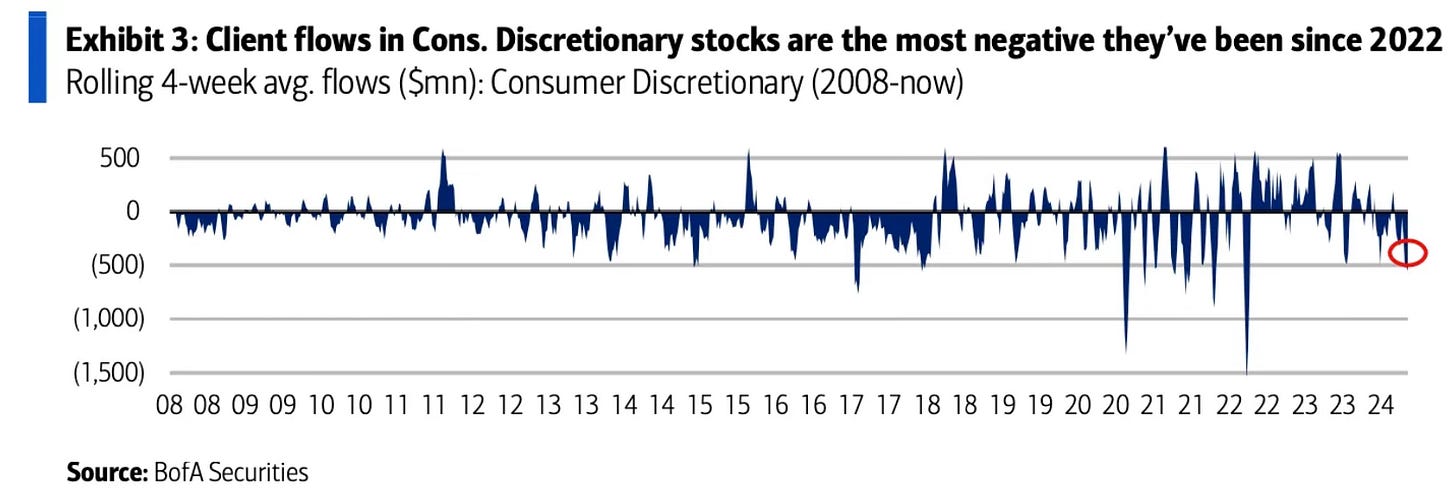
To me this is very interesting. It’s catching my eye because right now the data doesn’t show a weakening consumer. Contrary to what you may have heard, the data about the consumer right now is very strong.
Let’s revisit some data on the state of the consumer.
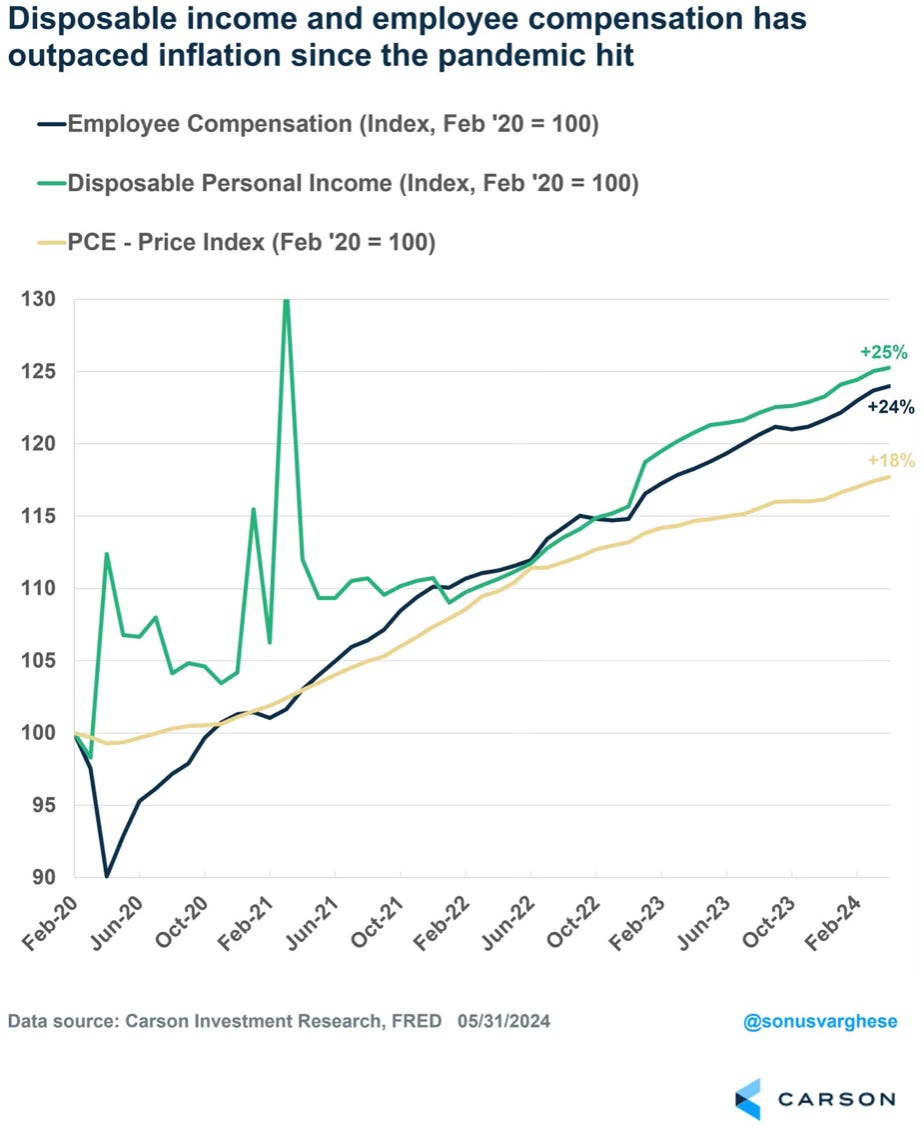
This is one of my favorite charts that goes back to February of 2020. It shows that inflation has been up 18%, but employee compensation and disposable personal income are up even more.
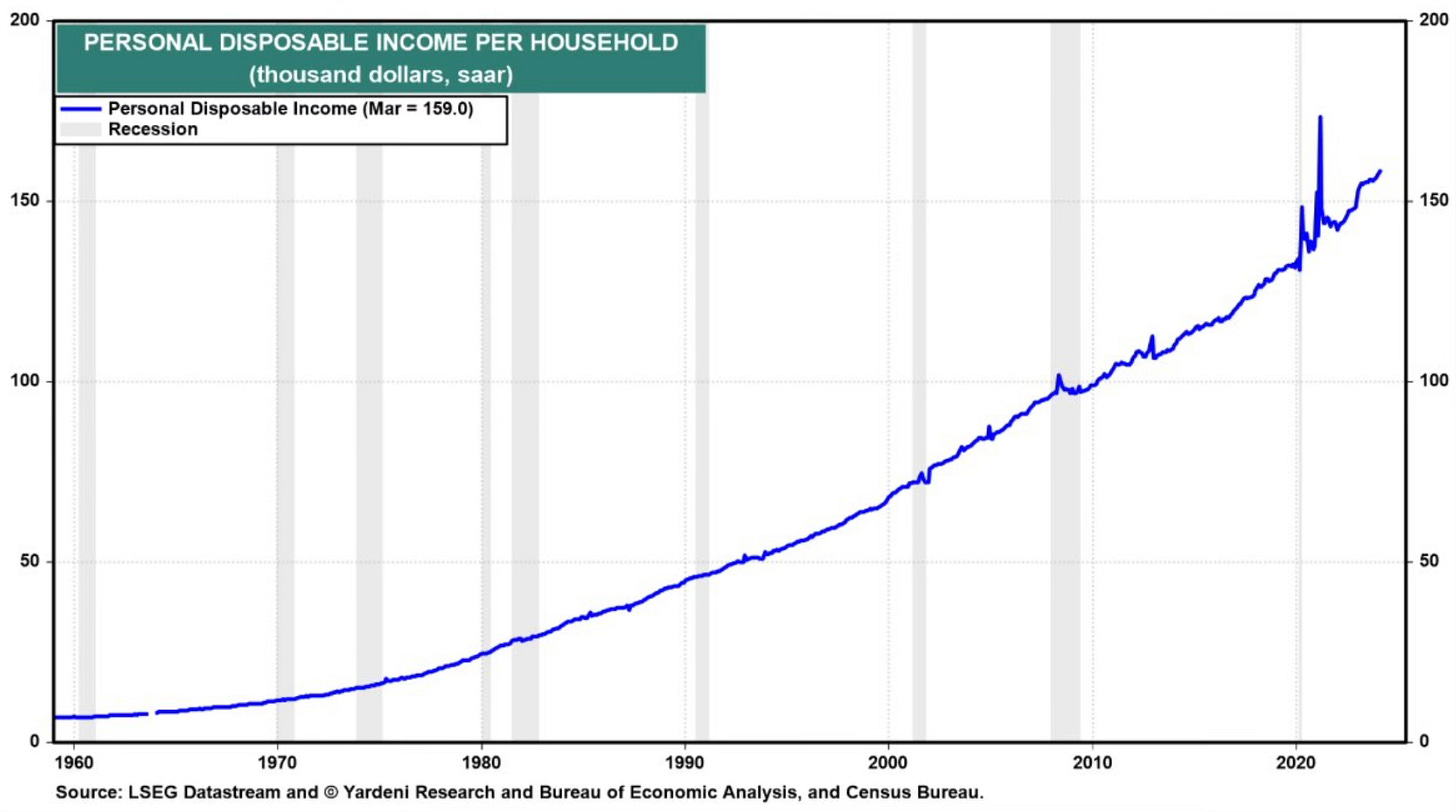
Then we move to what I think may be one of the most powerful charts of just how strong the consumer is. Minus the pandemic spike, personal disposable income per household is at an all-time high.
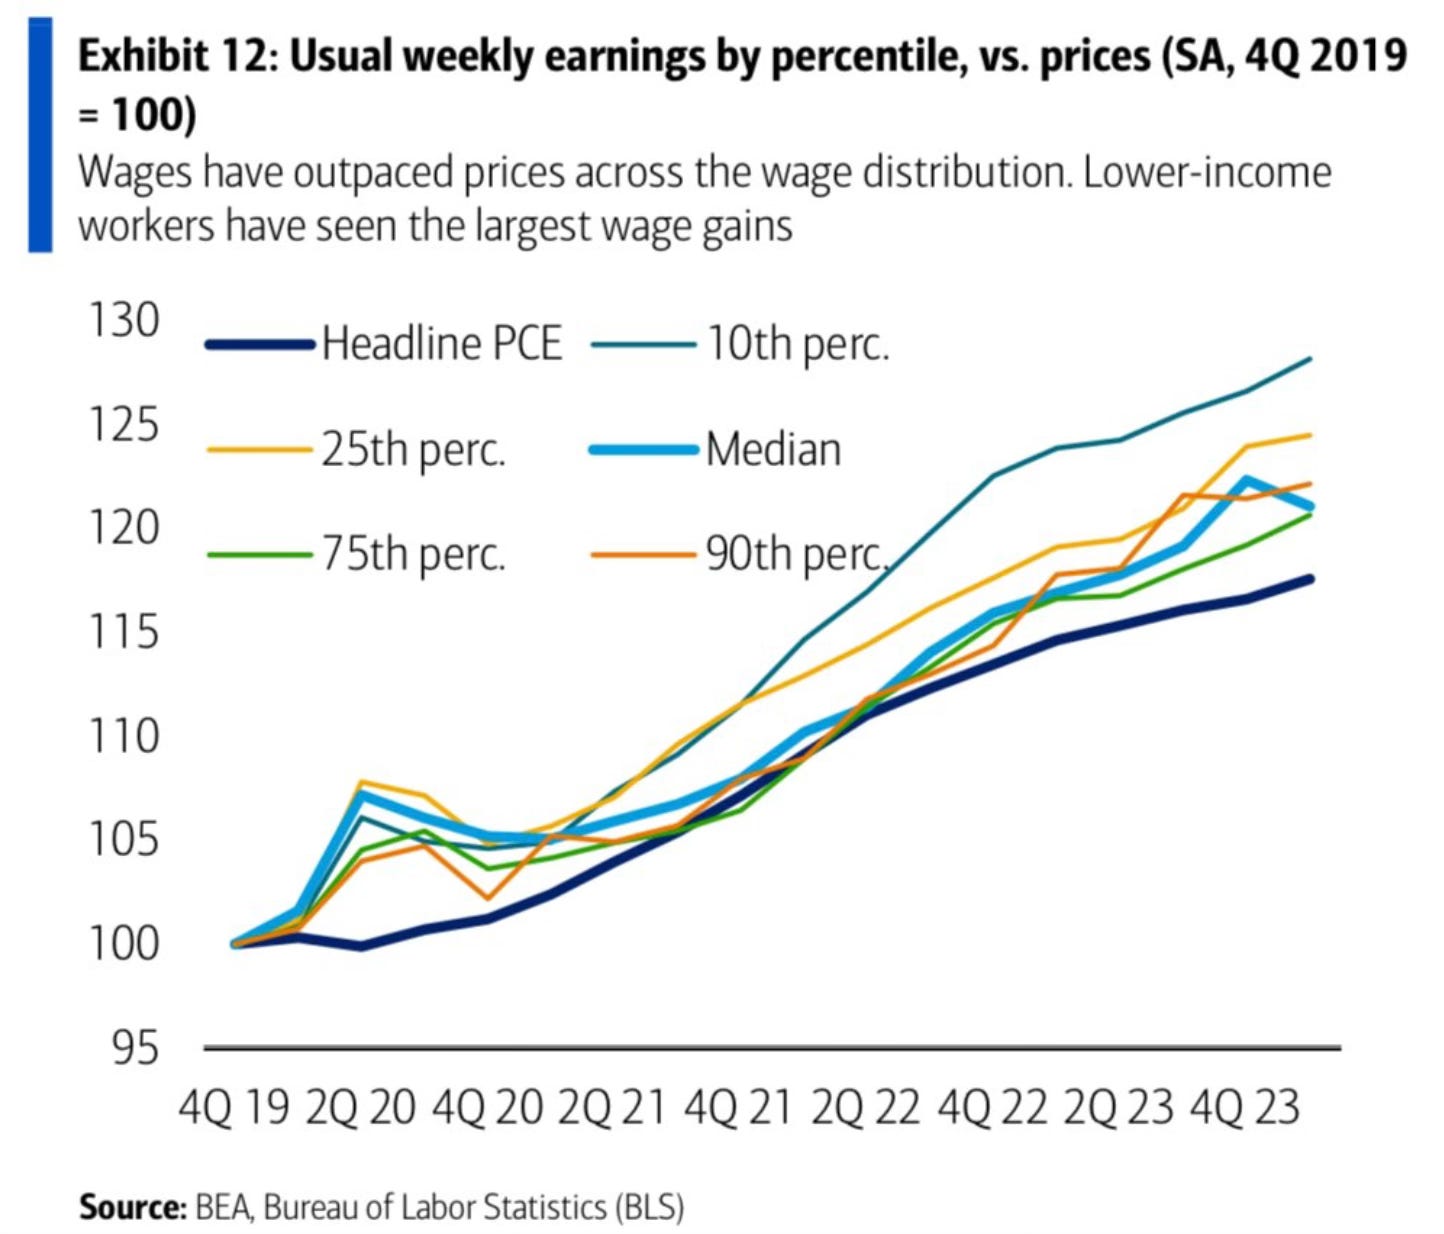
This has been helped by the wage gains across all the income segments. These wage gains across all income segments have outpaced prices.
This chart had an interesting note from BofA, “lower-income spending has generally outpaced higher-income spending on a y/y basis since early 2023, even excluding necessities (i.e., groceries and gas). This is consistent with the strength in blue-collar wage growth since the start of the pandemic.”
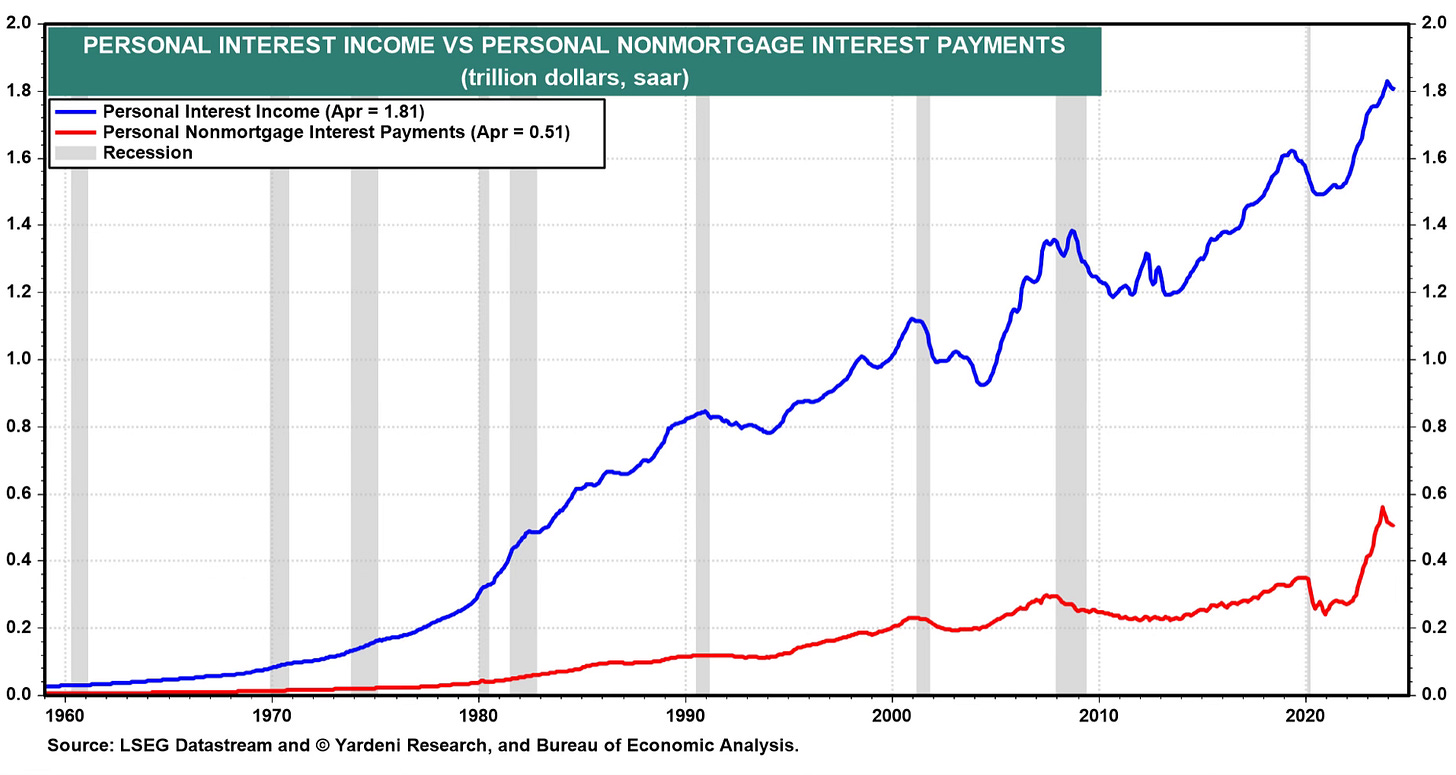
Then this chart from Eric Wallerstein does a good job summarizing the wealth effect.
“massive wealth effect from record asset prices plus nonlabor income (inverse of bank business models: everyone borrowed at 3% & earns 5% on MMFs).”
Who can forget the positive that extends from household mortgage debt. Right now household mortgage debt as a percentage of household real estate value is nearing an all-time low.

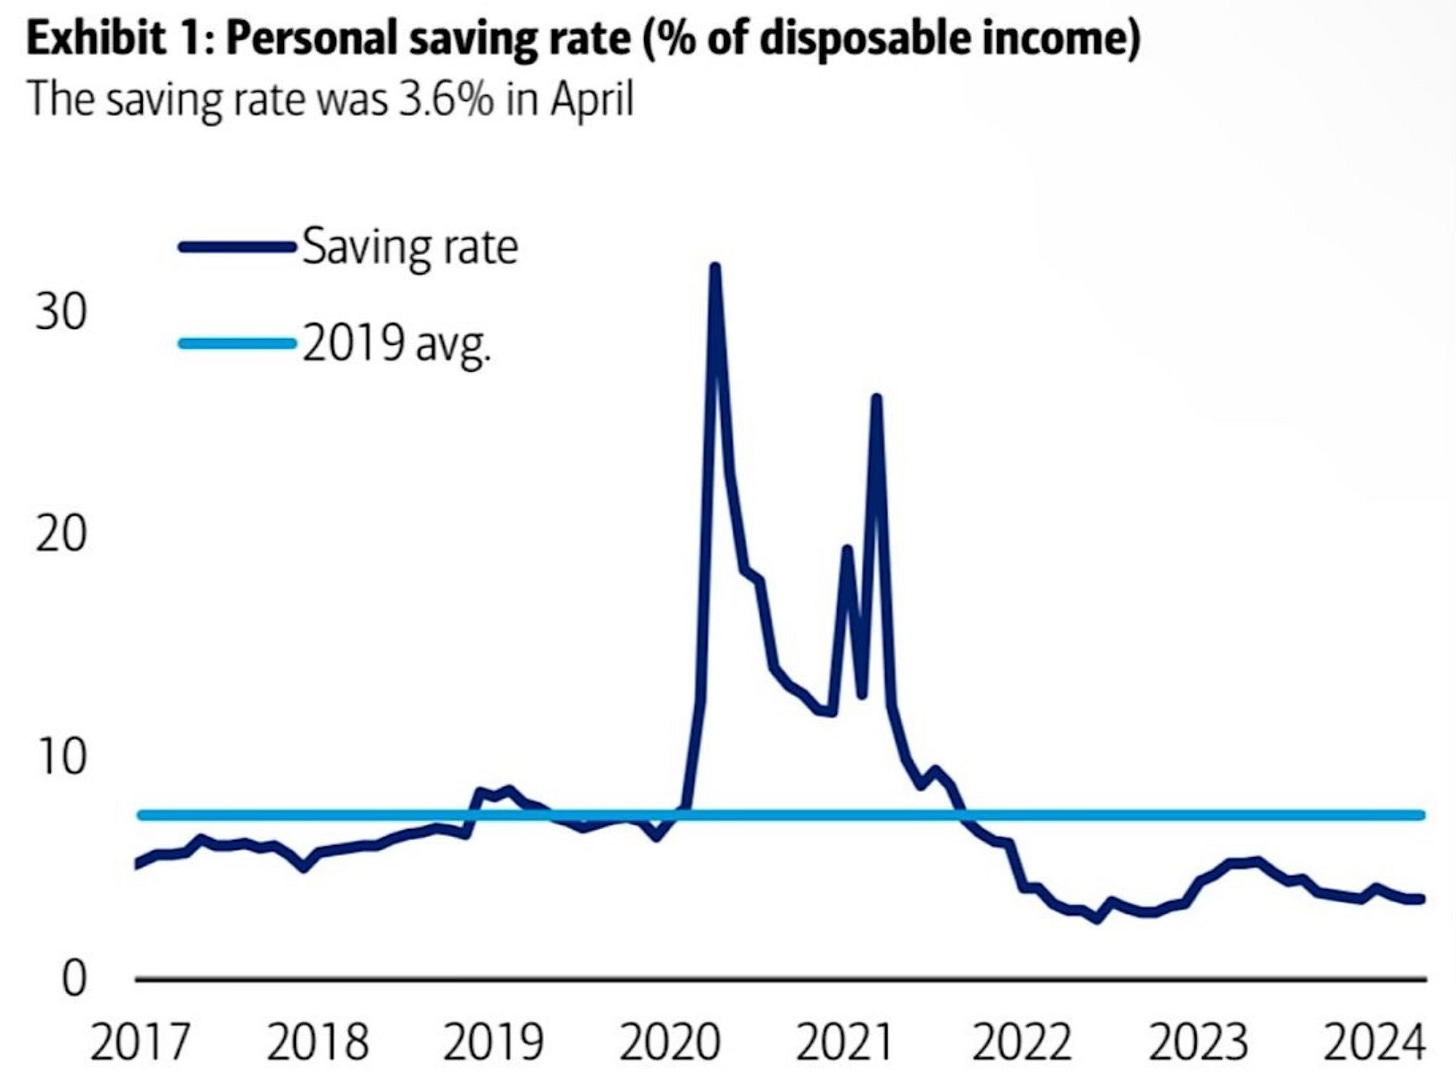
And let’s face it, people continue to spend. The savings rate remains low as consumers continue to spend instead of save.
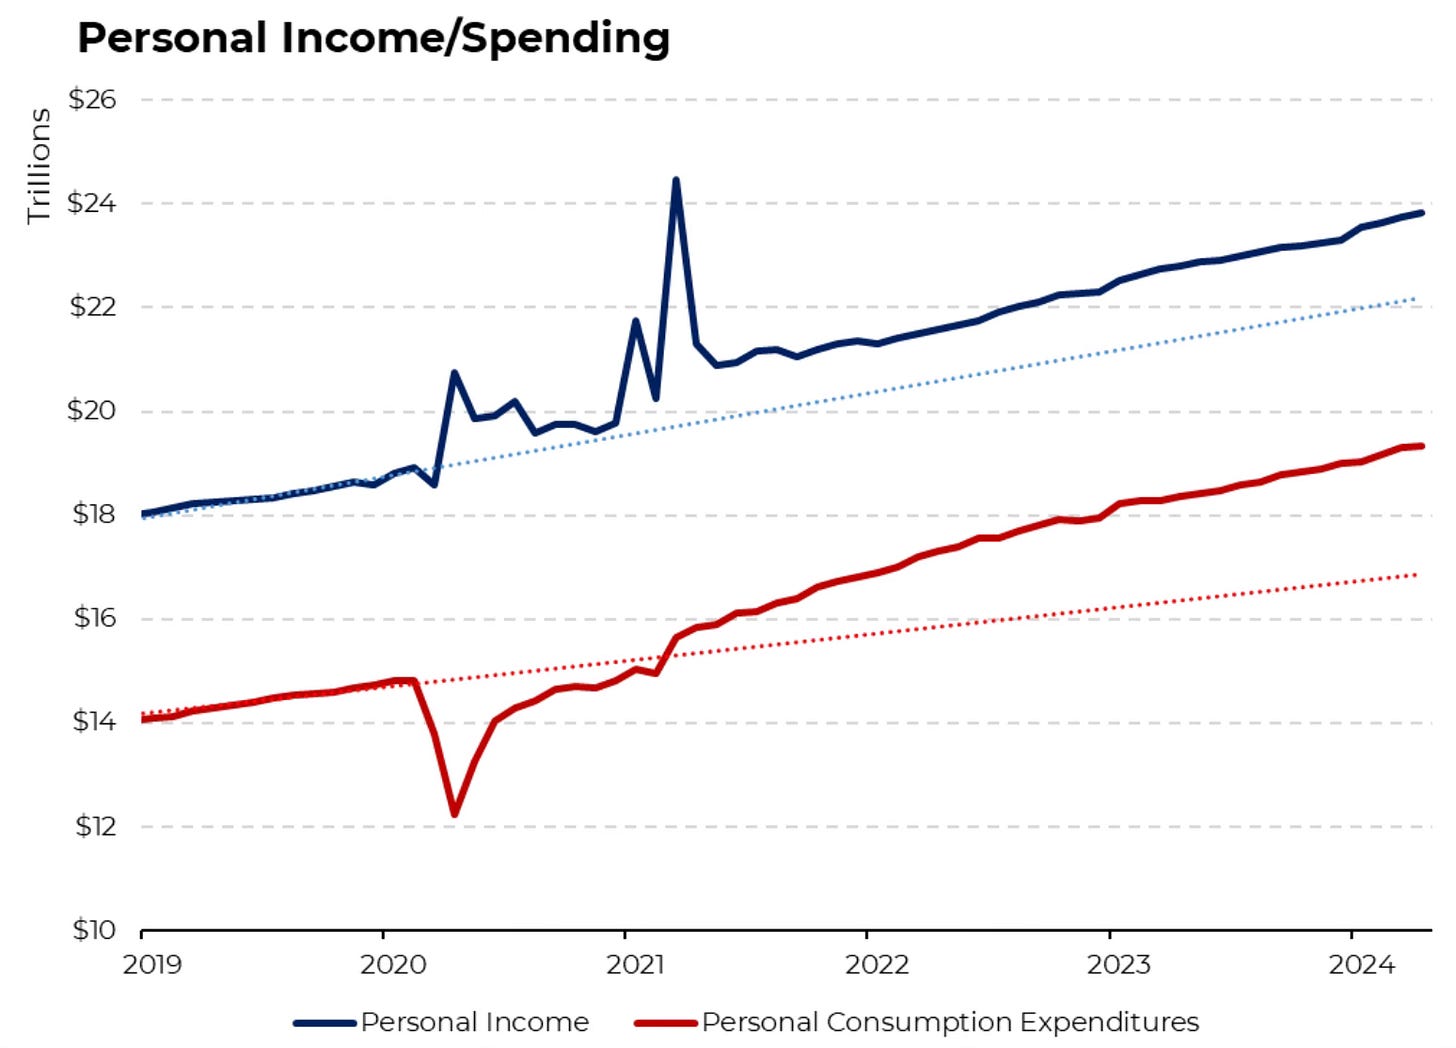
Personal income has allowed this to continue. If we look at April, personal incomes rose 0.3% while spending rose 0.2%.
The pushback to some of this is in the following.
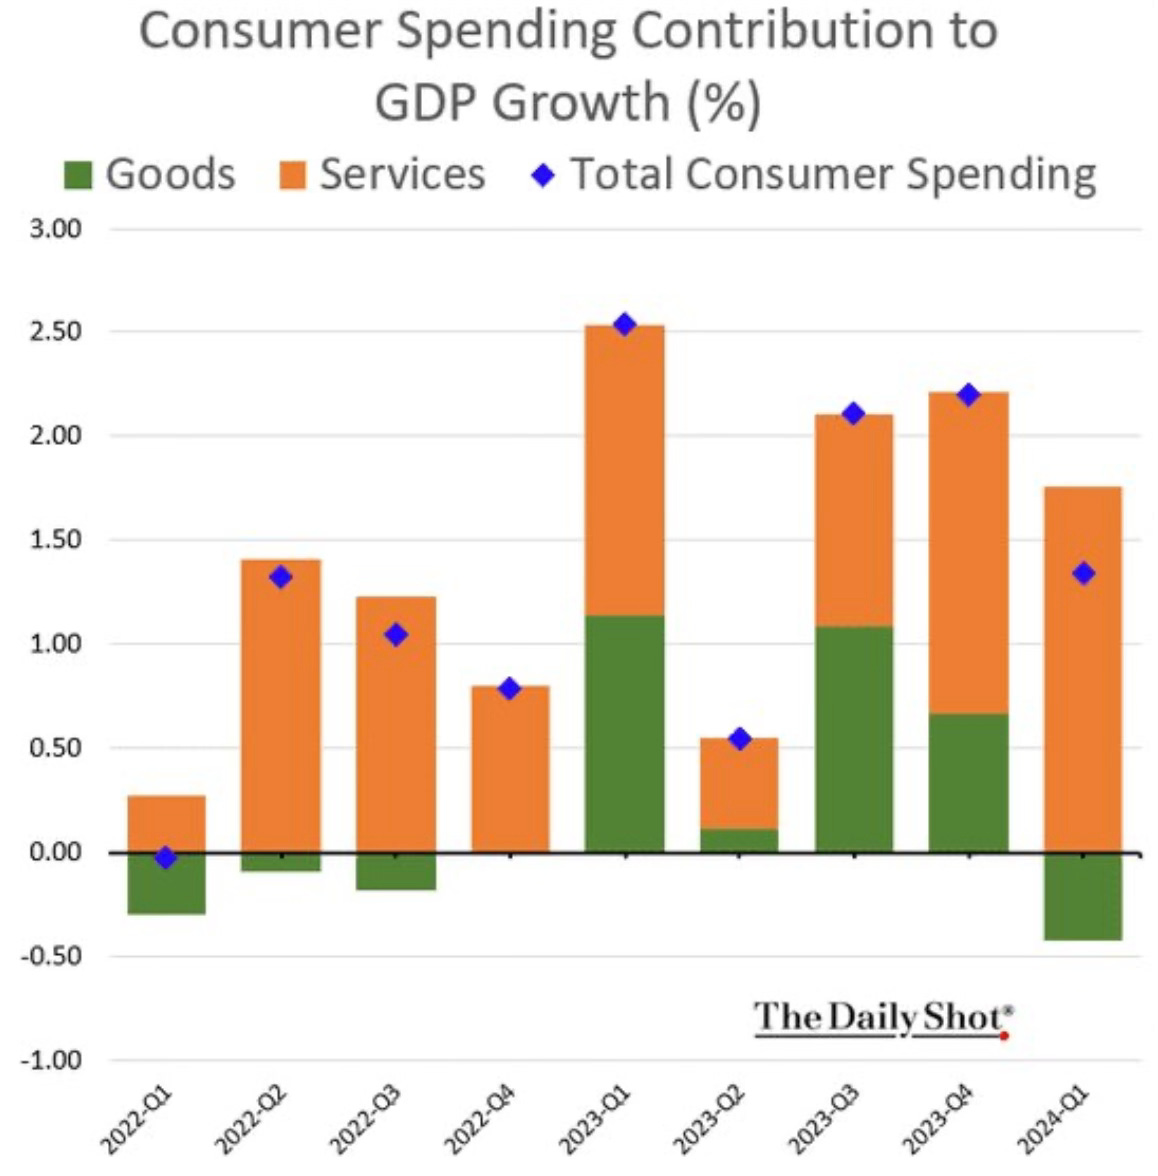
Consumer spending has begun to slow. You can see the drop off in Q1 of this year and how much of a drop compared to Q1 2023.
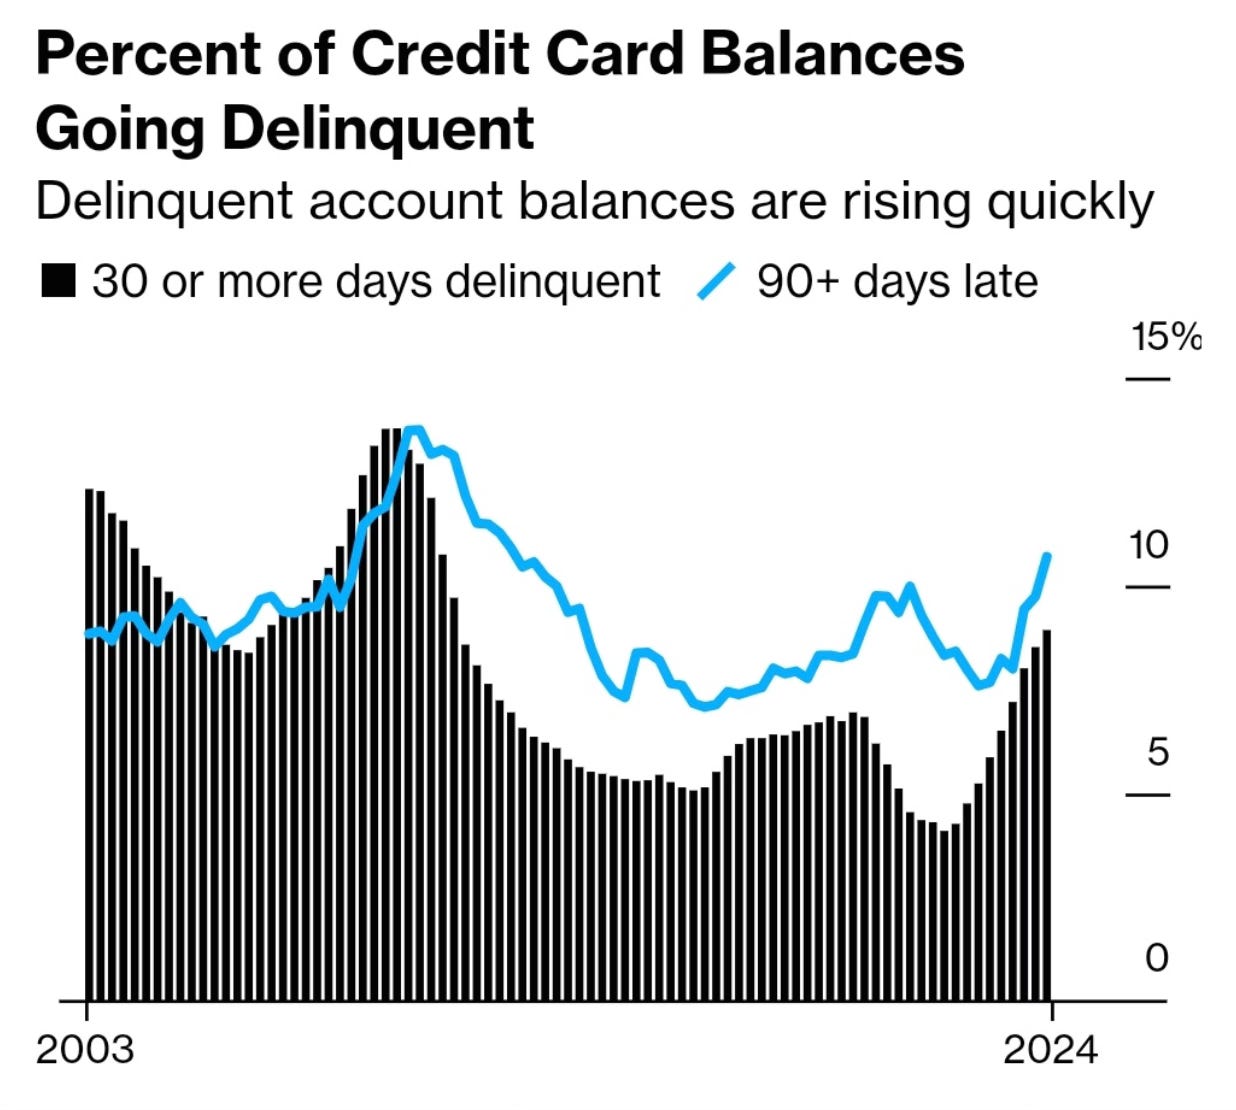
The percentage of credit card balances going delinquent have been rising. This is calling into question how much longer can this be sustained.
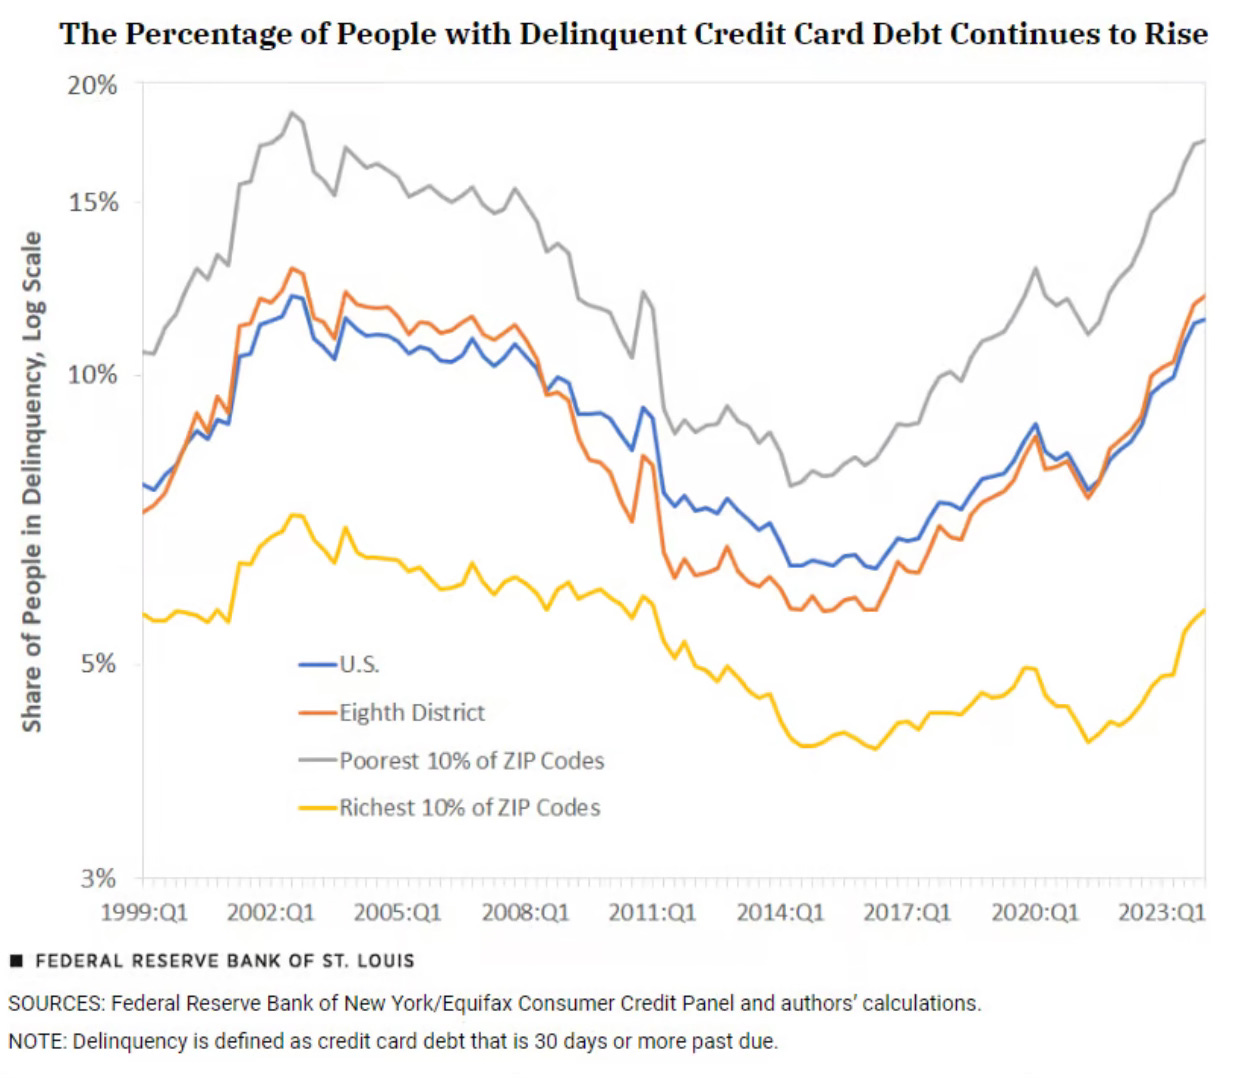
Zeroing in a little deeper does show these lines going in the wrong direction.
One clash with the credit card debt view is where the credit card debt is as a percentage of disposable income. Credit card debt is up, but so are incomes. You can see the level has crept up of late, but it’s still low historically.

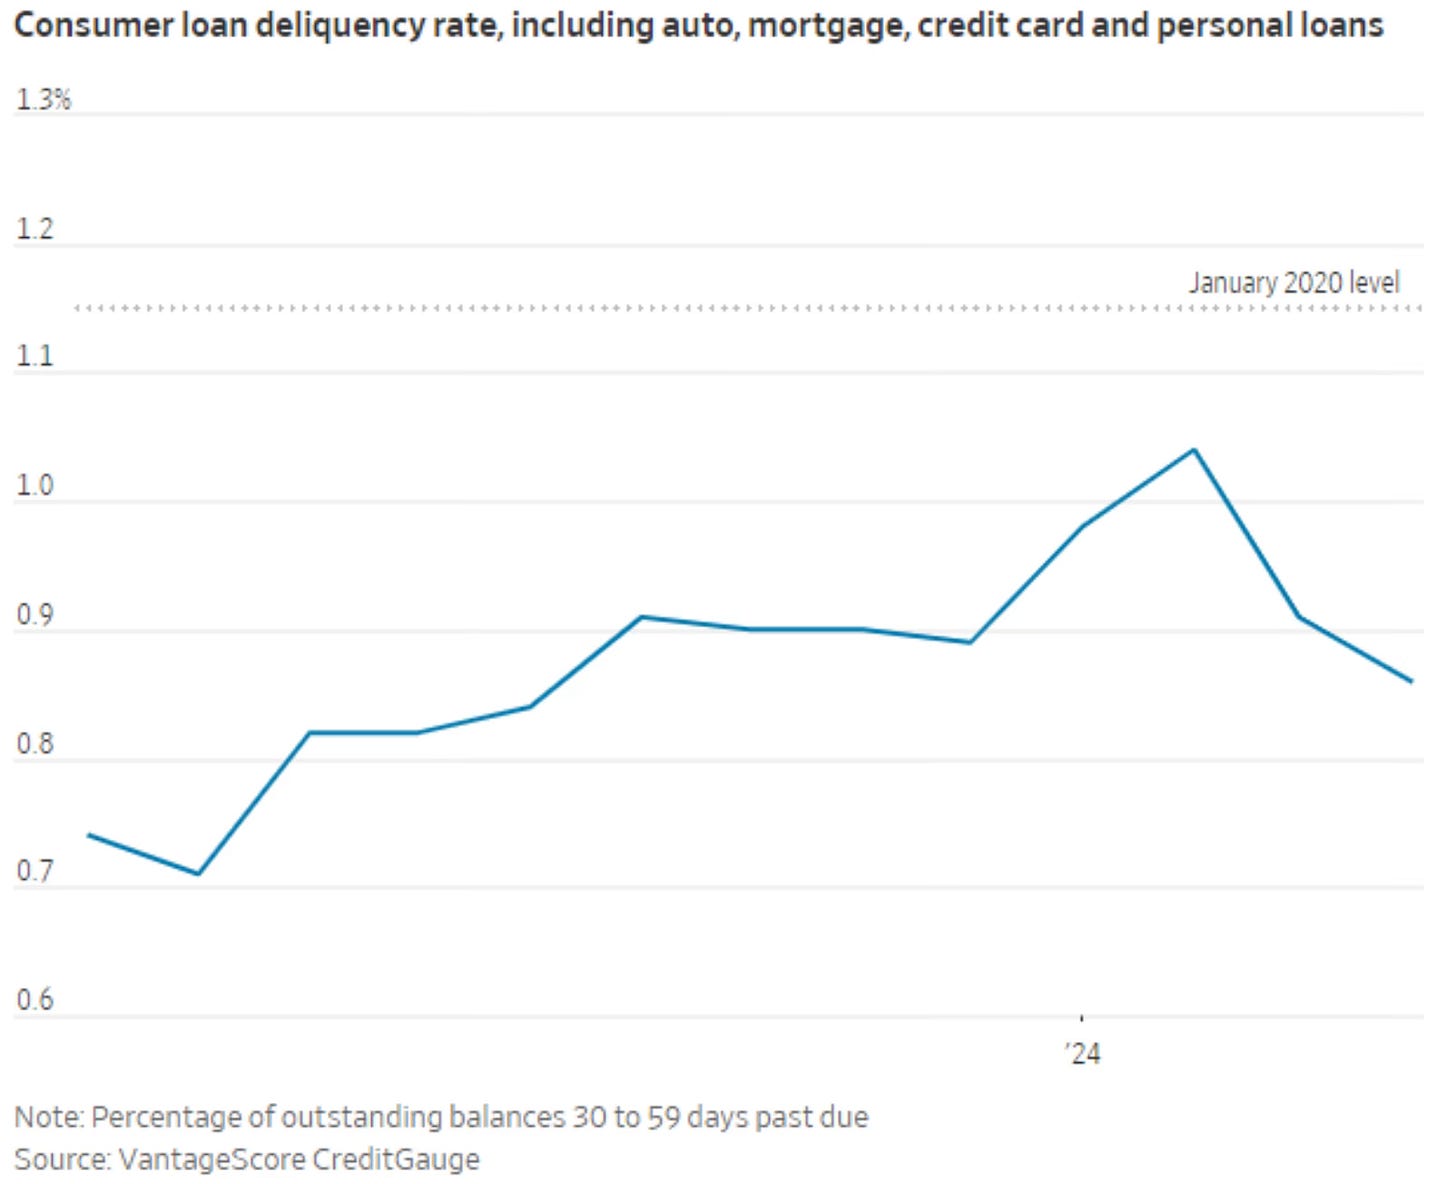
If we look out with a wider lense of the consumer loan delinquency rate, which includes, auto, mortgage, credit card and personal loans. You can see that it’s still very low and not near the pre-pandemic rate in January 2020.
From the WSJ, “"The latest monthly data from CreditGauge showed the percentage of overall outstanding balances of consumer debt—encompassing auto, card, home and personal loans—that was 30 to 59 days past due fell to 0.86% in April, down from the recent peak of 1.04% in February."
Expect the mixed signals and opinions to continue. Today the consumer can be in great shape. That could change this month or next.
The Consumer Discretionary sector stocks may be looking forward and maybe the consumer does weaken further in the coming months.
Does that happen? Or does the consumer strength continue? Or is it possible the consumer gets even stronger? You can take a guess, just like everyone else.
The Coffee Table ☕
I really liked this piece about 529s. Top 10 Reasons to Use a 529 I found this part to be quite interesting, “only about 1/3 of families actually use them for college savings. In fact, a recent survey showed that only about half of American adults have heard of 529s.” I’m a fan of these as I have one setup for both of my kids.
Thank you for reading! If you enjoyed Spilled Coffee, please subscribe.
Spilled Coffee grows through word of mouth. Please consider sharing this post with someone who might appreciate it.
Order my book, Two-Way Street below.

