


Investing Update: 2 Indicators Flashing 🔥
What I'm buying, selling & watching
What a week of green! We saw the week finish up four days in a row. Tuesday, Wednesday, Thursday and Friday were all green.
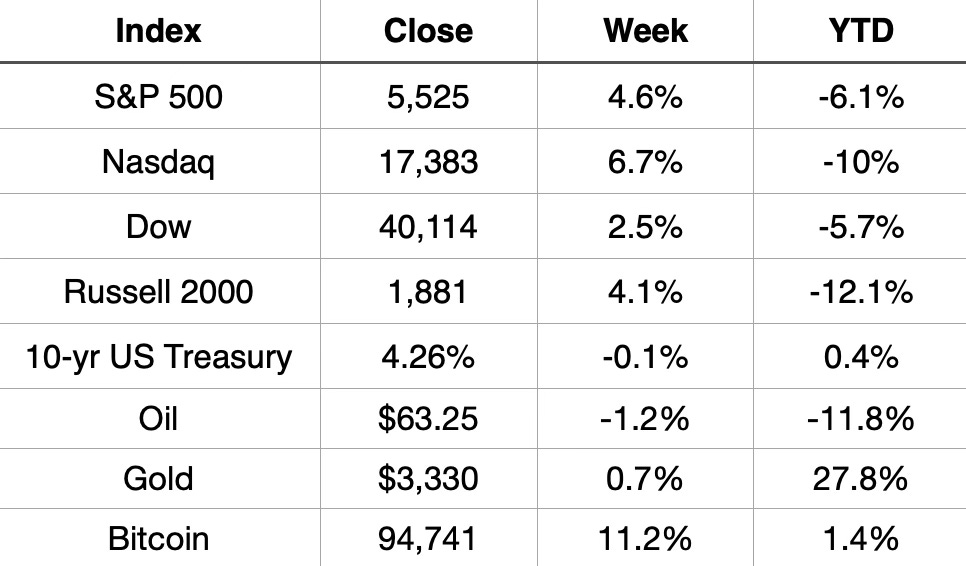
That was good enough to boost the S&P by 4.6% for its 4th best week since November 2022. The Nasdaq was up 6.7% for its 2nd best week since November 2022. The Dow was also up 2.5% on the week.
Market Recap
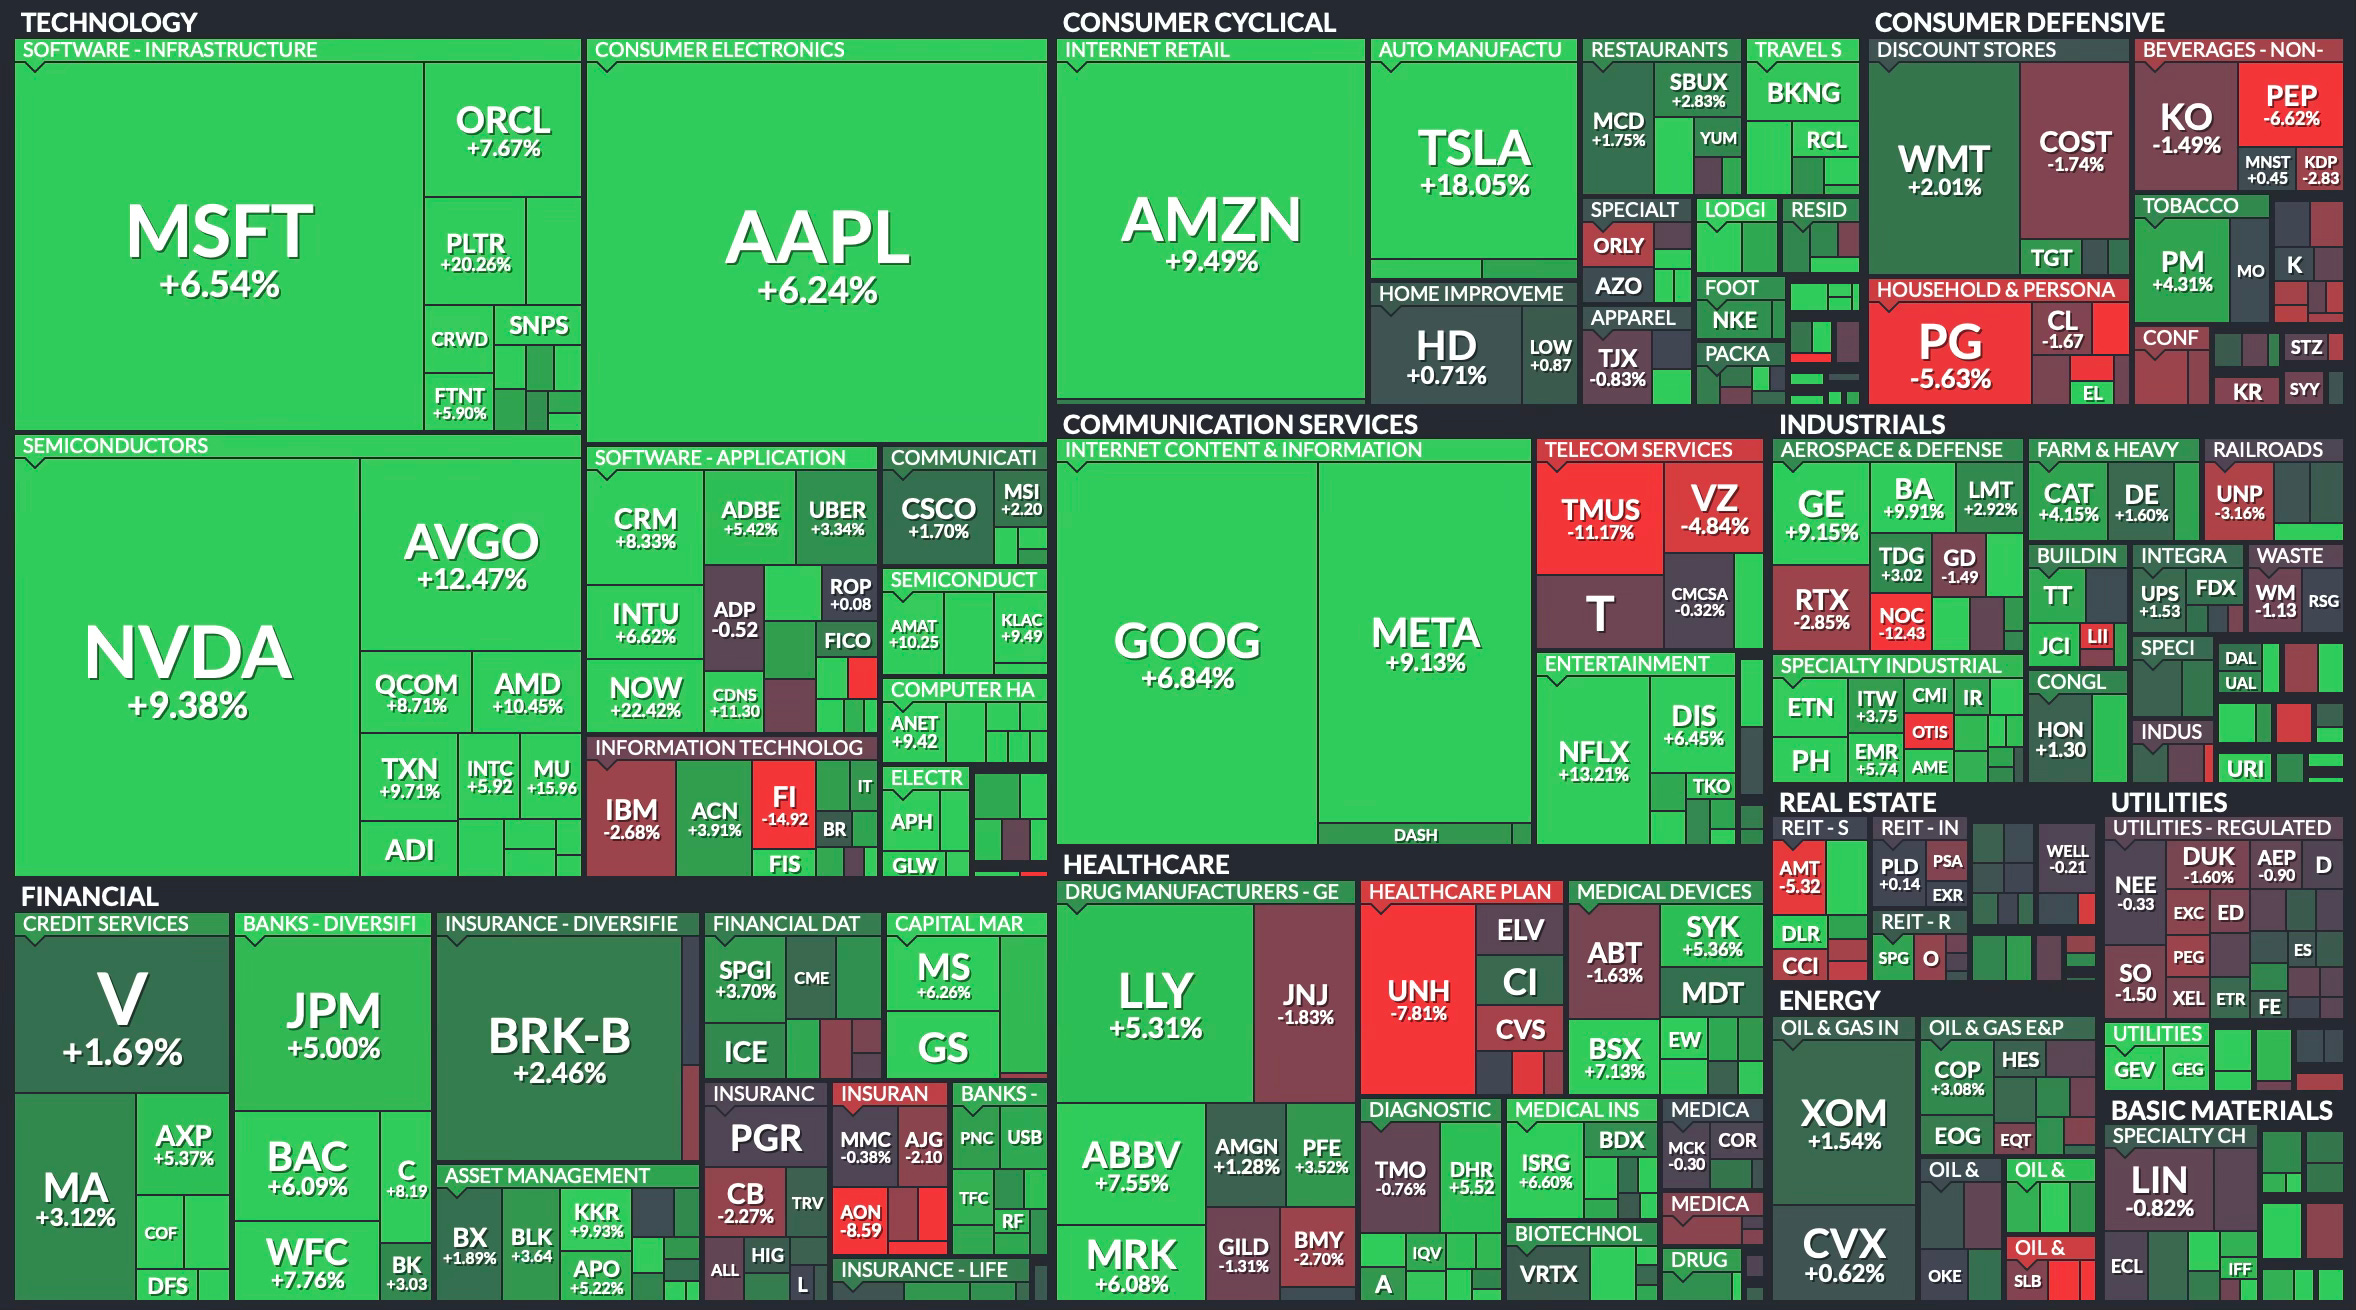
Weekly Heat Map Of Stocks
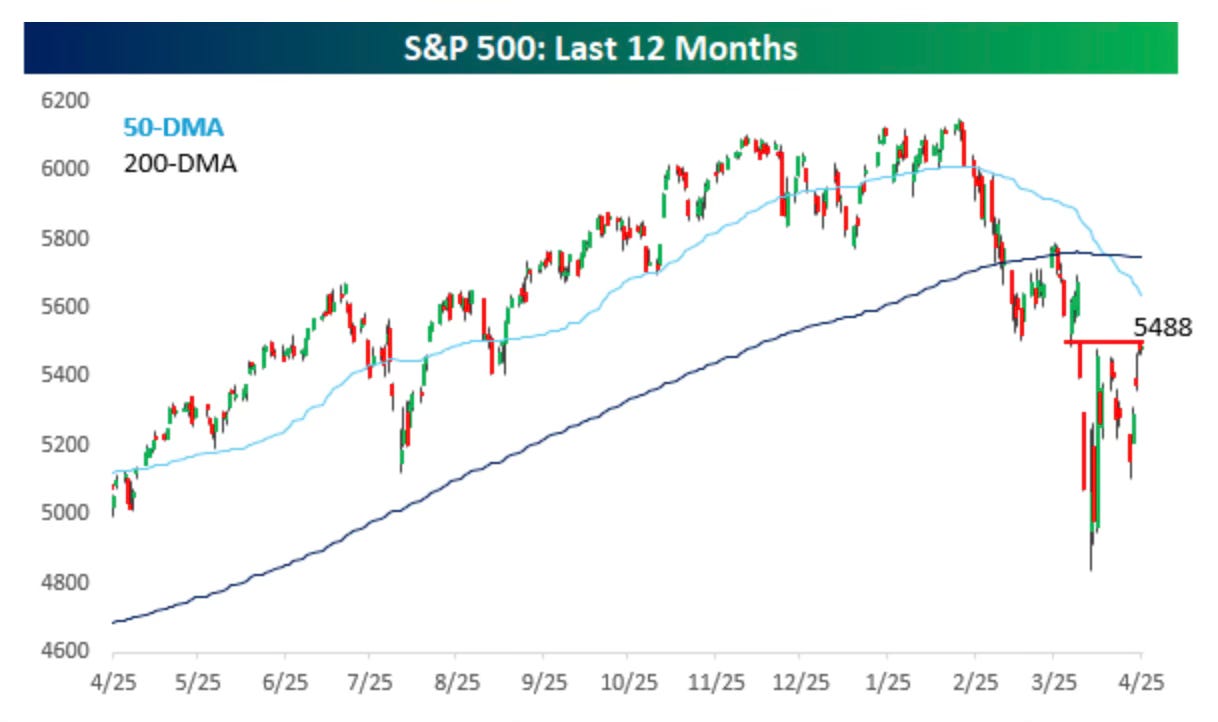
We’re almost back to the same levels as in late March. A rally back is well underway.
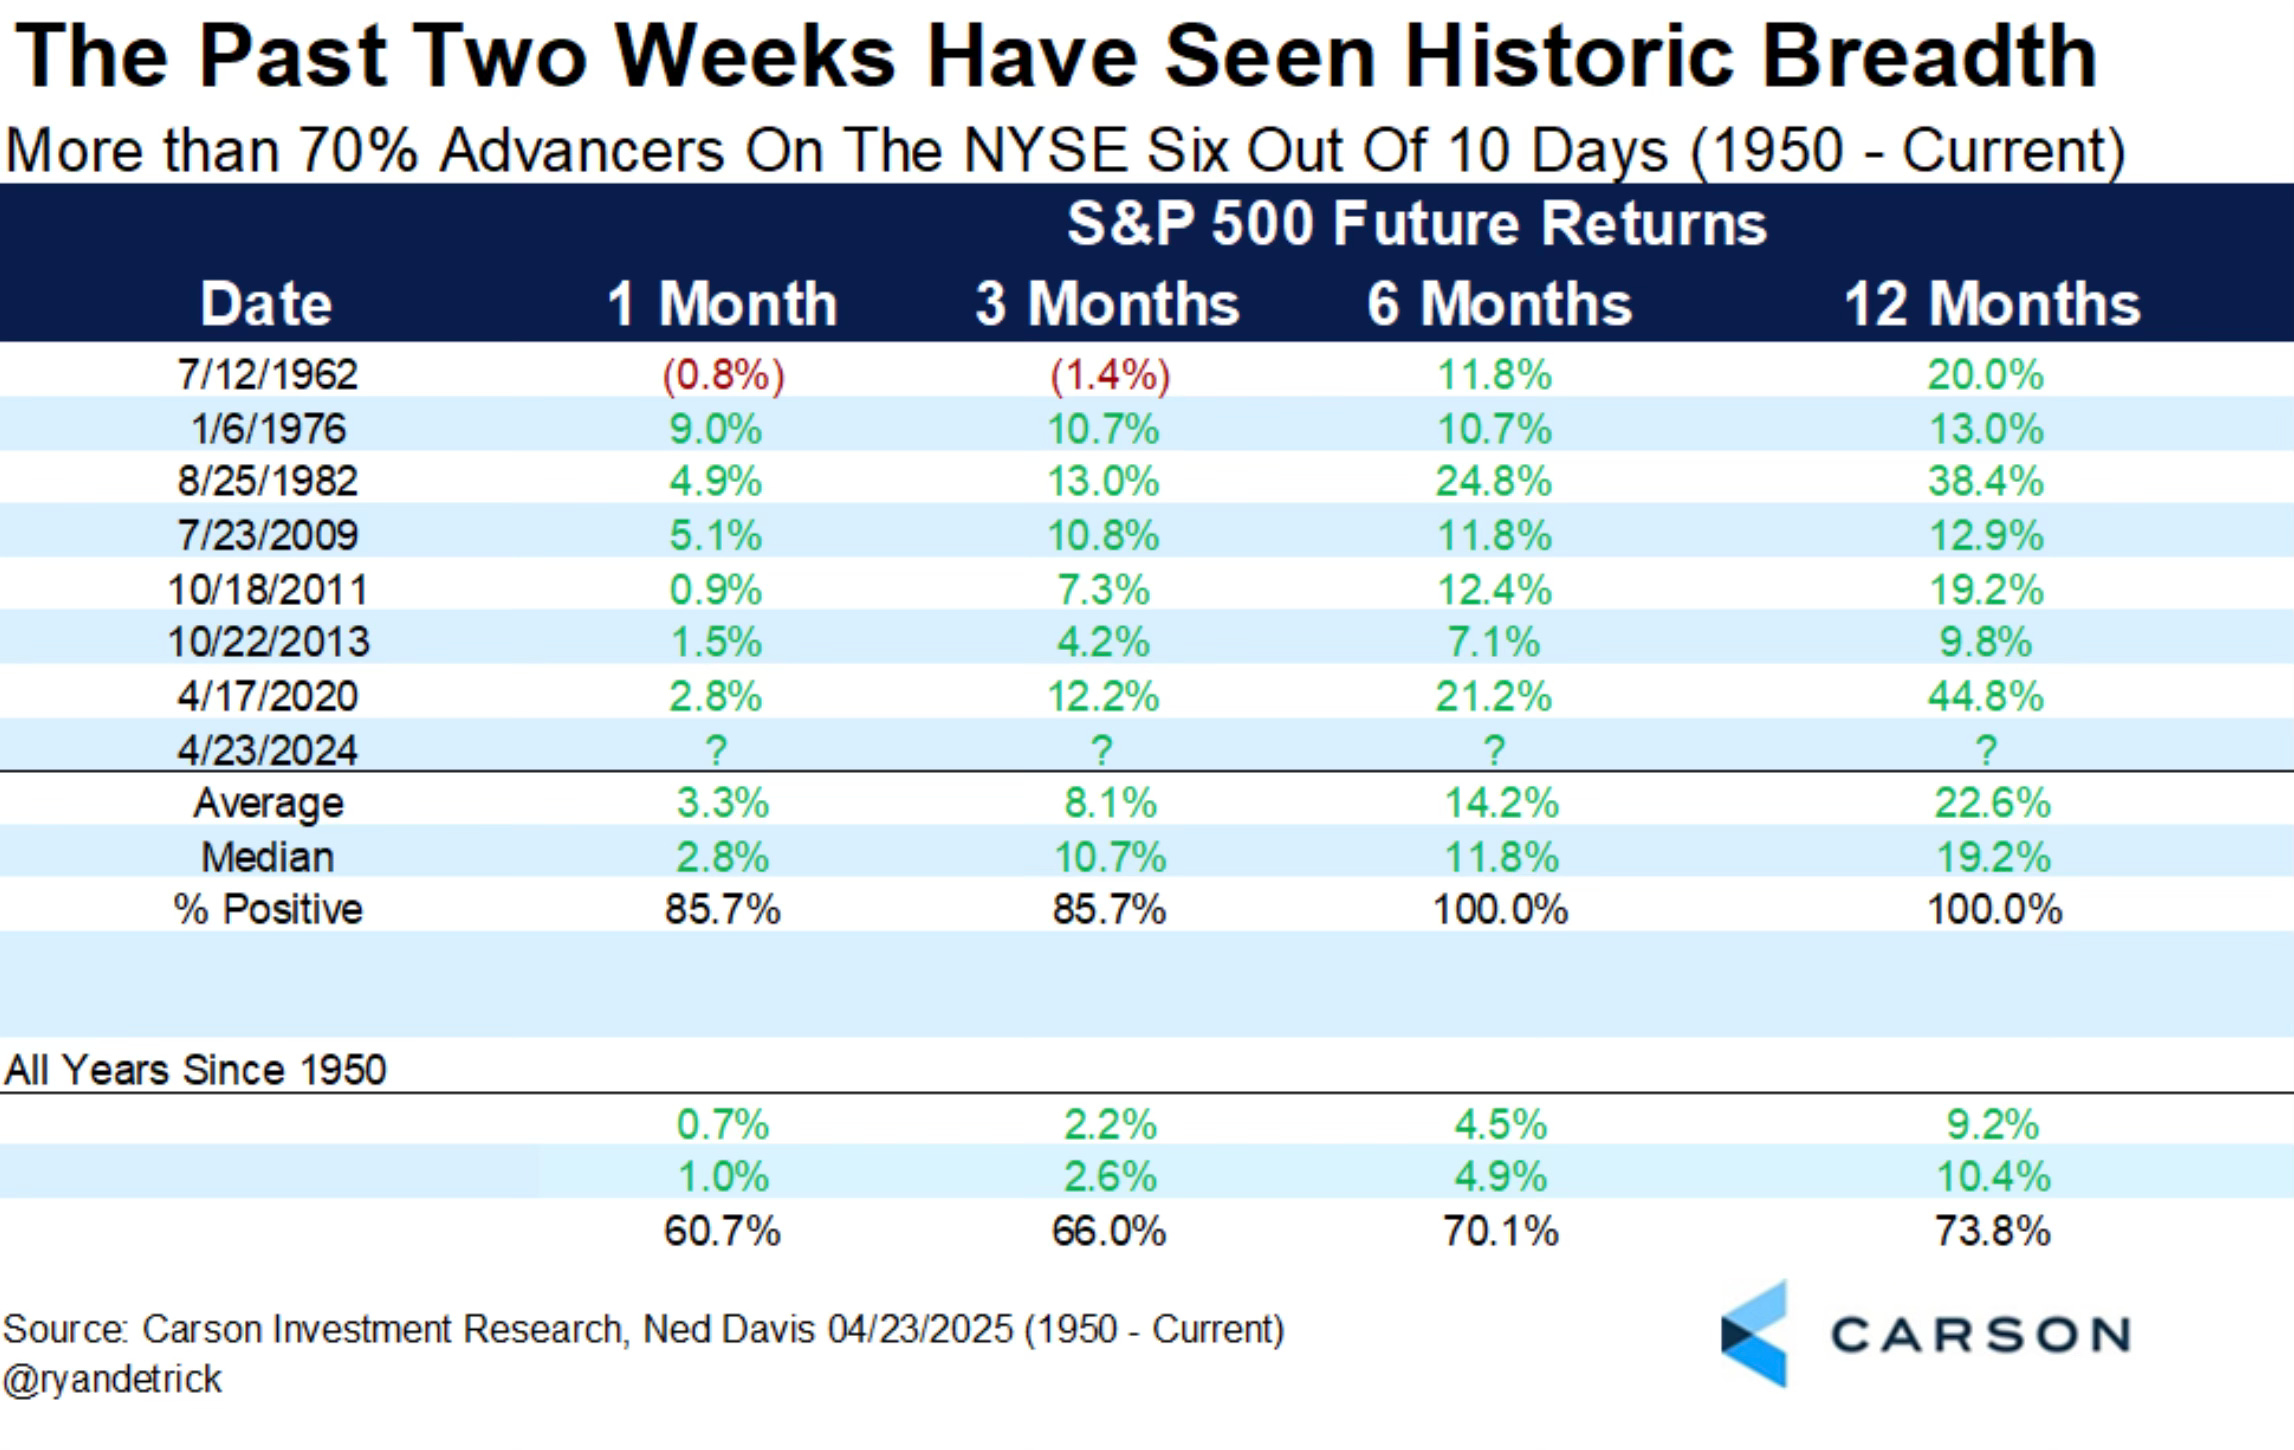
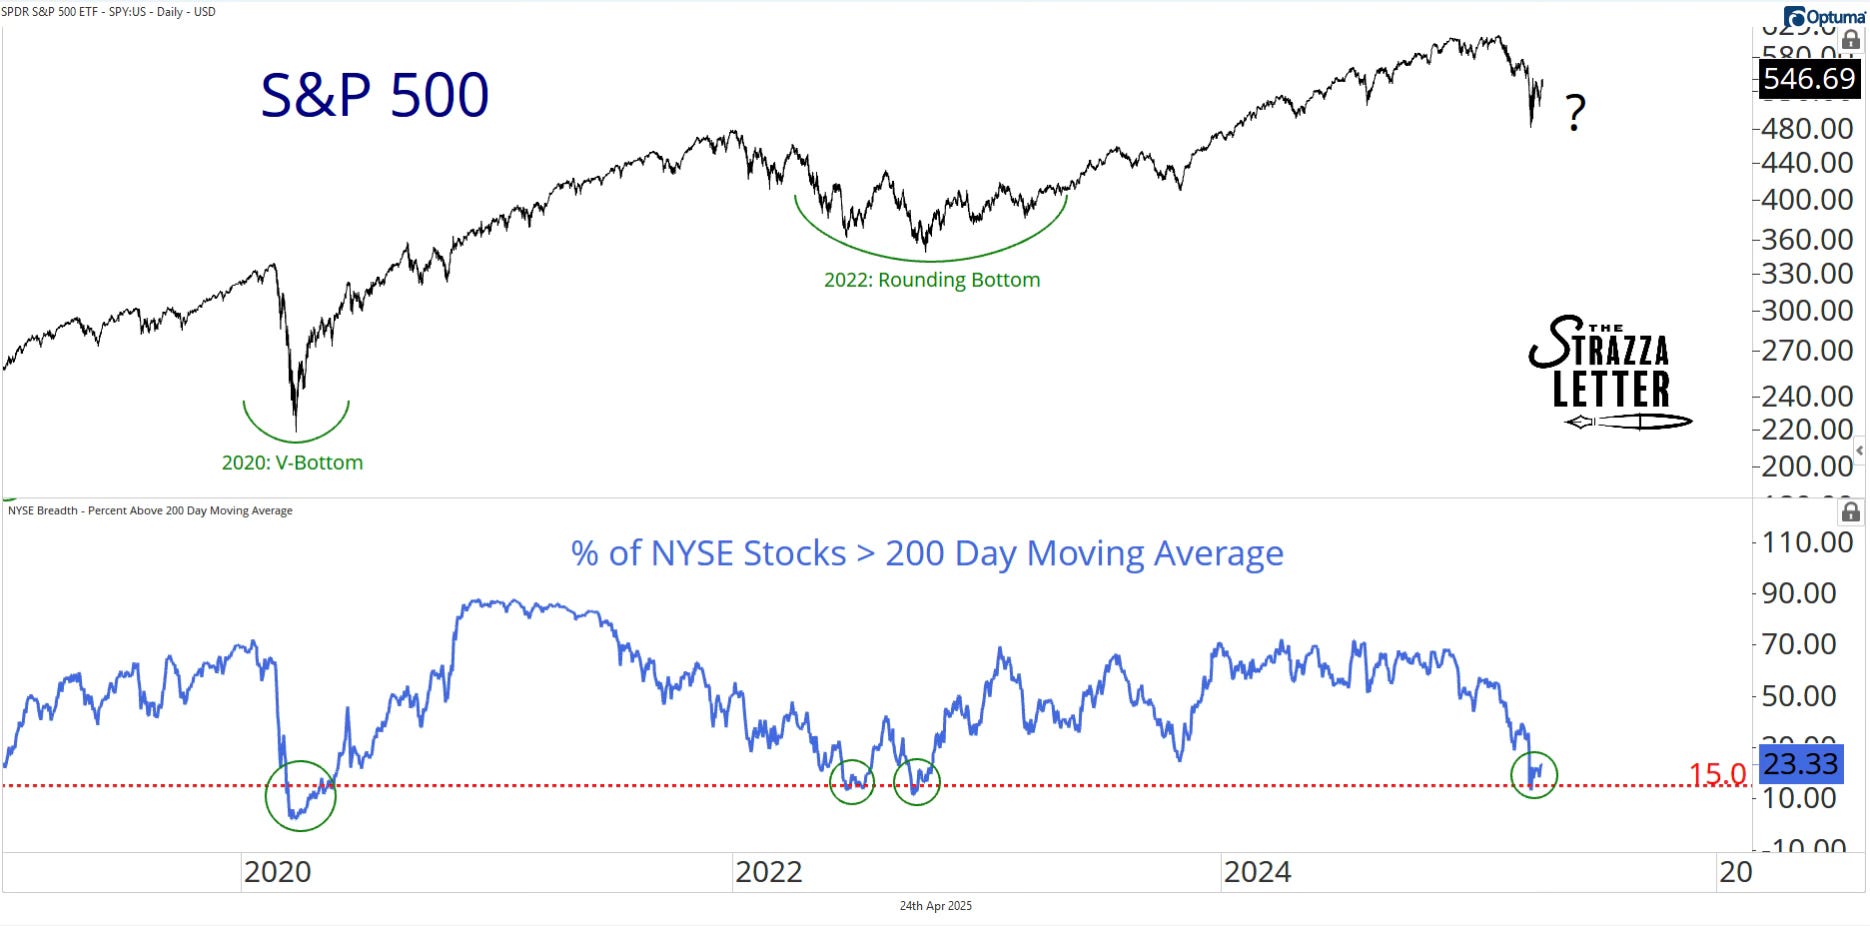
Over the past two weeks we’ve now seen 6 days with more than 70% advancers on the NYSE. That isn’t any bear market activity. It’s bullish behavior.
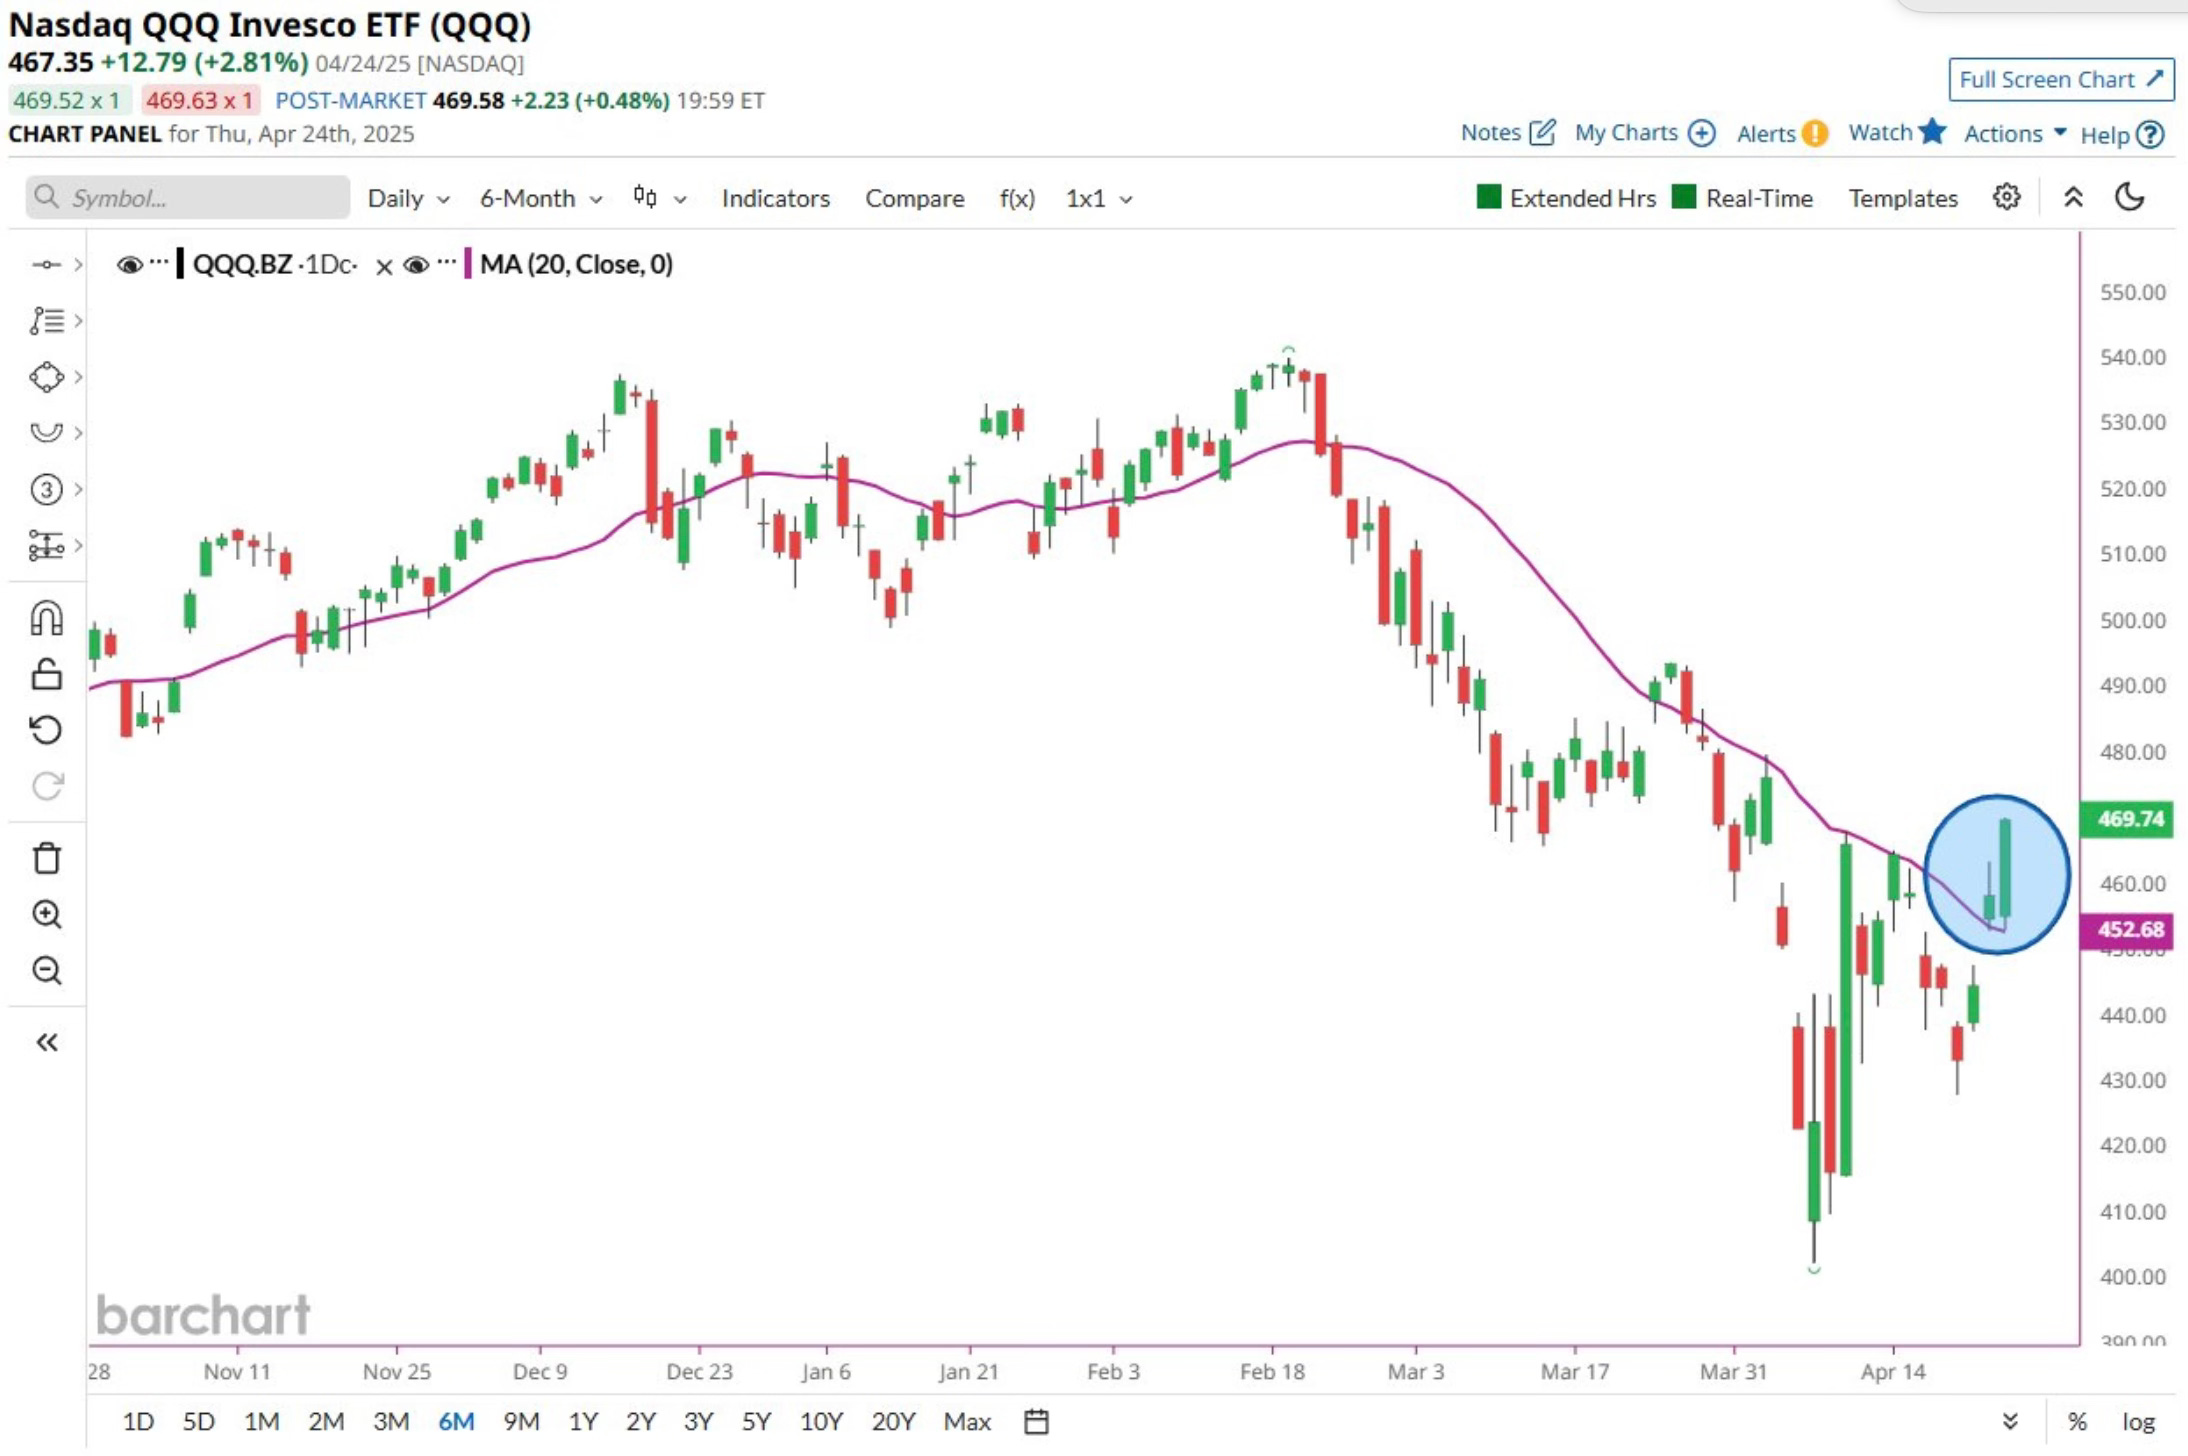
The Nasdaq has now climbed back above its 200-day. It’s also now positive for the month of April.
I like the v-bottom point that Steve Strazza points out here in this chart about the bottoms in the past two cycles and how this one looks similar.
This is also now the lowest close on the VIX since Liberation Day.
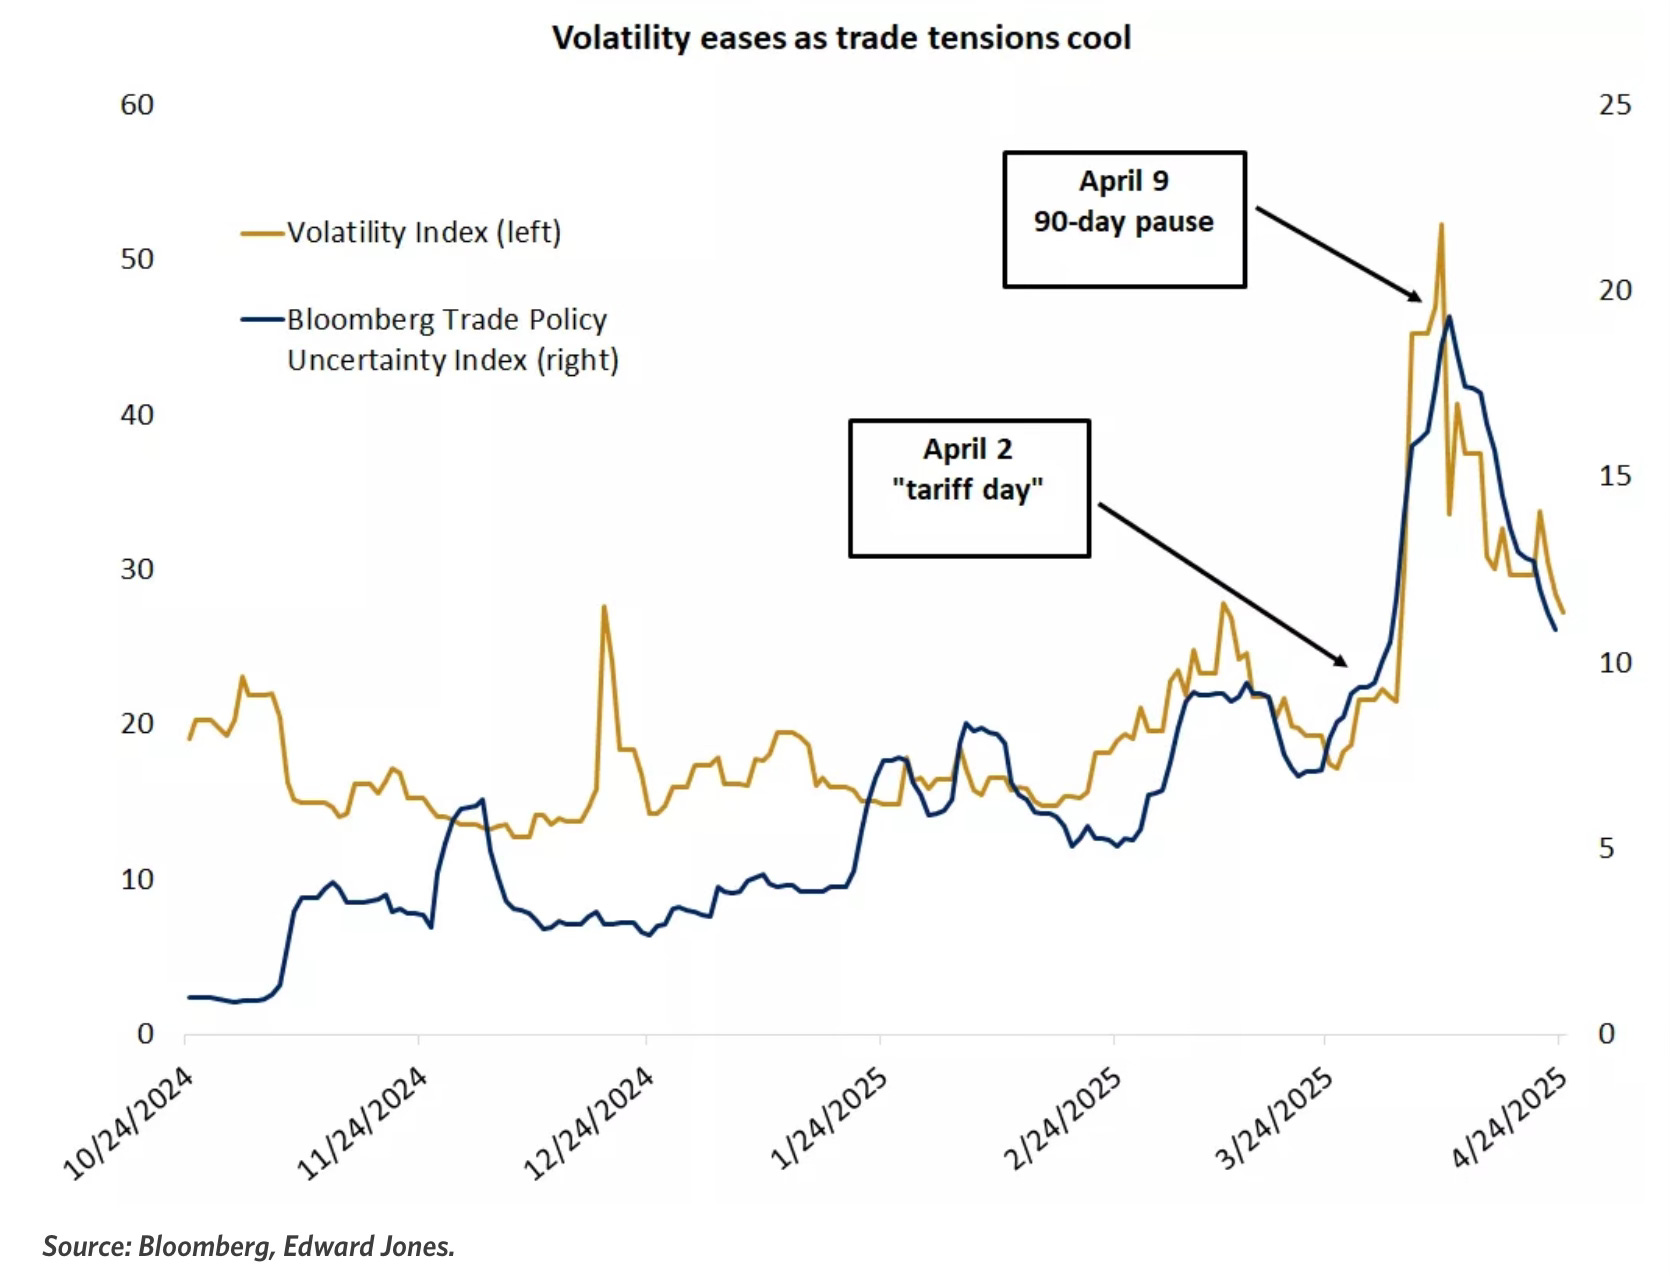
What a fast change the market has made. Recession odds lowered, the VIX dropped, lower credit spreads and the talk around tariffs has been better. Investors are starting to feel better about the trade war being sorted out.
The S&P 500 is now only down 6.1% for 2025. Things sure move quick.
2 Indicators Flashing 🔥
Last week in my Investing Update: Is The Worst Over? I said the following.
I believe they have. We saw concrete floor type support of 4,835. That’s also the 2022 high. I believe that 4,835 level will prove to be the bottom.
I had noticed some things made me comfortable stating that we had seen the bottom.
Then this week we saw the stock market roar higher. It was such a good week for the market that two very important indicators flashed and we need to take notice of them and what the road ahead means.