Investing Update: A Rotation Is Underway
What I'm buying, selling & watching
It has been a long time since all 7 of the indexes that I track each week in my Market Recap all finished down on the week. But this week they all finished in the red.
Market Recap

Weekly Heat Map Of Stocks
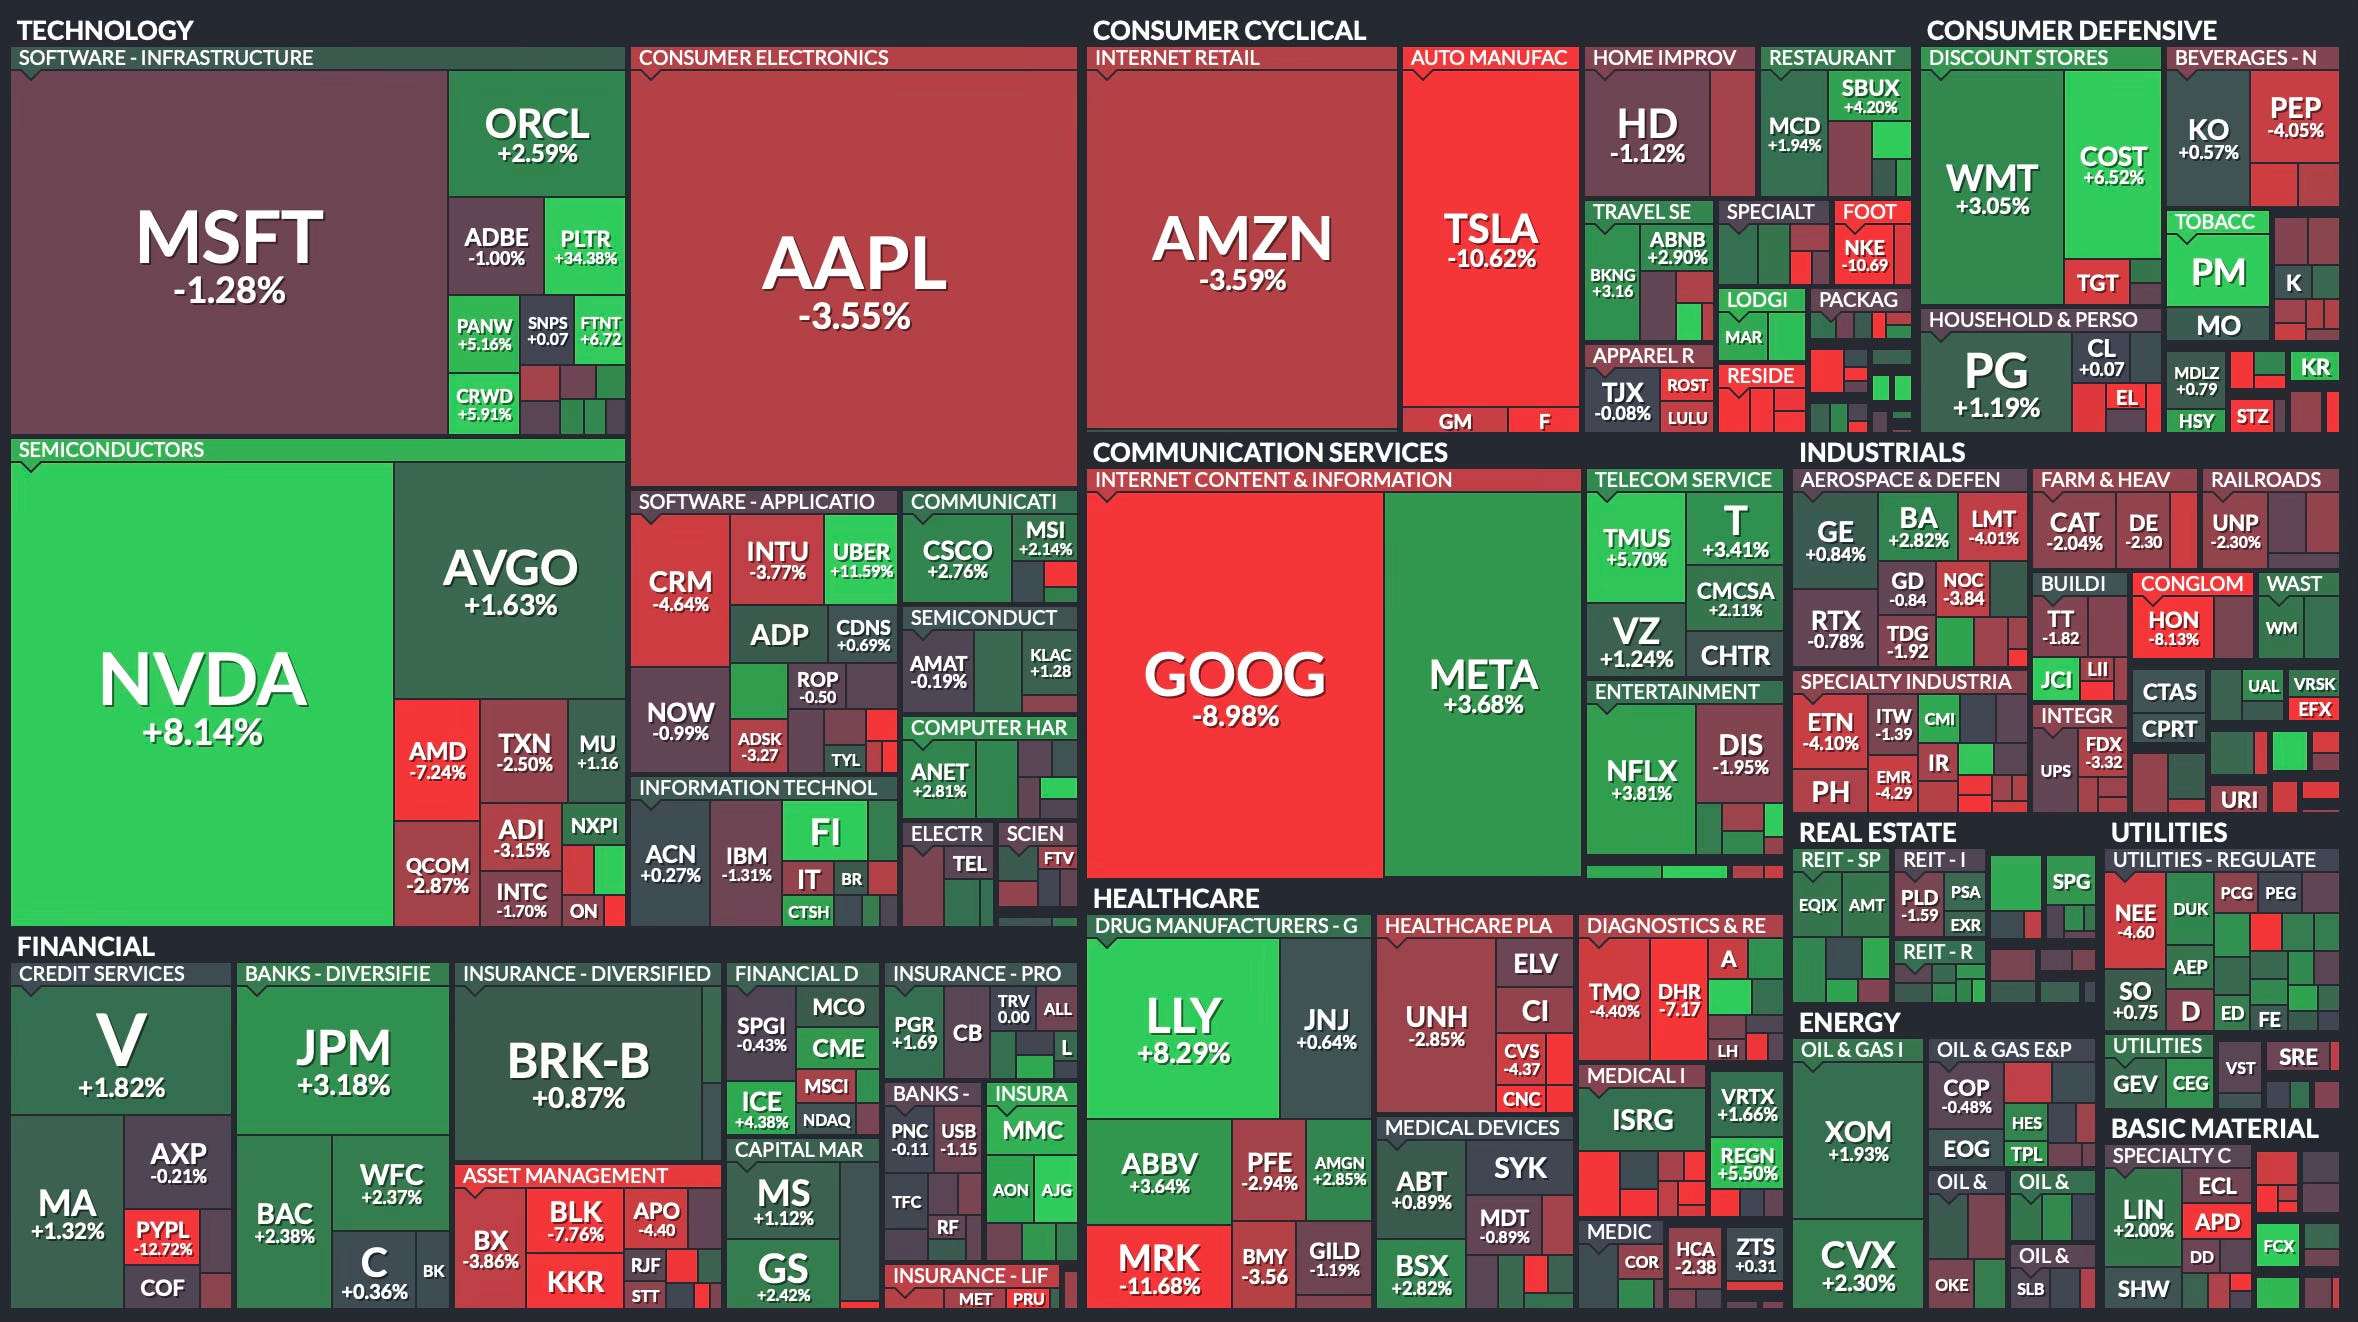
Even with the down week, Nvidia continues to bounce back and the S&P 500 sits only about 1% below the all-time high. It may not seem like it with all that has happened during the first five weeks of 2025, but the overall market remains very strong.
To look under the hood I go back to one of my favorite charts which comes from my friend Grant Hawkridge. The green, which is the % of S&P 500 stocks above both their 200-day and 50-day is starting to climb. Notice that the red, which is the % of S&P 500 stocks below their 200-day and 50-day is really shrinking. This is showing continued bull market strength.

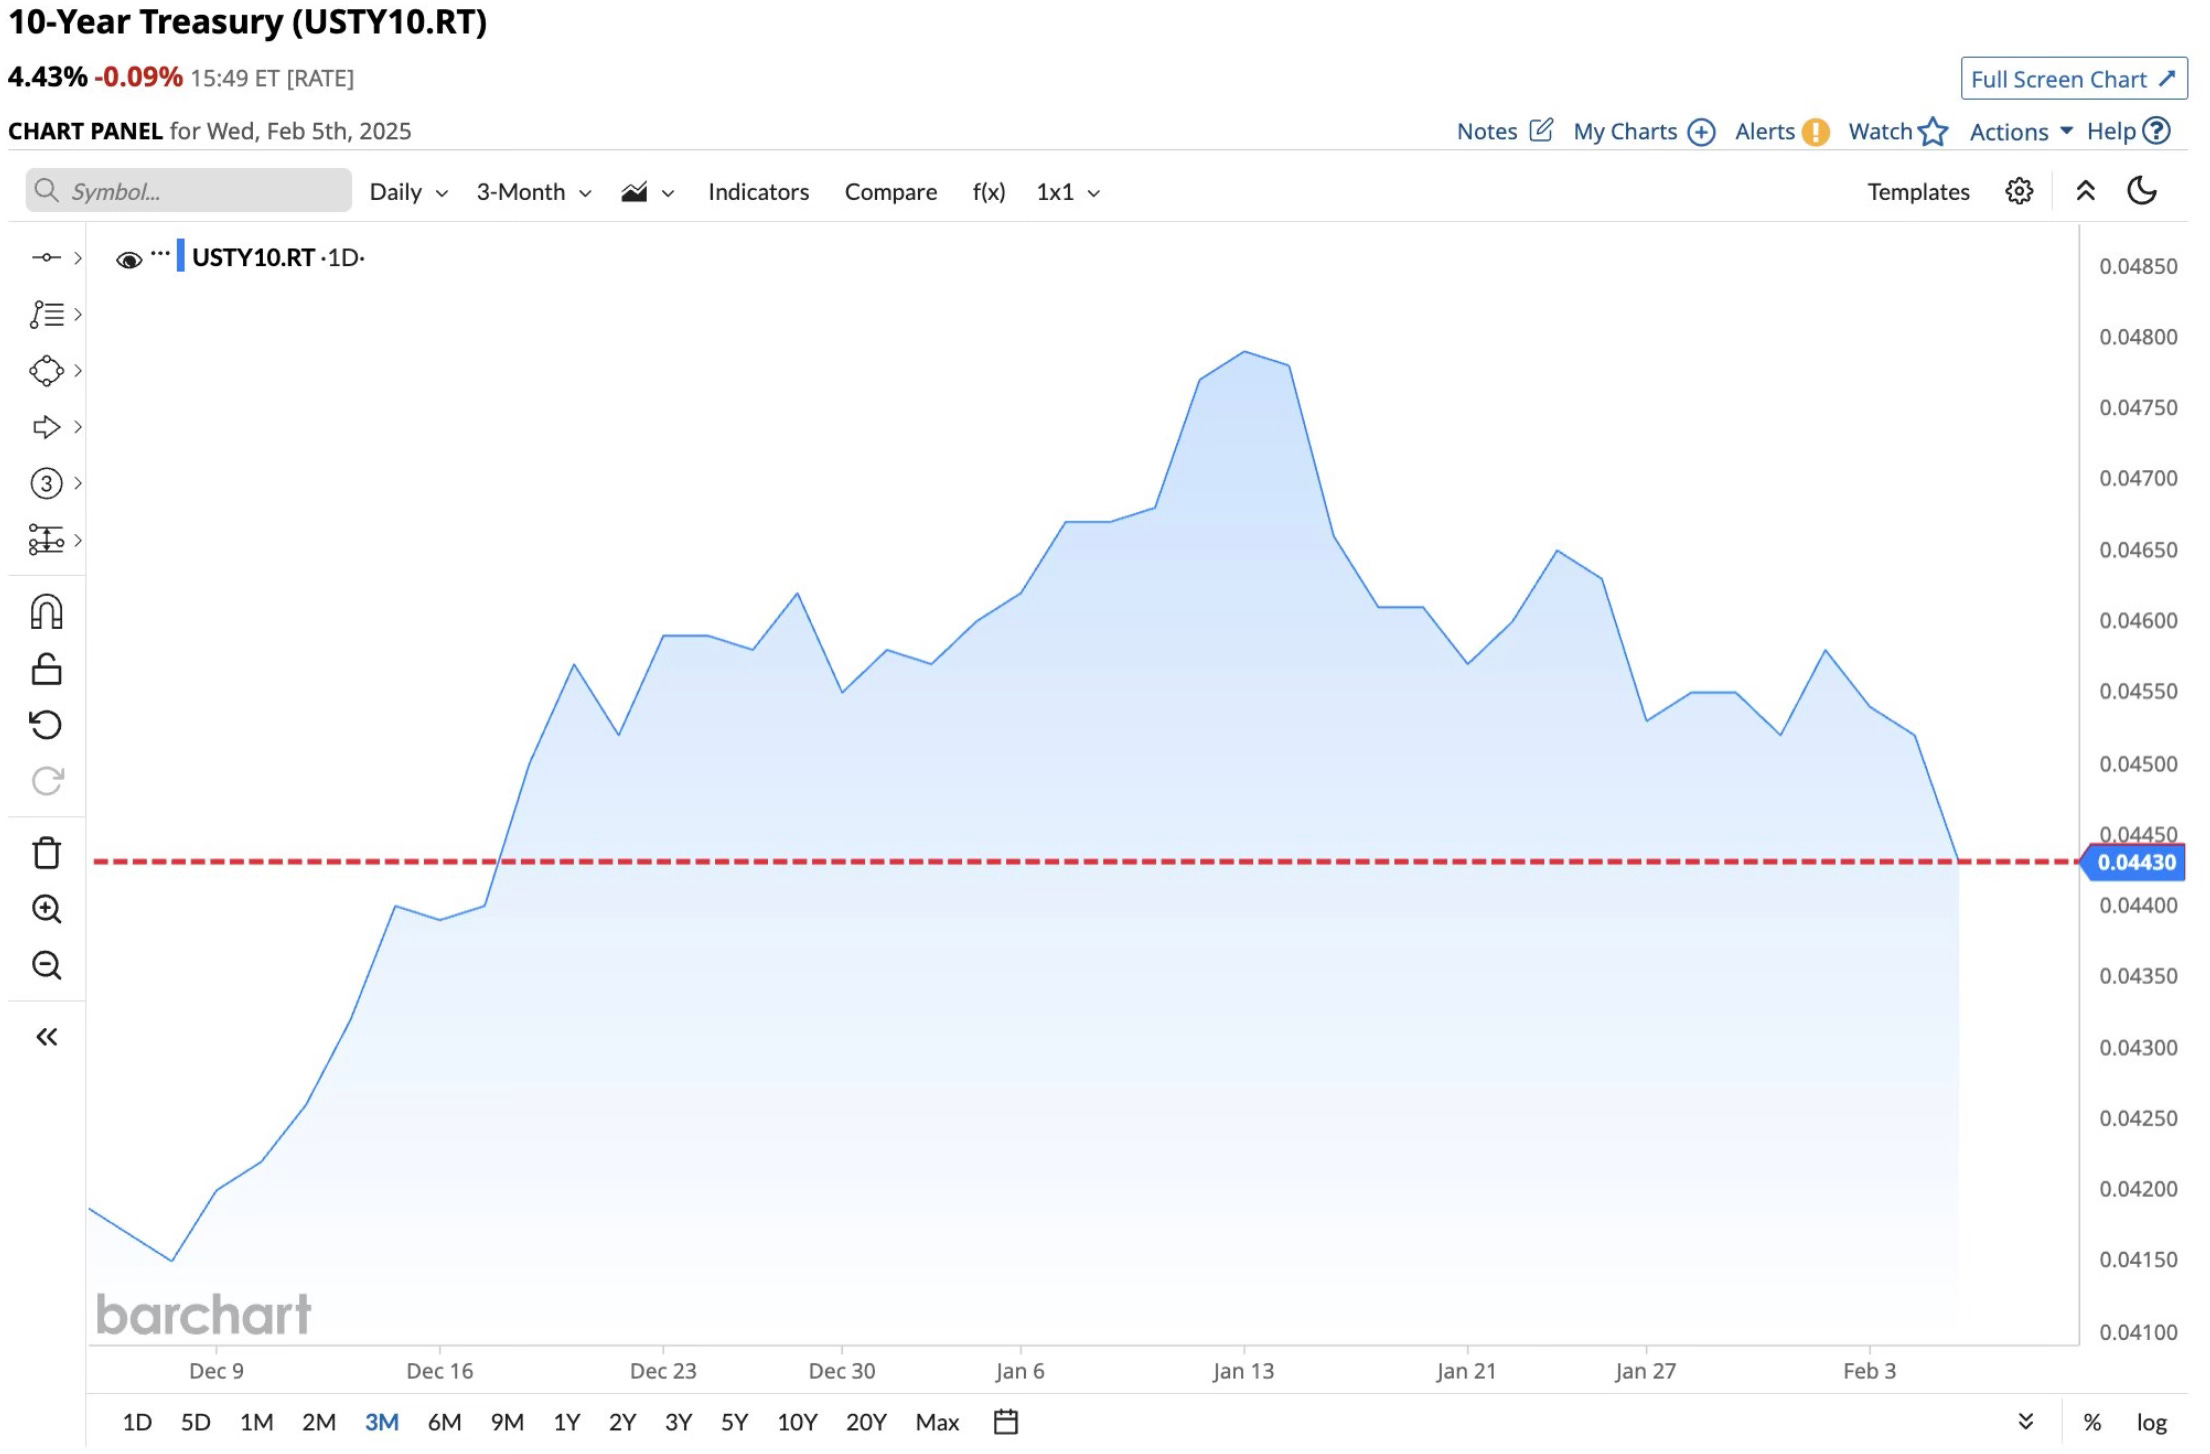
Also helping stocks is that the 10-year continues to trend lower. It now sits at 4.4%. That’s the lowest of 2025.
What Does February Hold?
As the calendar flips to February, the market now enters what’s historically one of the worst performing months of the year.
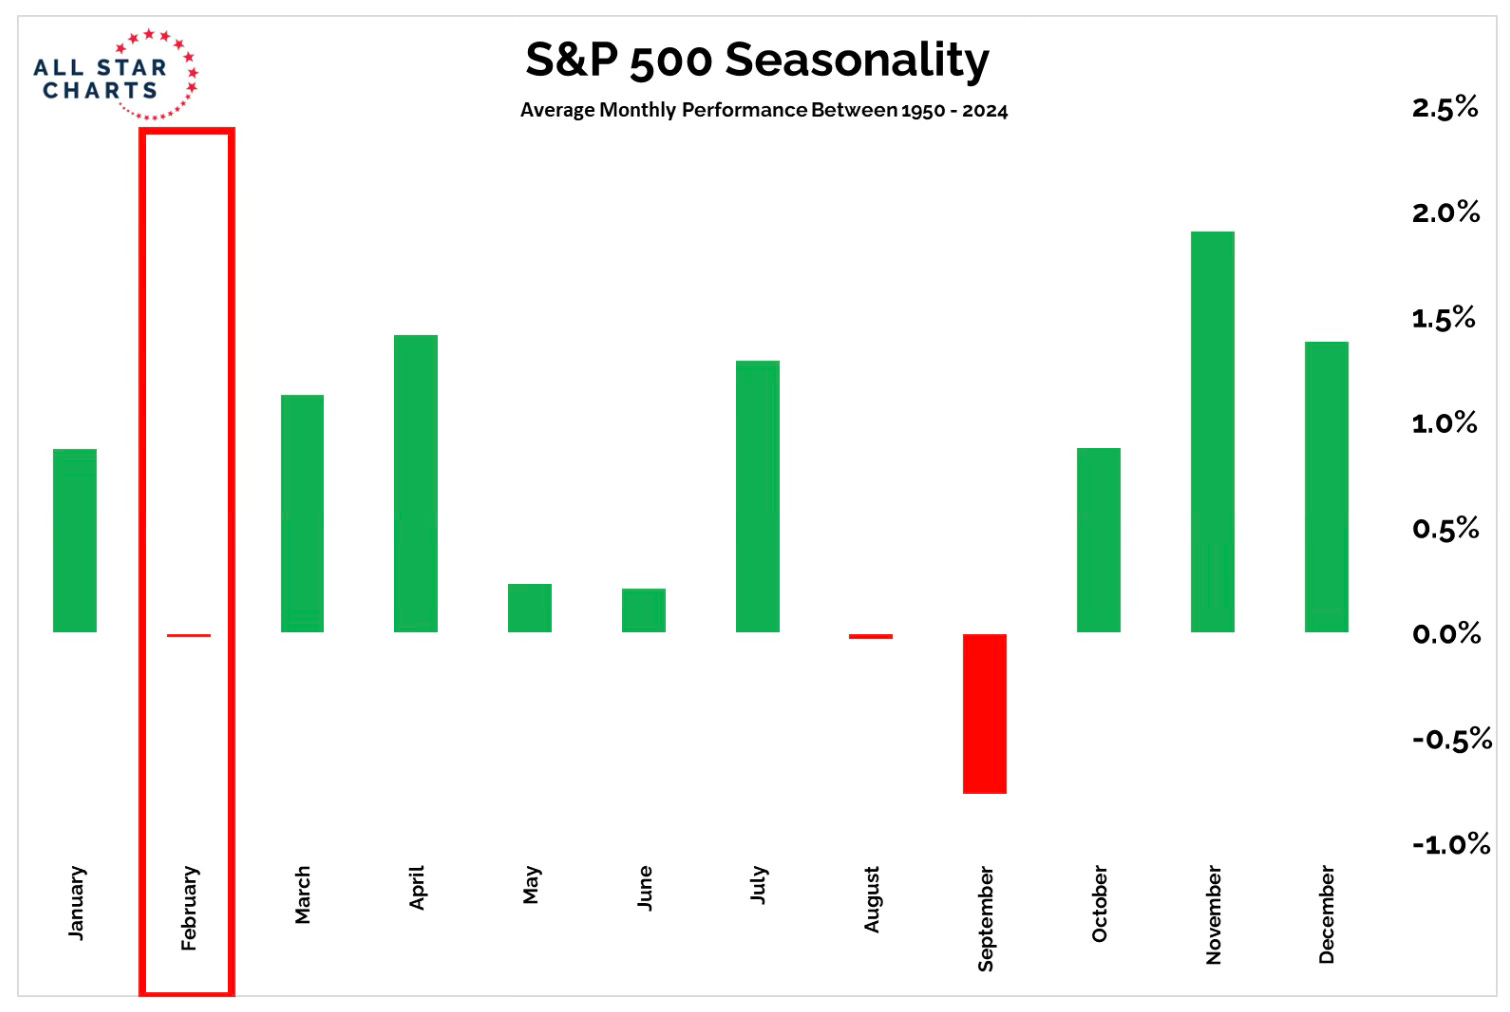
It isn’t so much the early part of February that struggles. It’s in the back half of the month. Valentine’s Day is the happy point of the month and then it’s downhill from there. Love is no longer in the air I guess.
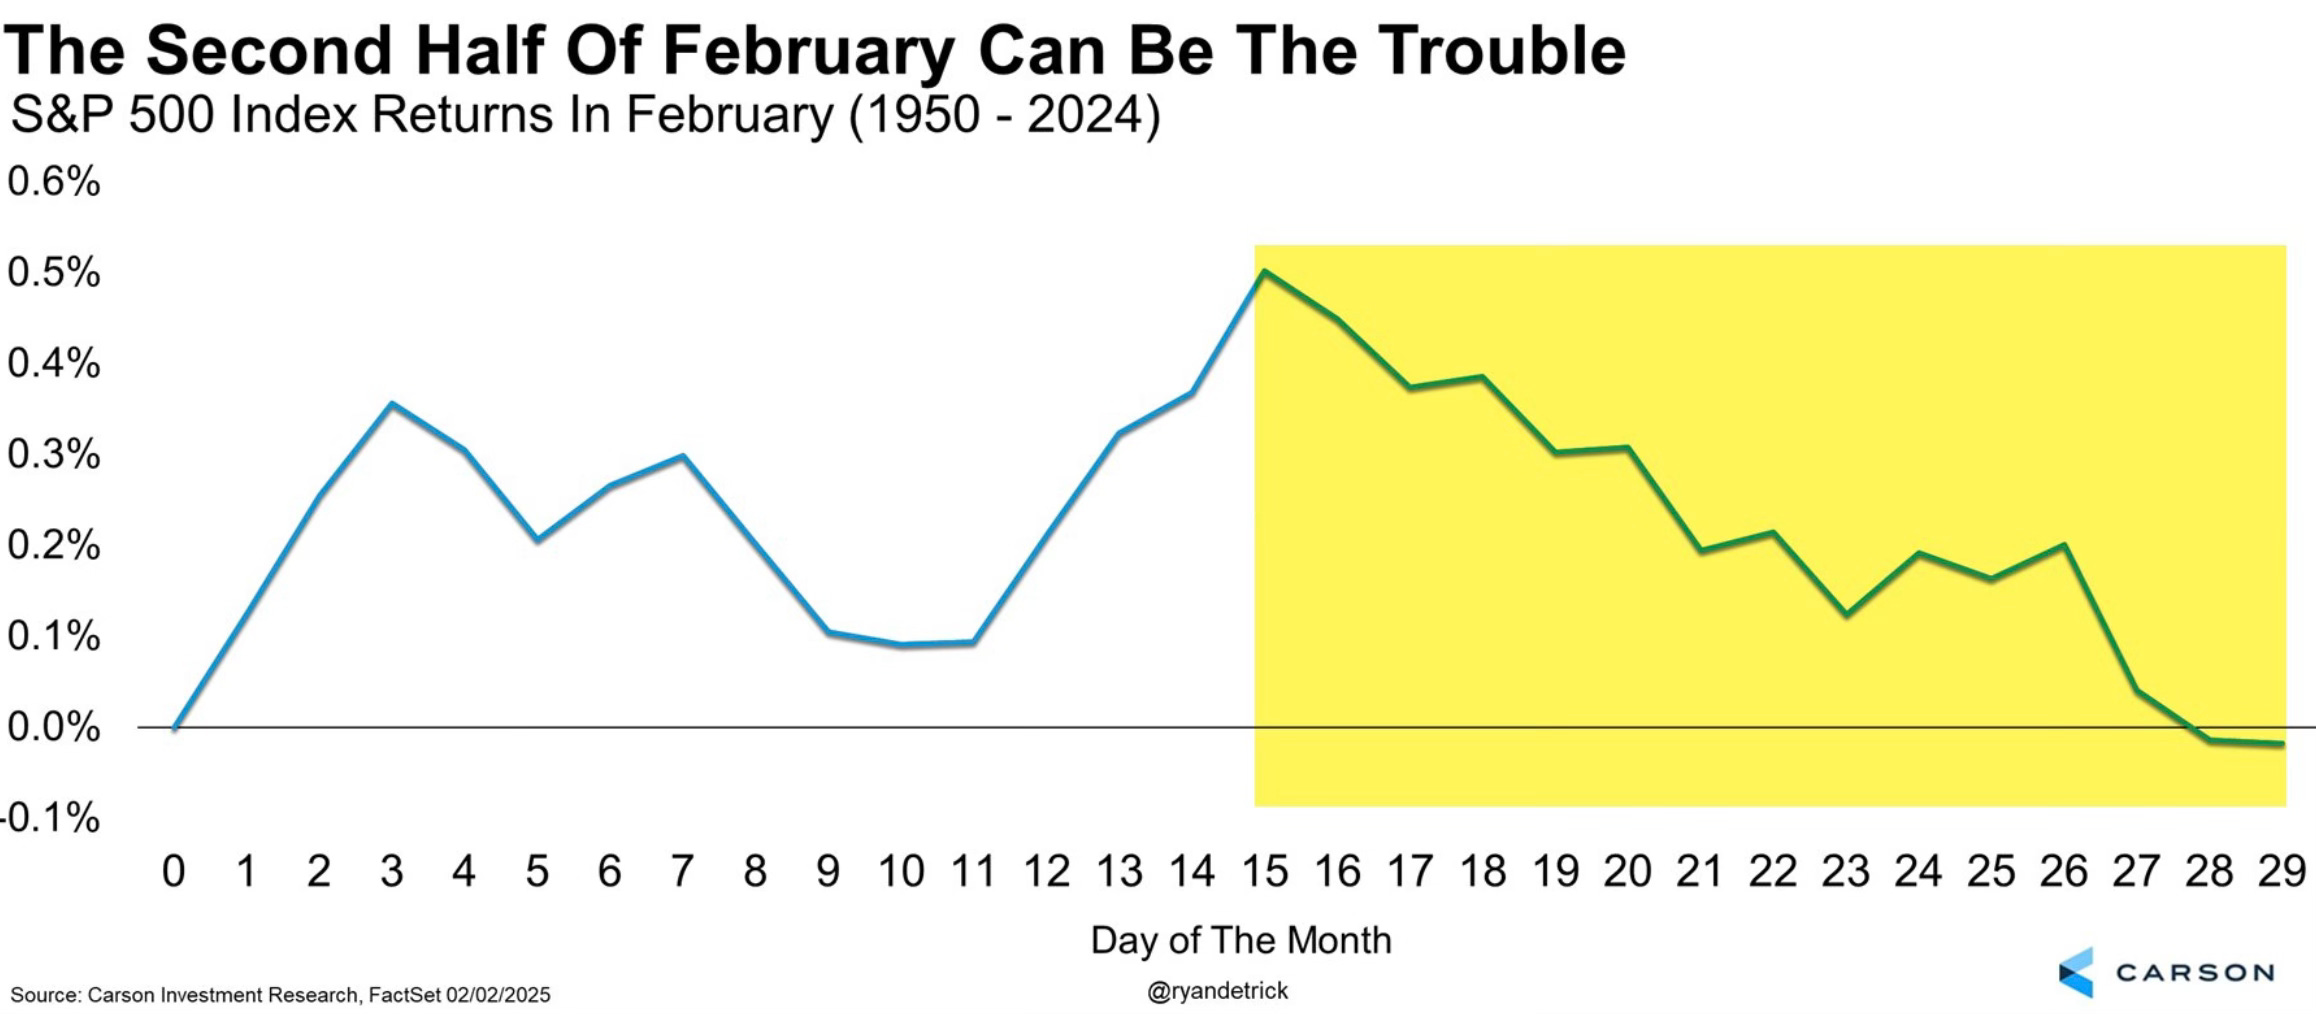
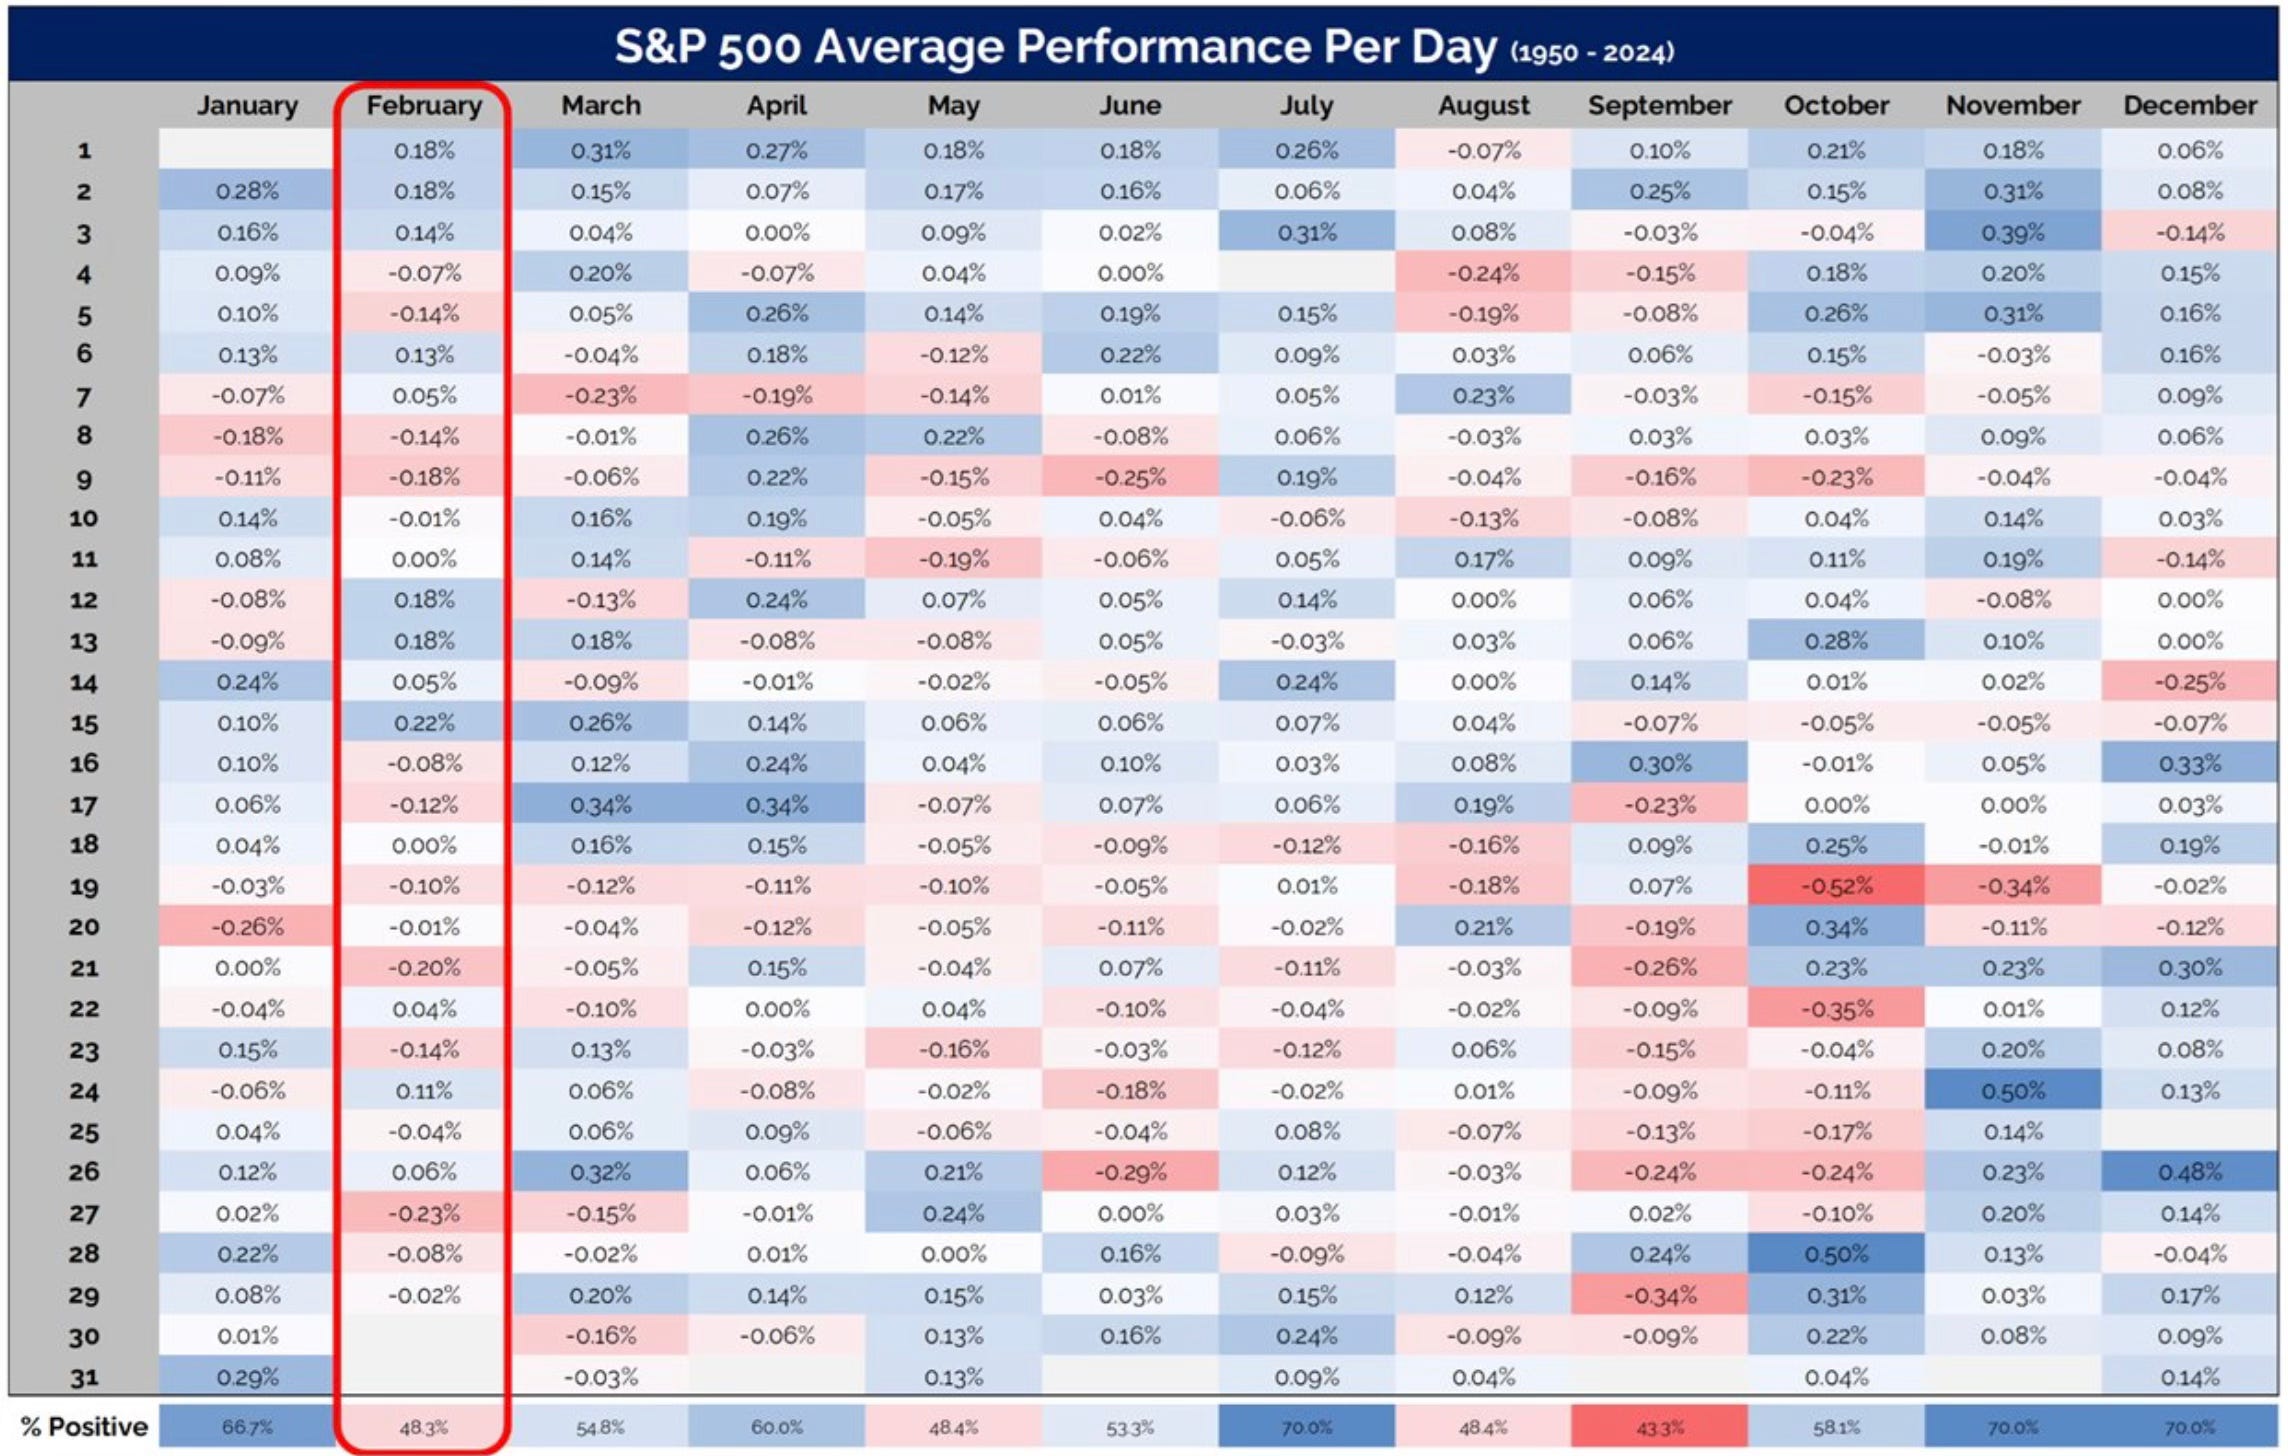
You can see in this per day performance chart how each day after mid-month turns red. It’s actually the second worst performing month of the year. It’s only positive 48.3% of the time going back to 1950 trailing only September.
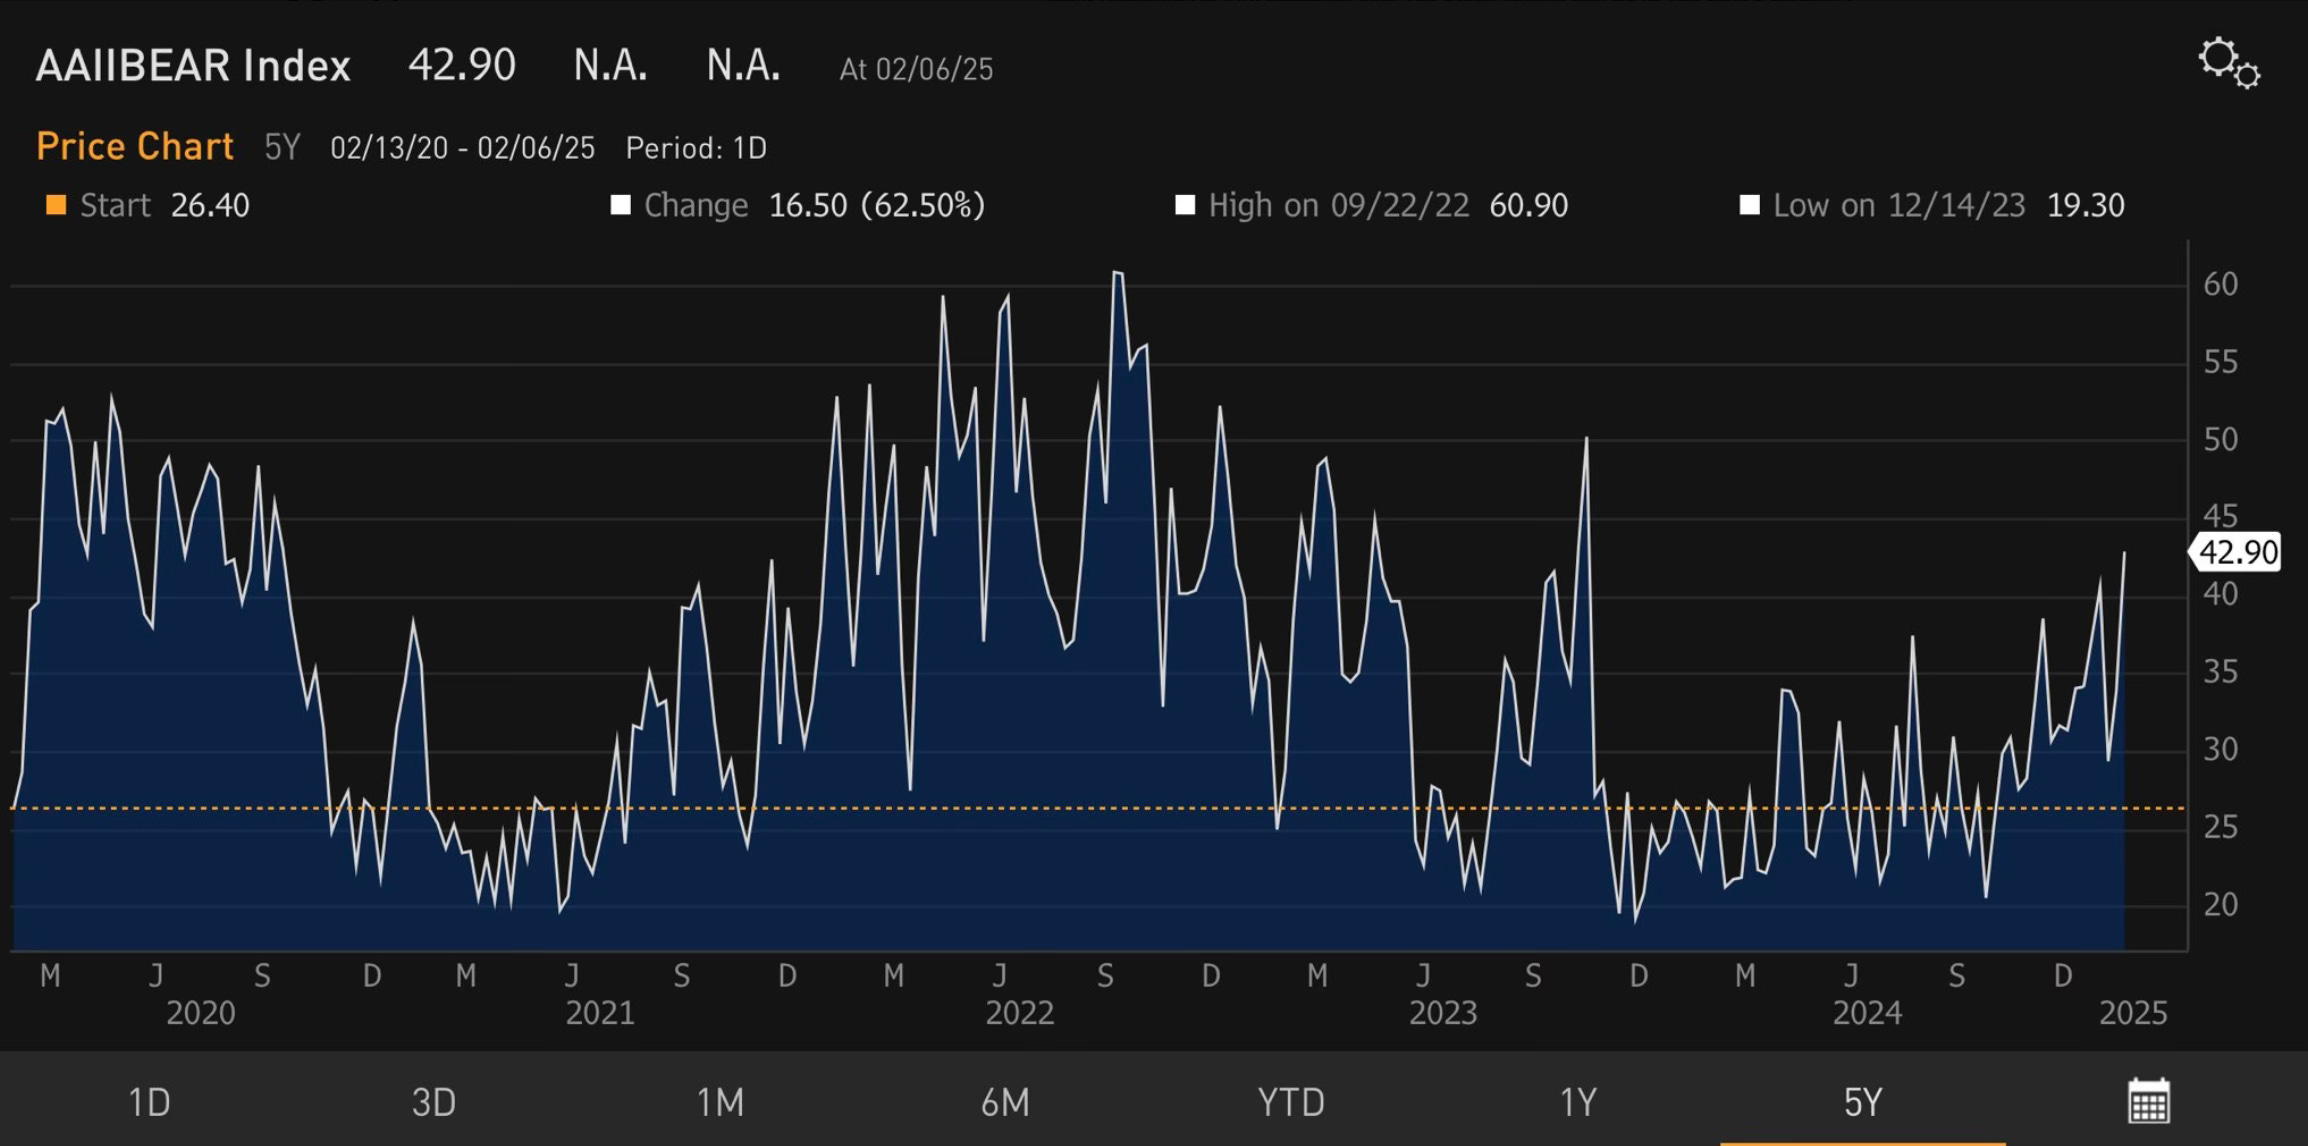
Bears Take Control Again
To my surprise was how much and quickly sentiment switched back so deeply bearish. It was one of the most bearish weeks in a while.
There have now been more weeks where bears have outnumbered the bulls. That’s odd six weeks into the year when it’s still a bull market. That’s definitely not bull market behavior.
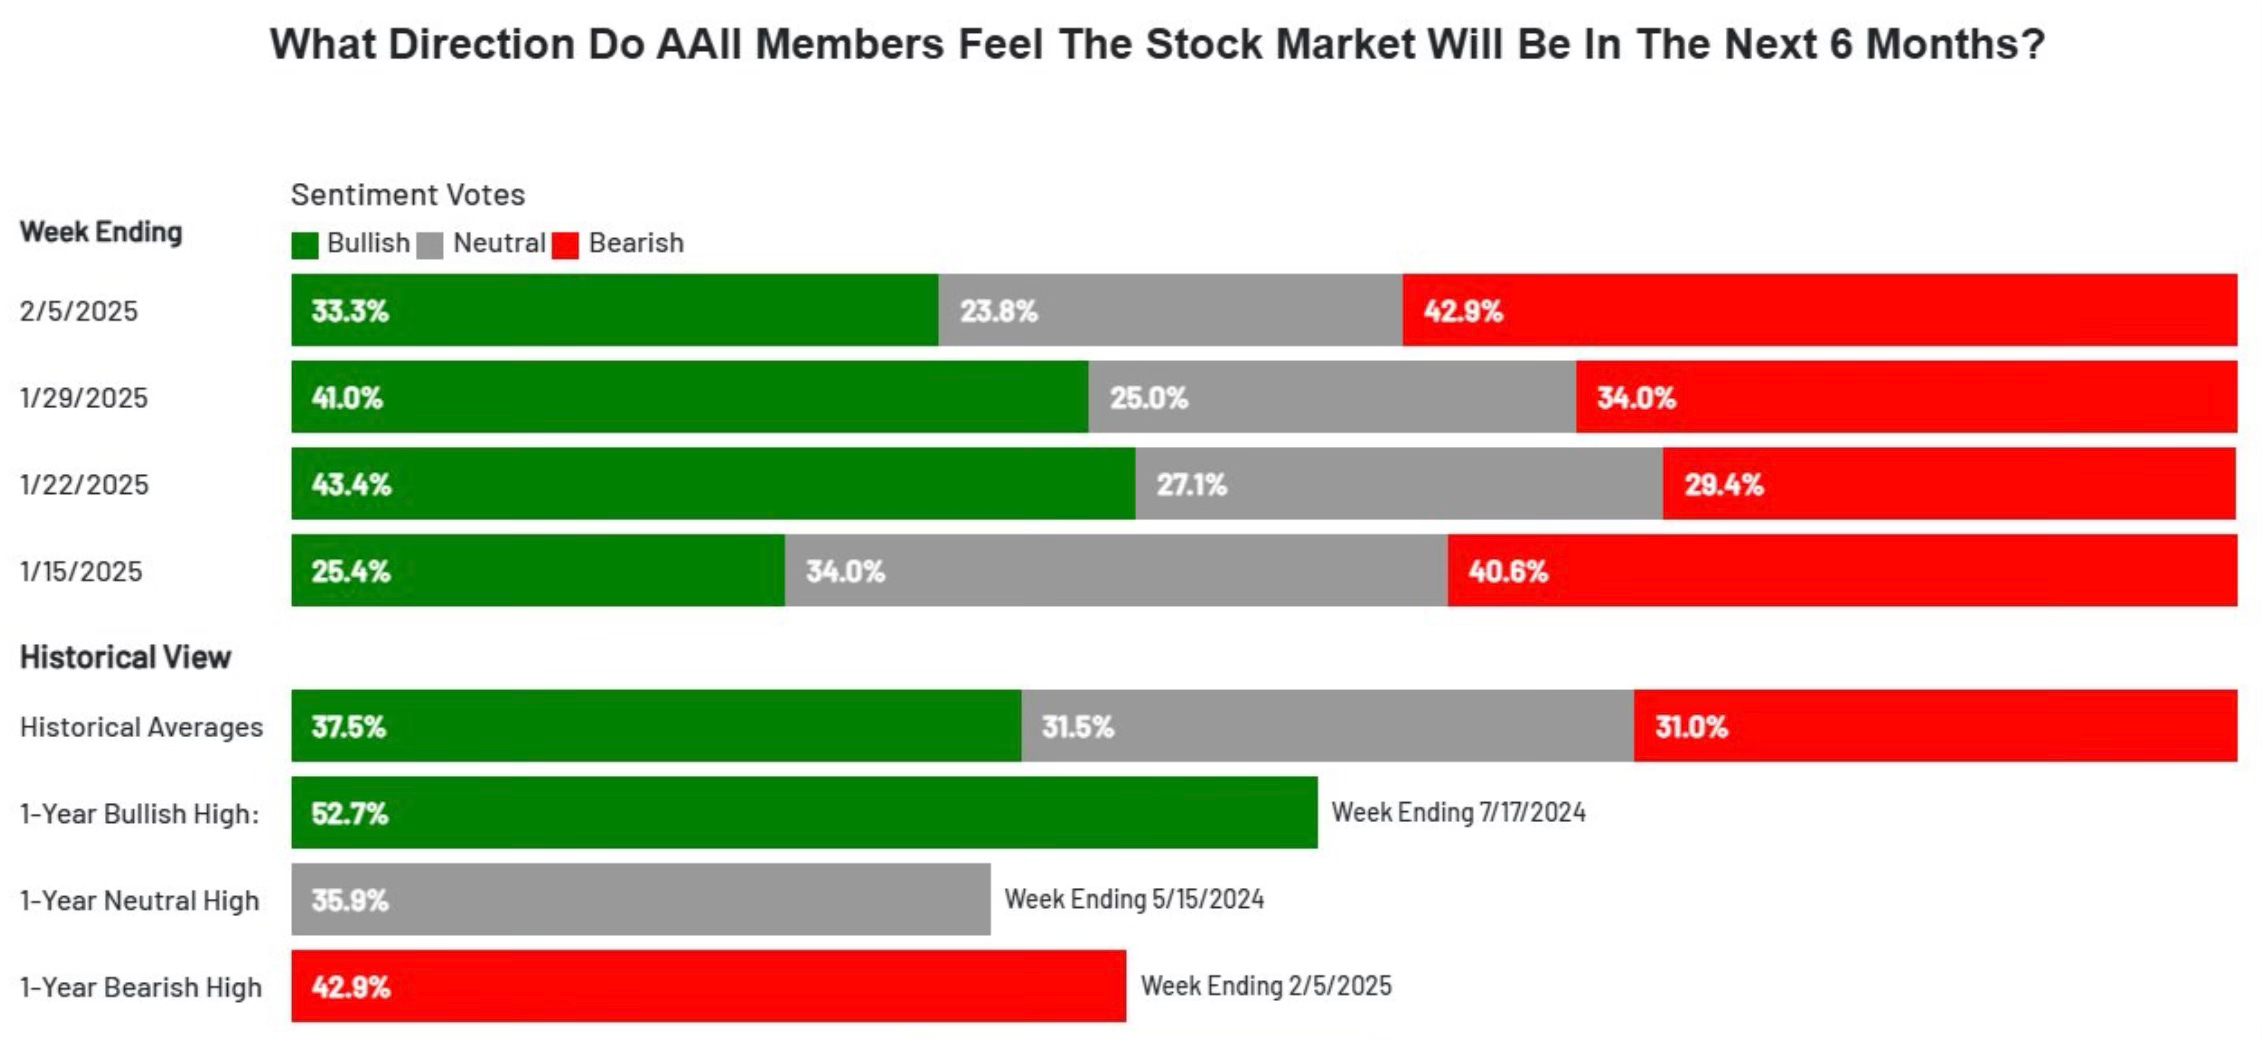
Looking back, this is the most bearish sentiment has been since November 2023. This may be another bullish indicator?