


Investing Update: Buy Signals Arrive?
What I’m buying, selling & watching
What a whipsaw week. Both the S&P 500 and Nasdaq had their biggest percentage gain since November 2023. It was the biggest week for the Nasdaq since November 2022.
But volatility works in both directions. That’s exactly what we’ve seen over the past week.
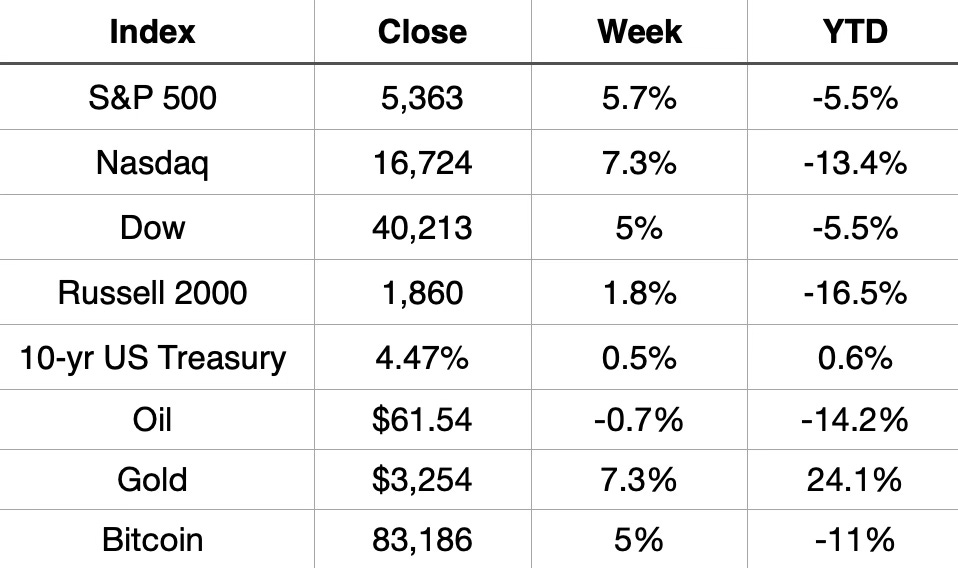
Market Recap
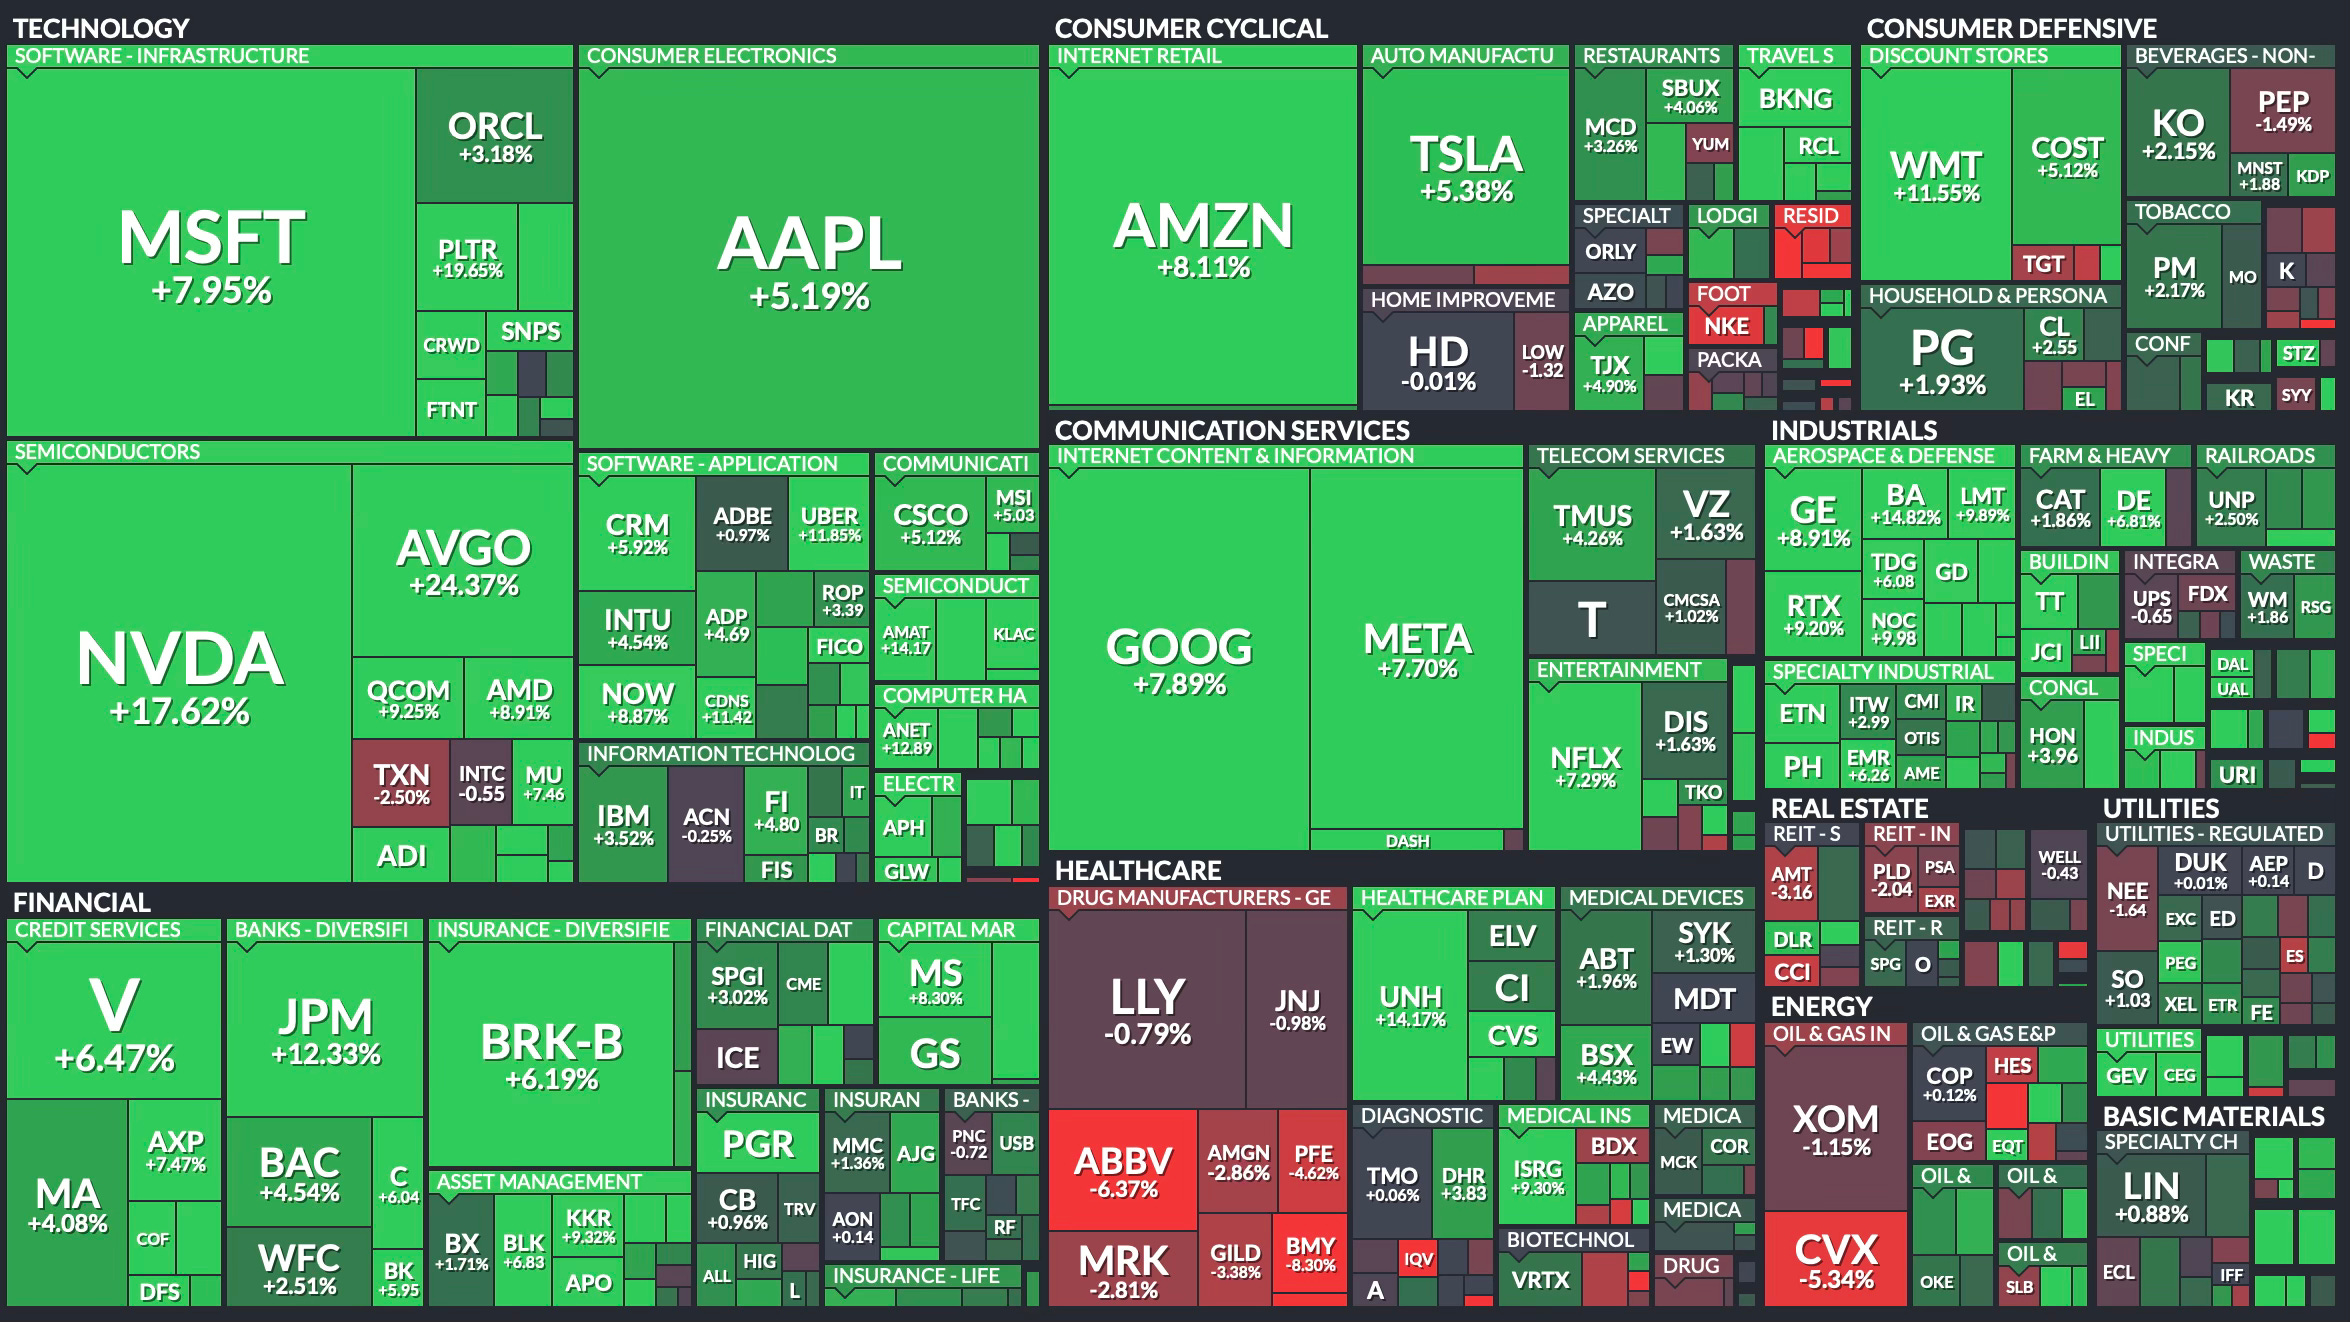
Weekly Heat Map Of Stocks
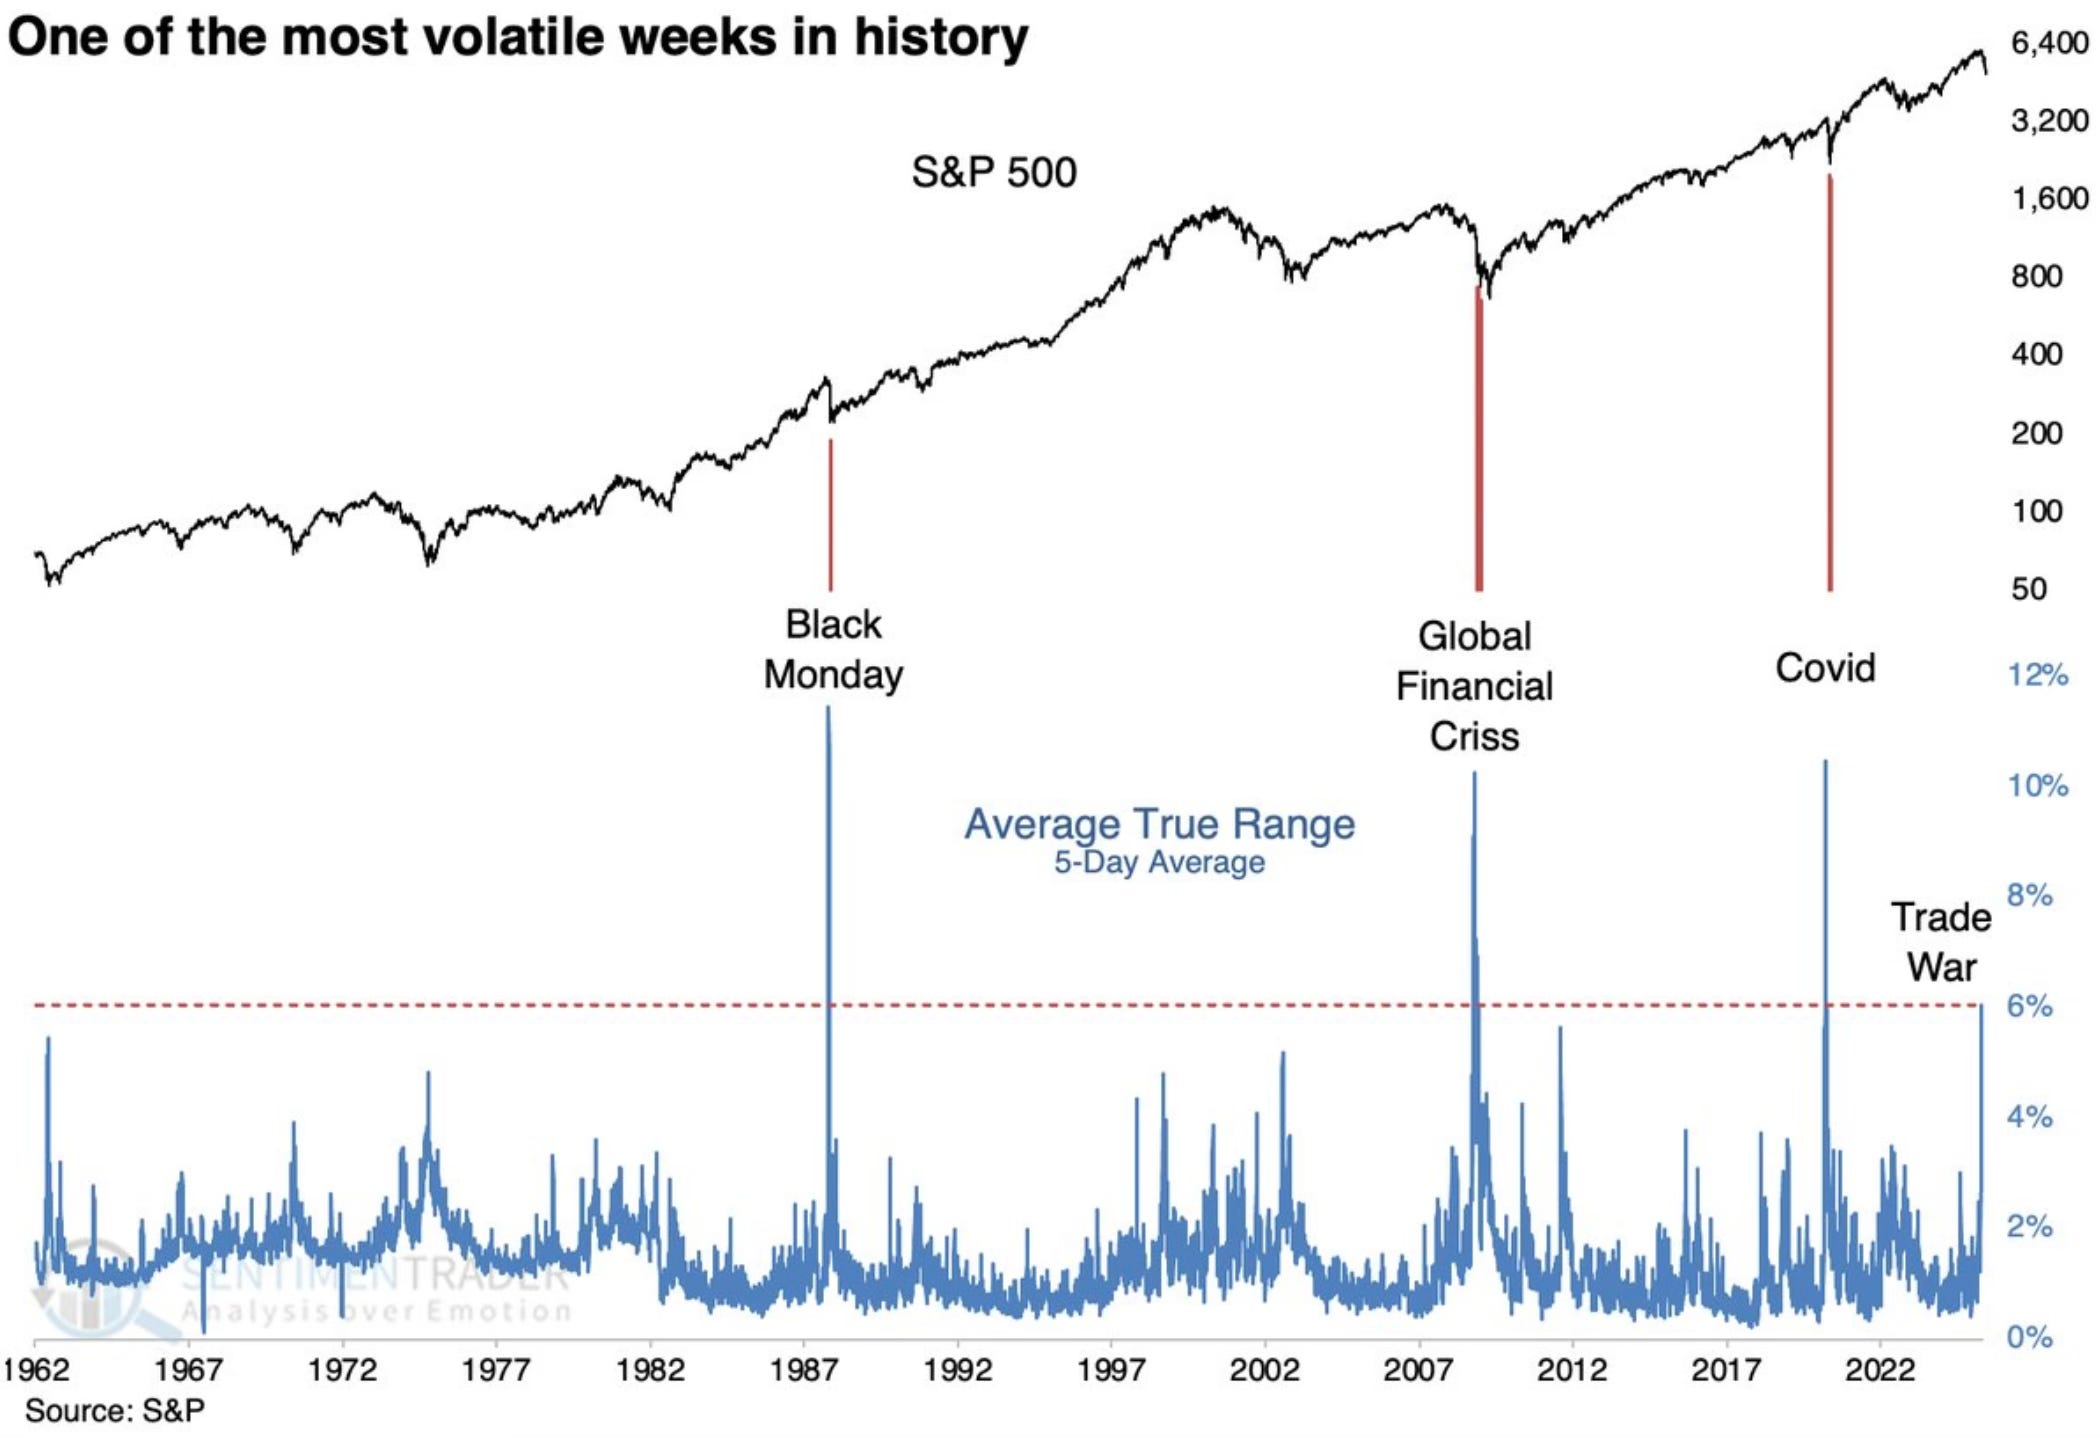
It was actually the 4th most volatile week in the past 60 years.
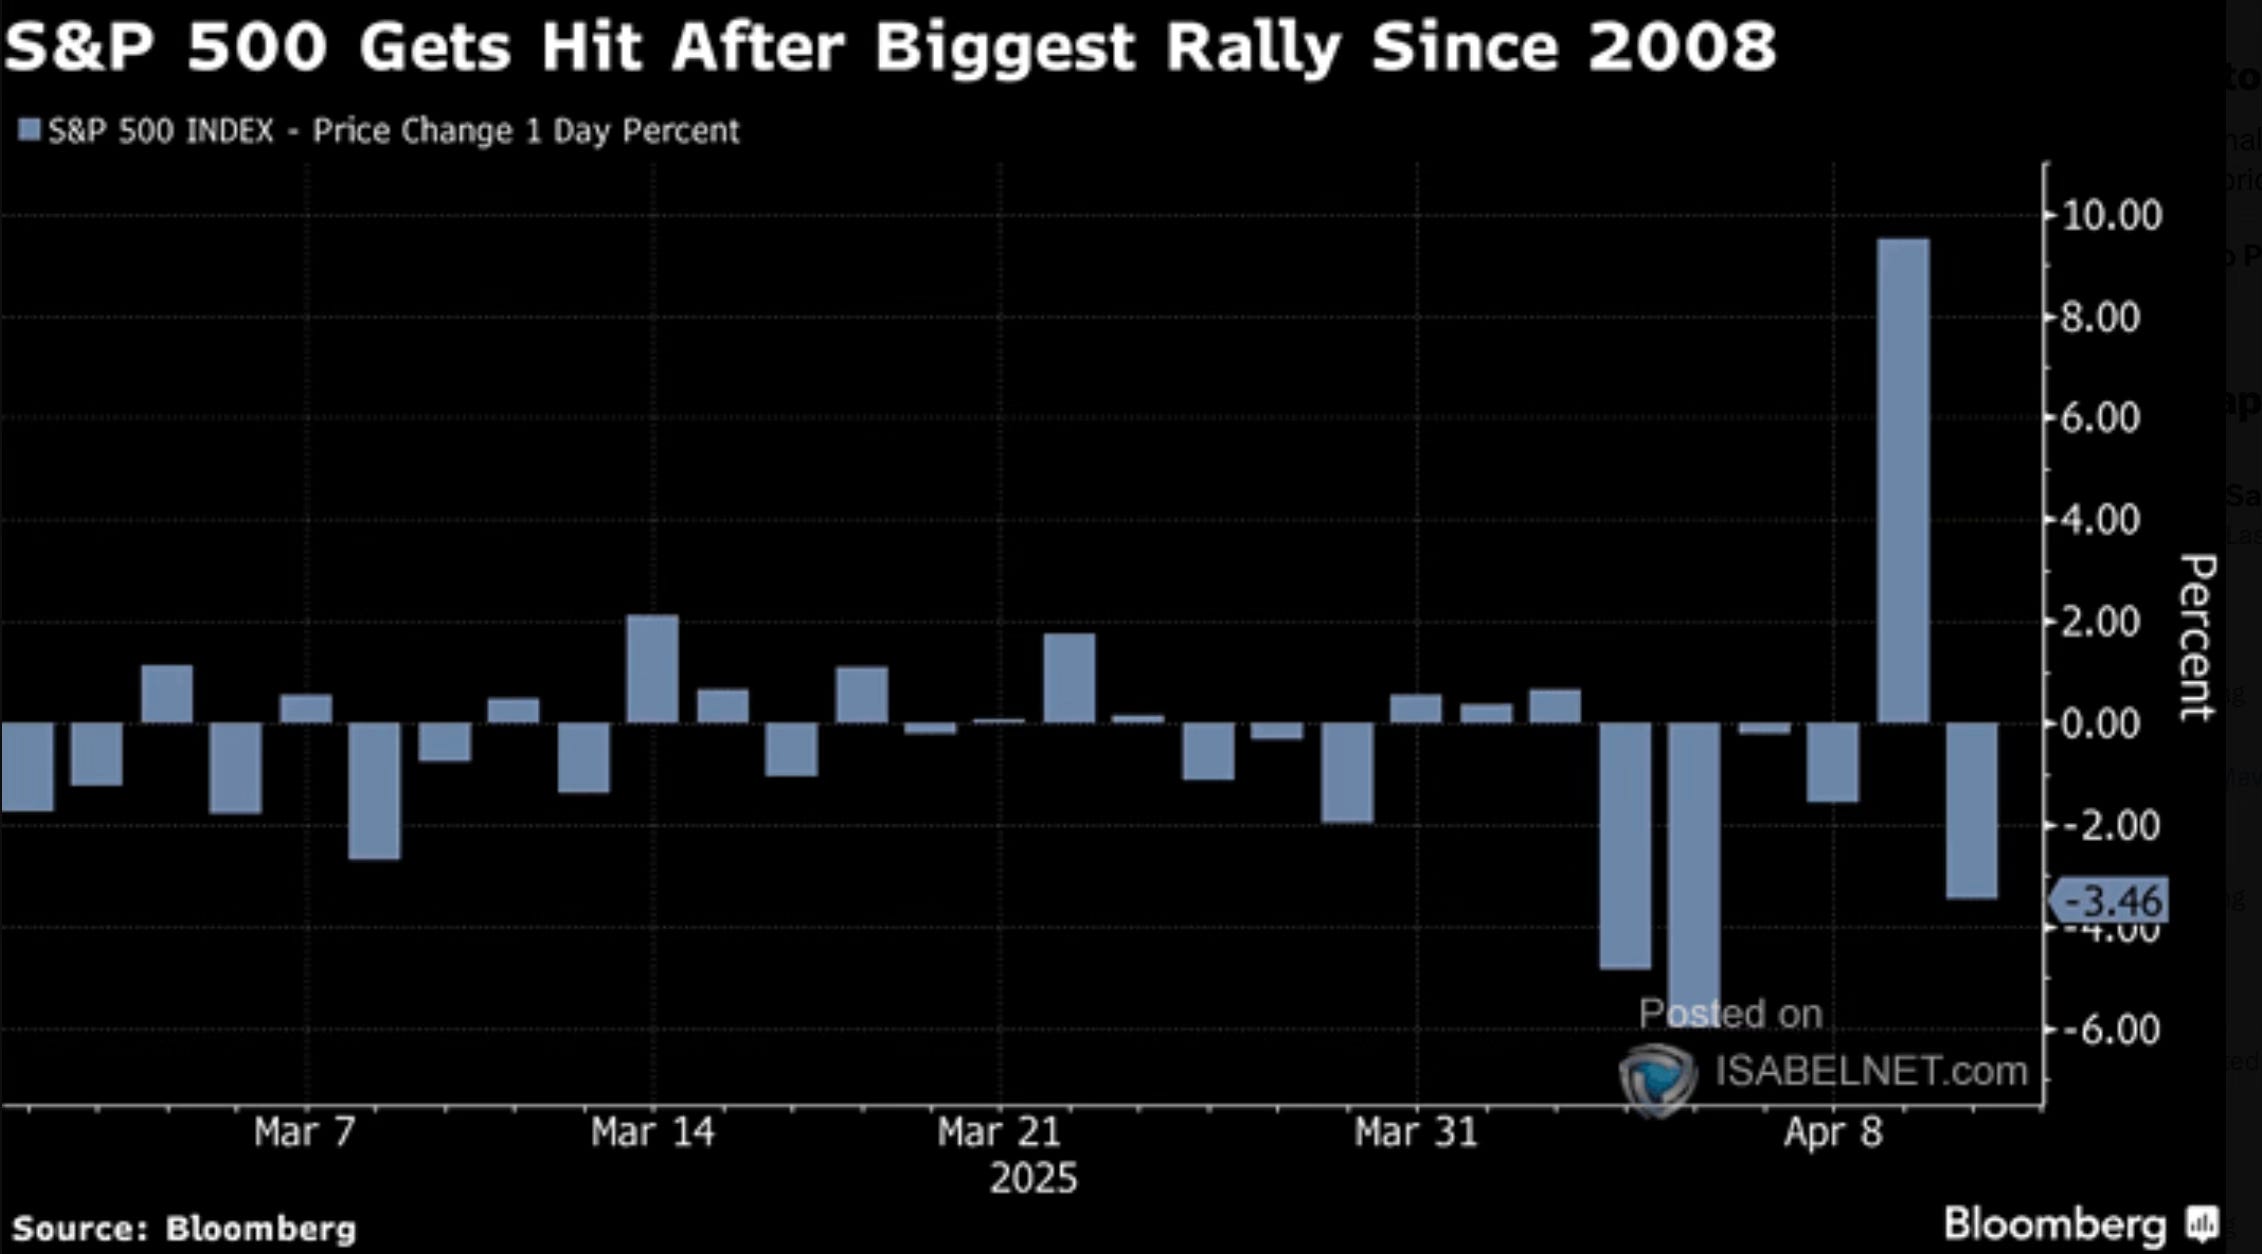
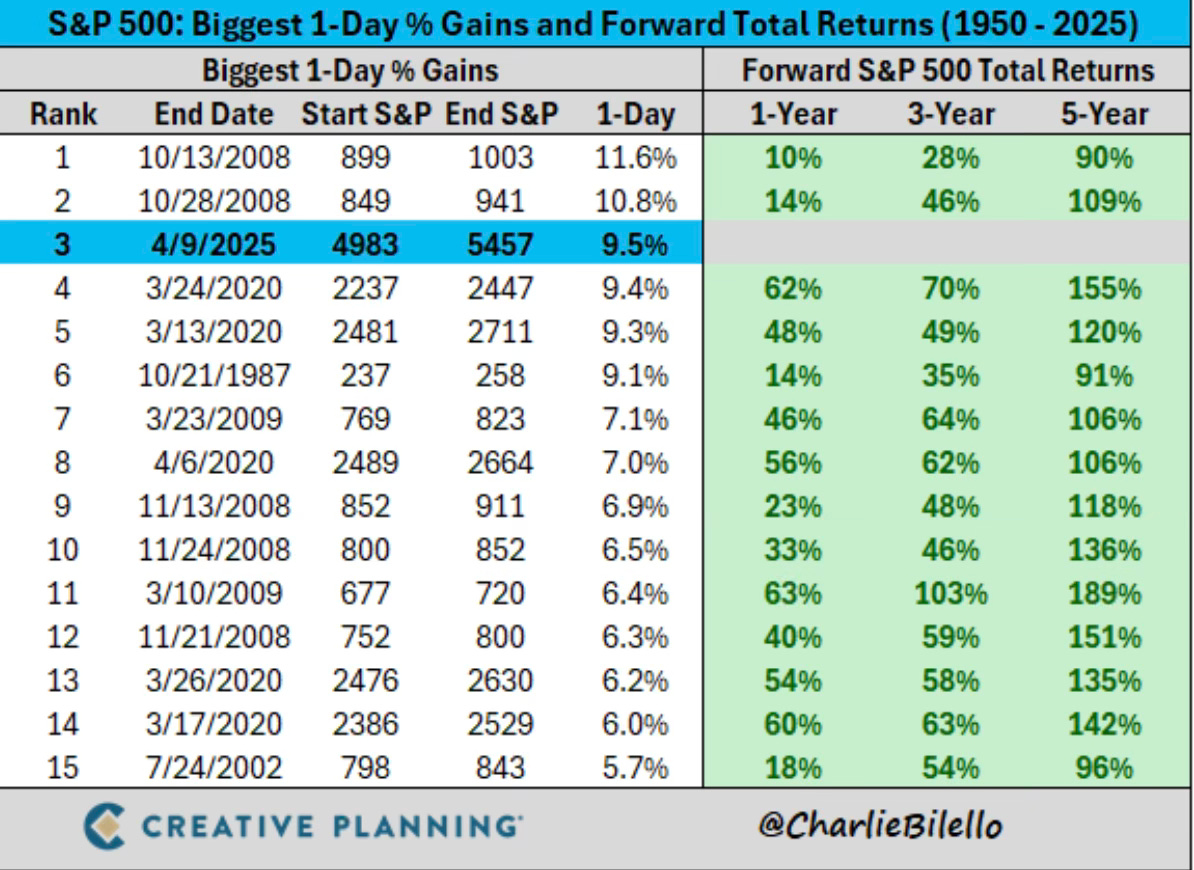
Wednesday was the best day for the S&P 500 since 2008. It was up 9.5%. The Nasdaq was up 12%, the best day since 2001. That’s good for the 3rd best day since 1950.
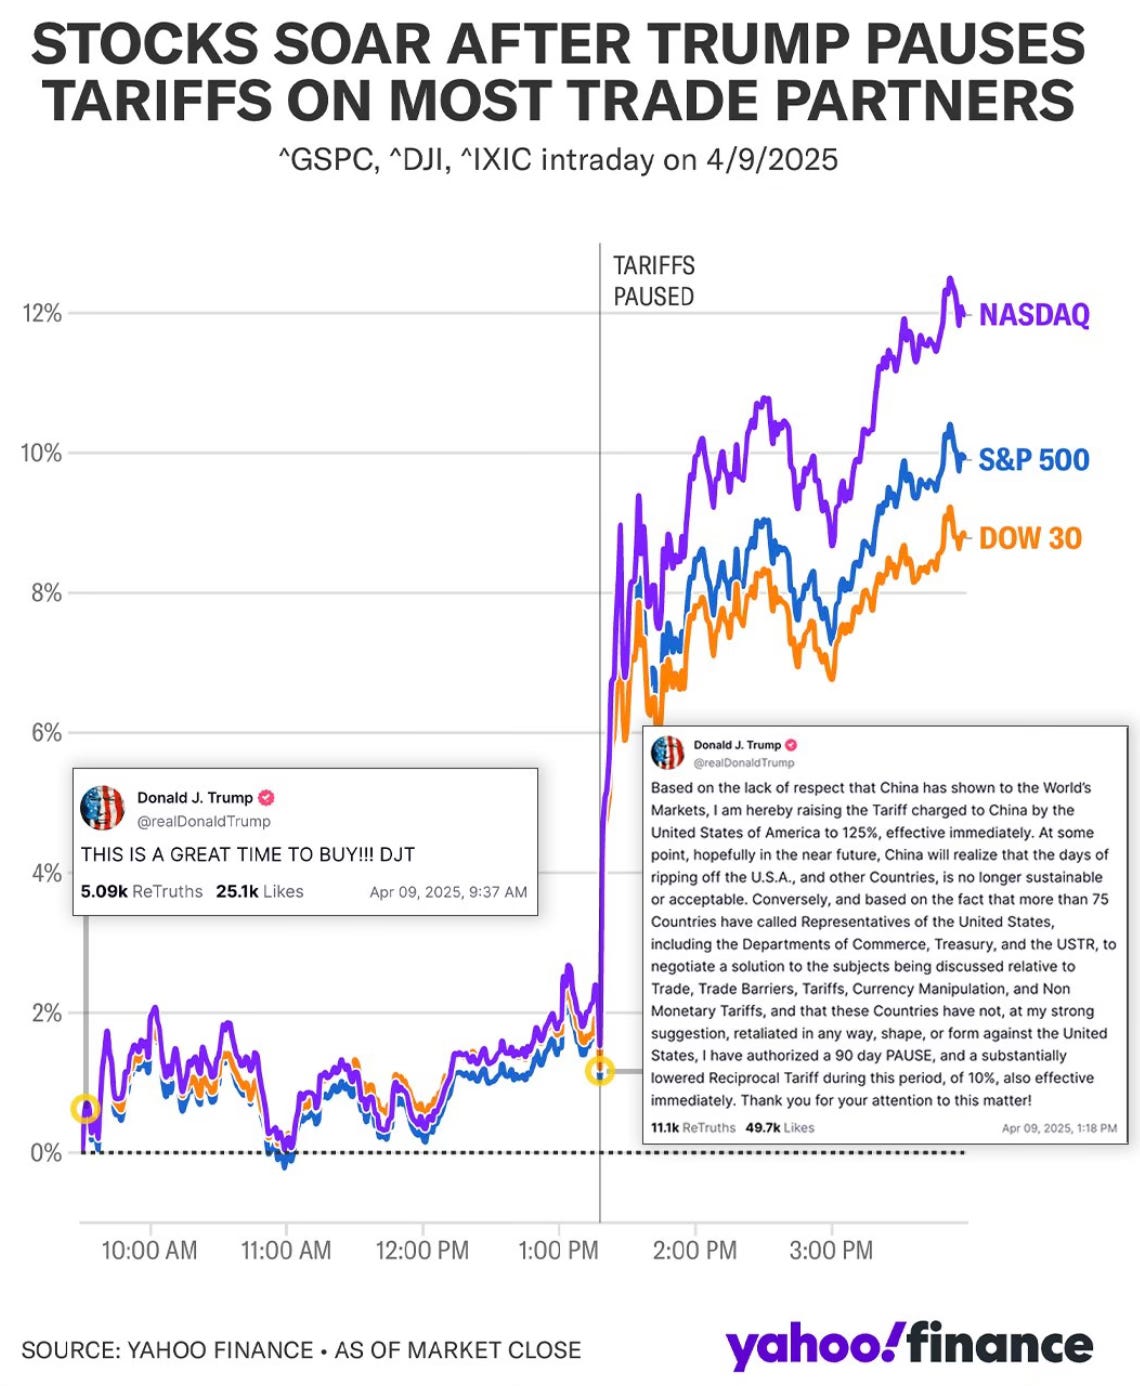
Stocks took off after the Trump administration announced a 90-day pause on tariffs. You can see what happened once that was announced.
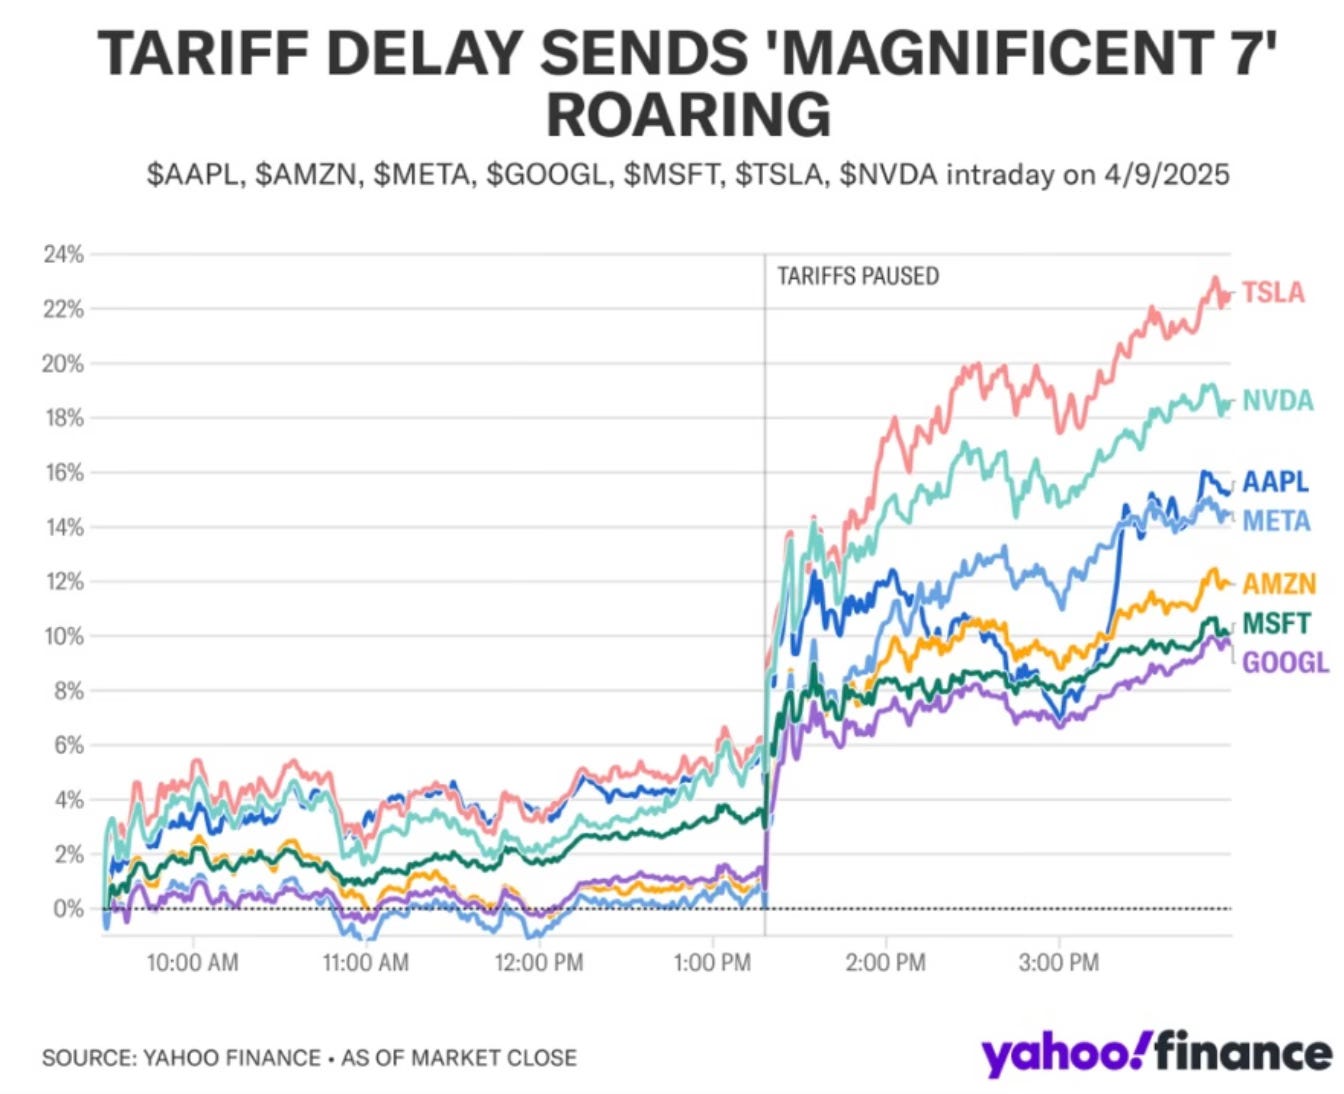
The Mag 7 stocks saw a giant bounce. If you’re playing for a market rebound back to all-time highs, the Mag 7 stocks will likely be the big winners and lead the market back to green territory.
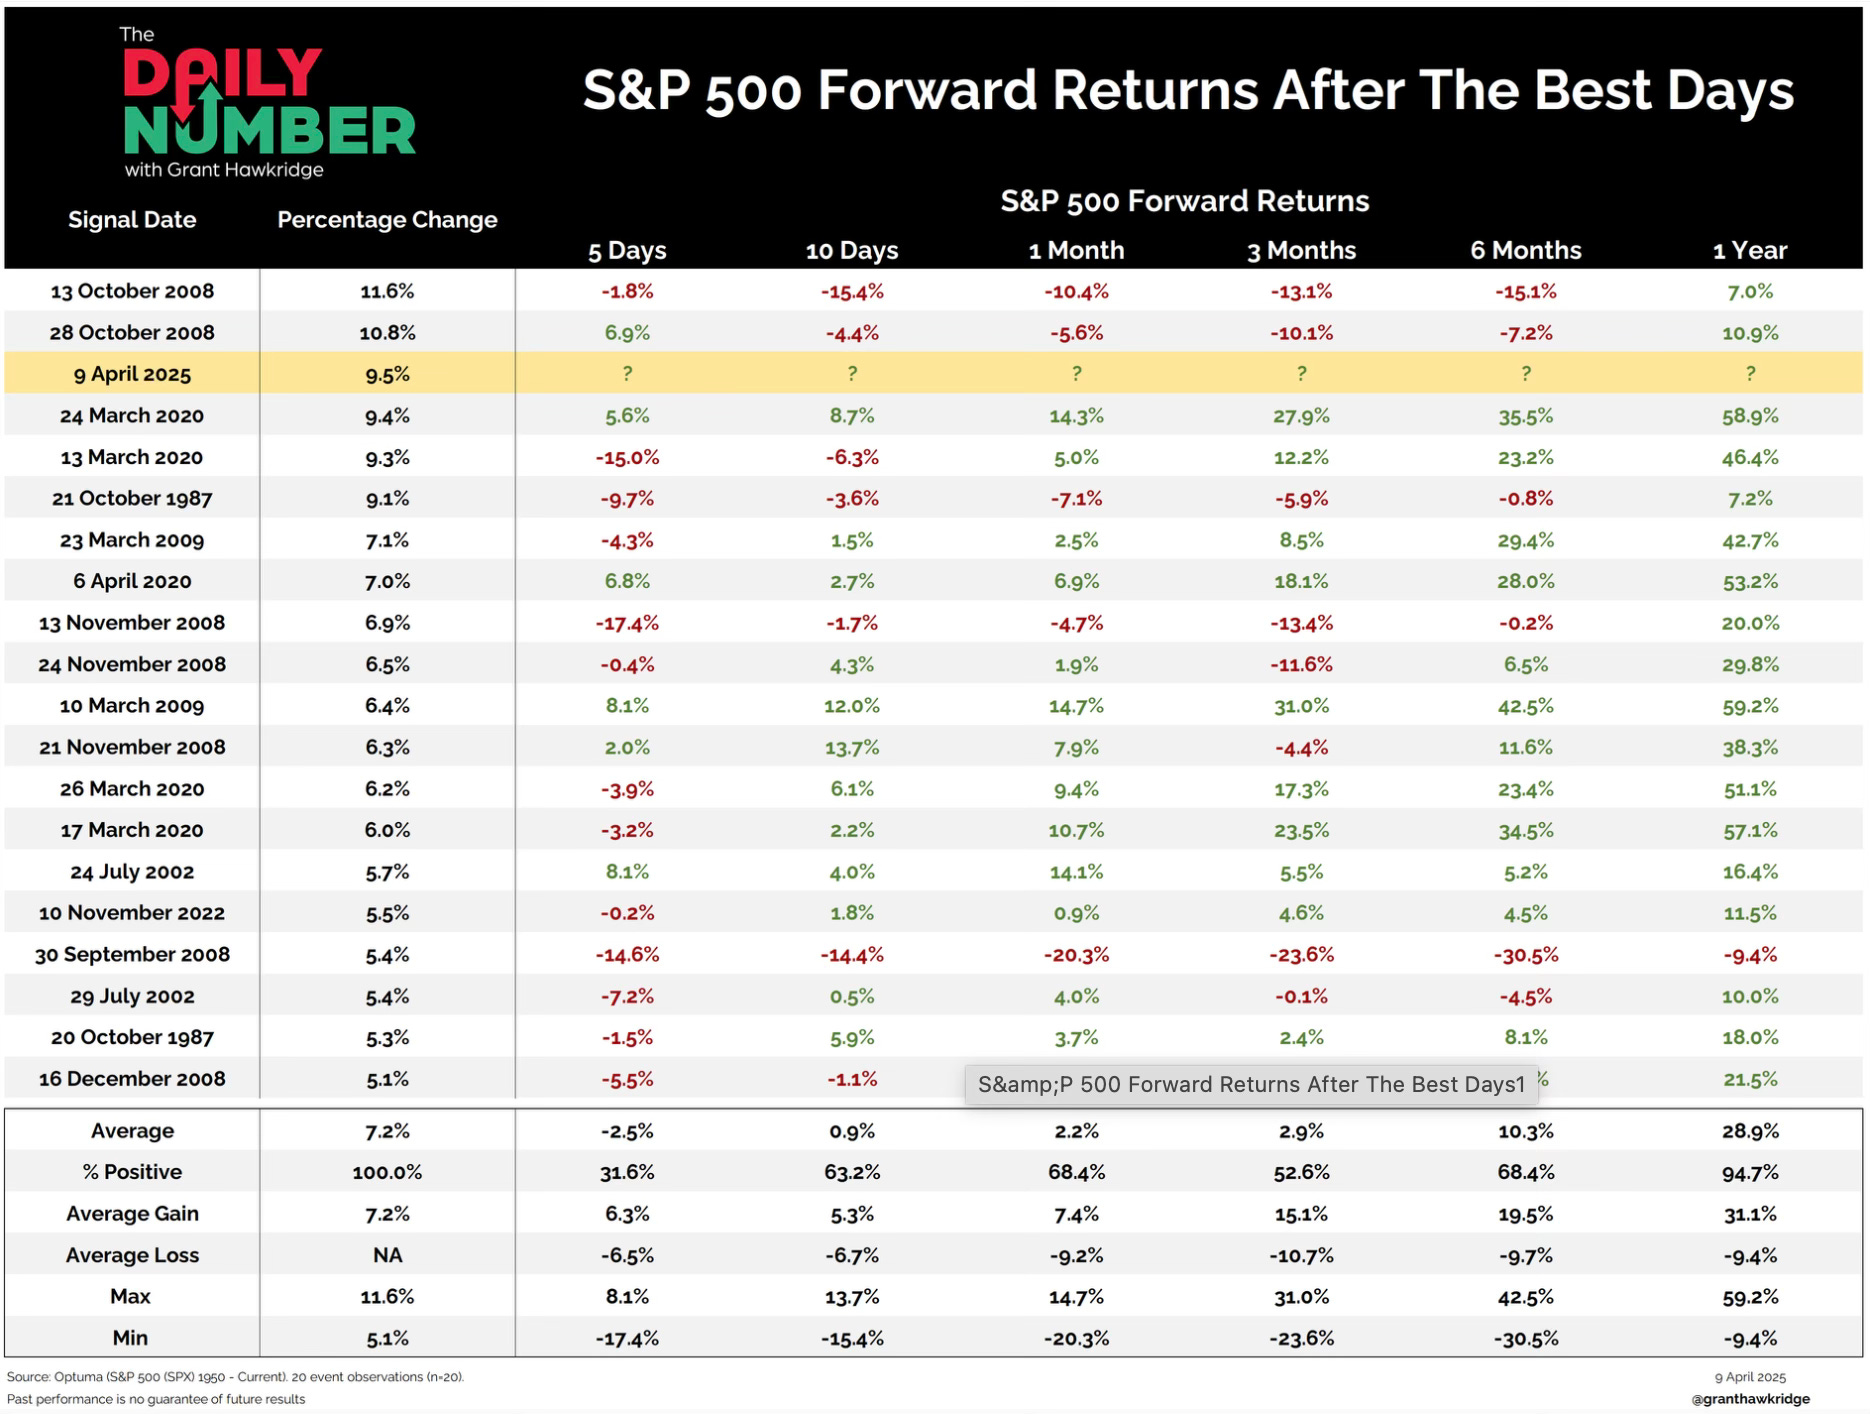
This was an interesting chart from Grant Hawkridge. He shows how the S&P 500 has performed after the best days in history. You can see that following these best days in history, the S&P 500 is up 68% of the time 1 month later and 6 months later. 94% of the time it’s higher 1 year later.
After two roller coater weeks, what does next week hold? I’m going to bet it’s more of the same. There is no reason to believe that the volatility is going to die down at all. With earnings underway it will be very interesting to see what companies say.
I’m going to be watching to see if any companies pull forward guidance. This week already saw Delta, Frontier and Logitech pull their earnings forecasts on tariff uncertainty.