


Investing Update: Data That's Sticking Out
What I'm buying, selling & watching
A hotter than expected inflation report on Tuesday, kicked the week off on a down note for the stock market.
Instead of heading lower, inflation has flattened and ticked up in March. Shelter being the biggest culprit.
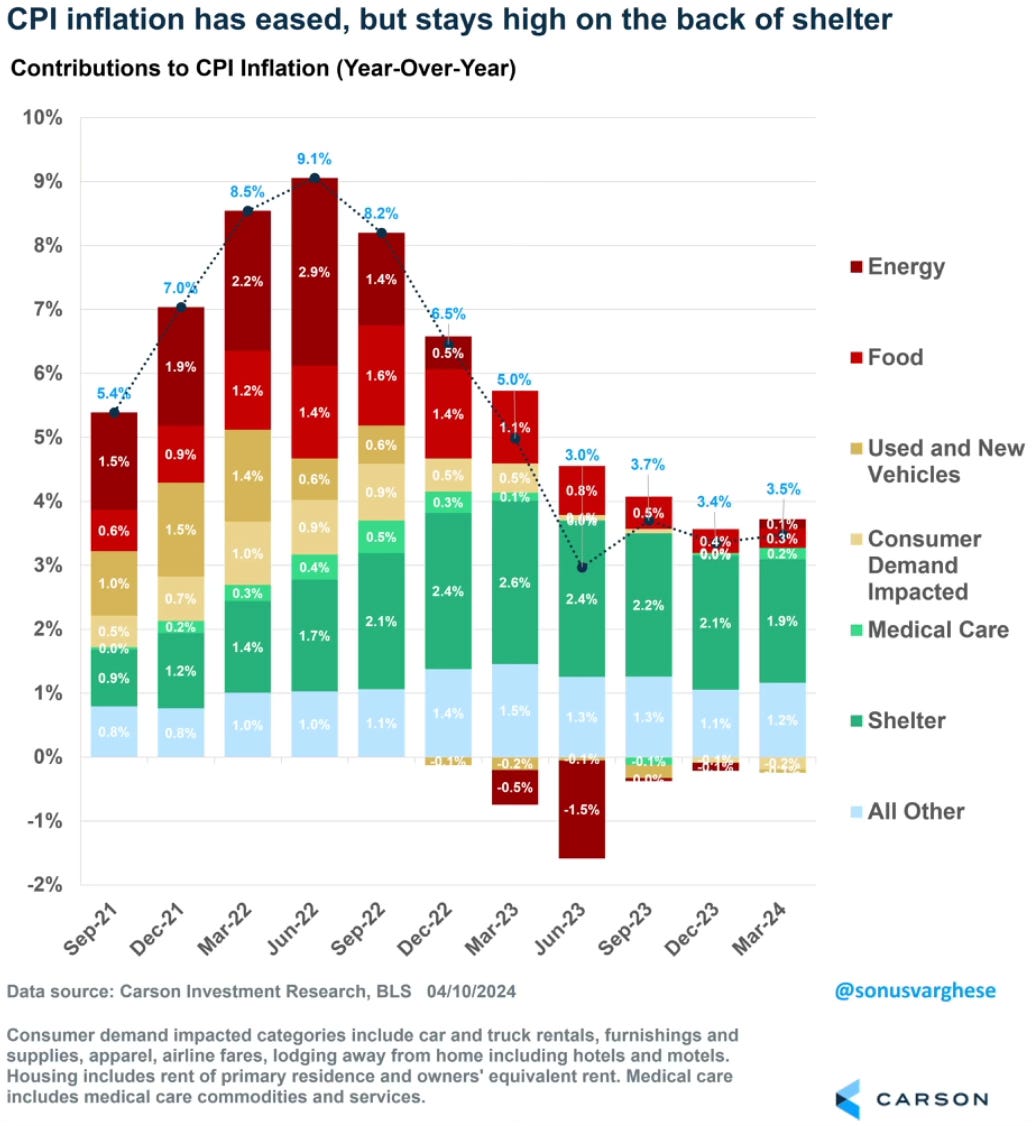
If we zoom out going back to January of 2020 you can see the inflation path. I think the question now on a lot of minds is what to expect in the upcoming months. Do we see a flattening, a push lower or a turn higher?

So where is inflation and where isn’t it? We can see that the continued outlier is auto insurance. It has not budged. The next highest are rent and housing. With a seasonally strong period coming up for housing, I wonder where that number goes.

This is a good chart that shows just how quickly car insurance has risen. The average annual cost for full coverage car insurance went from $1,633 to $2,160 in less than two years.

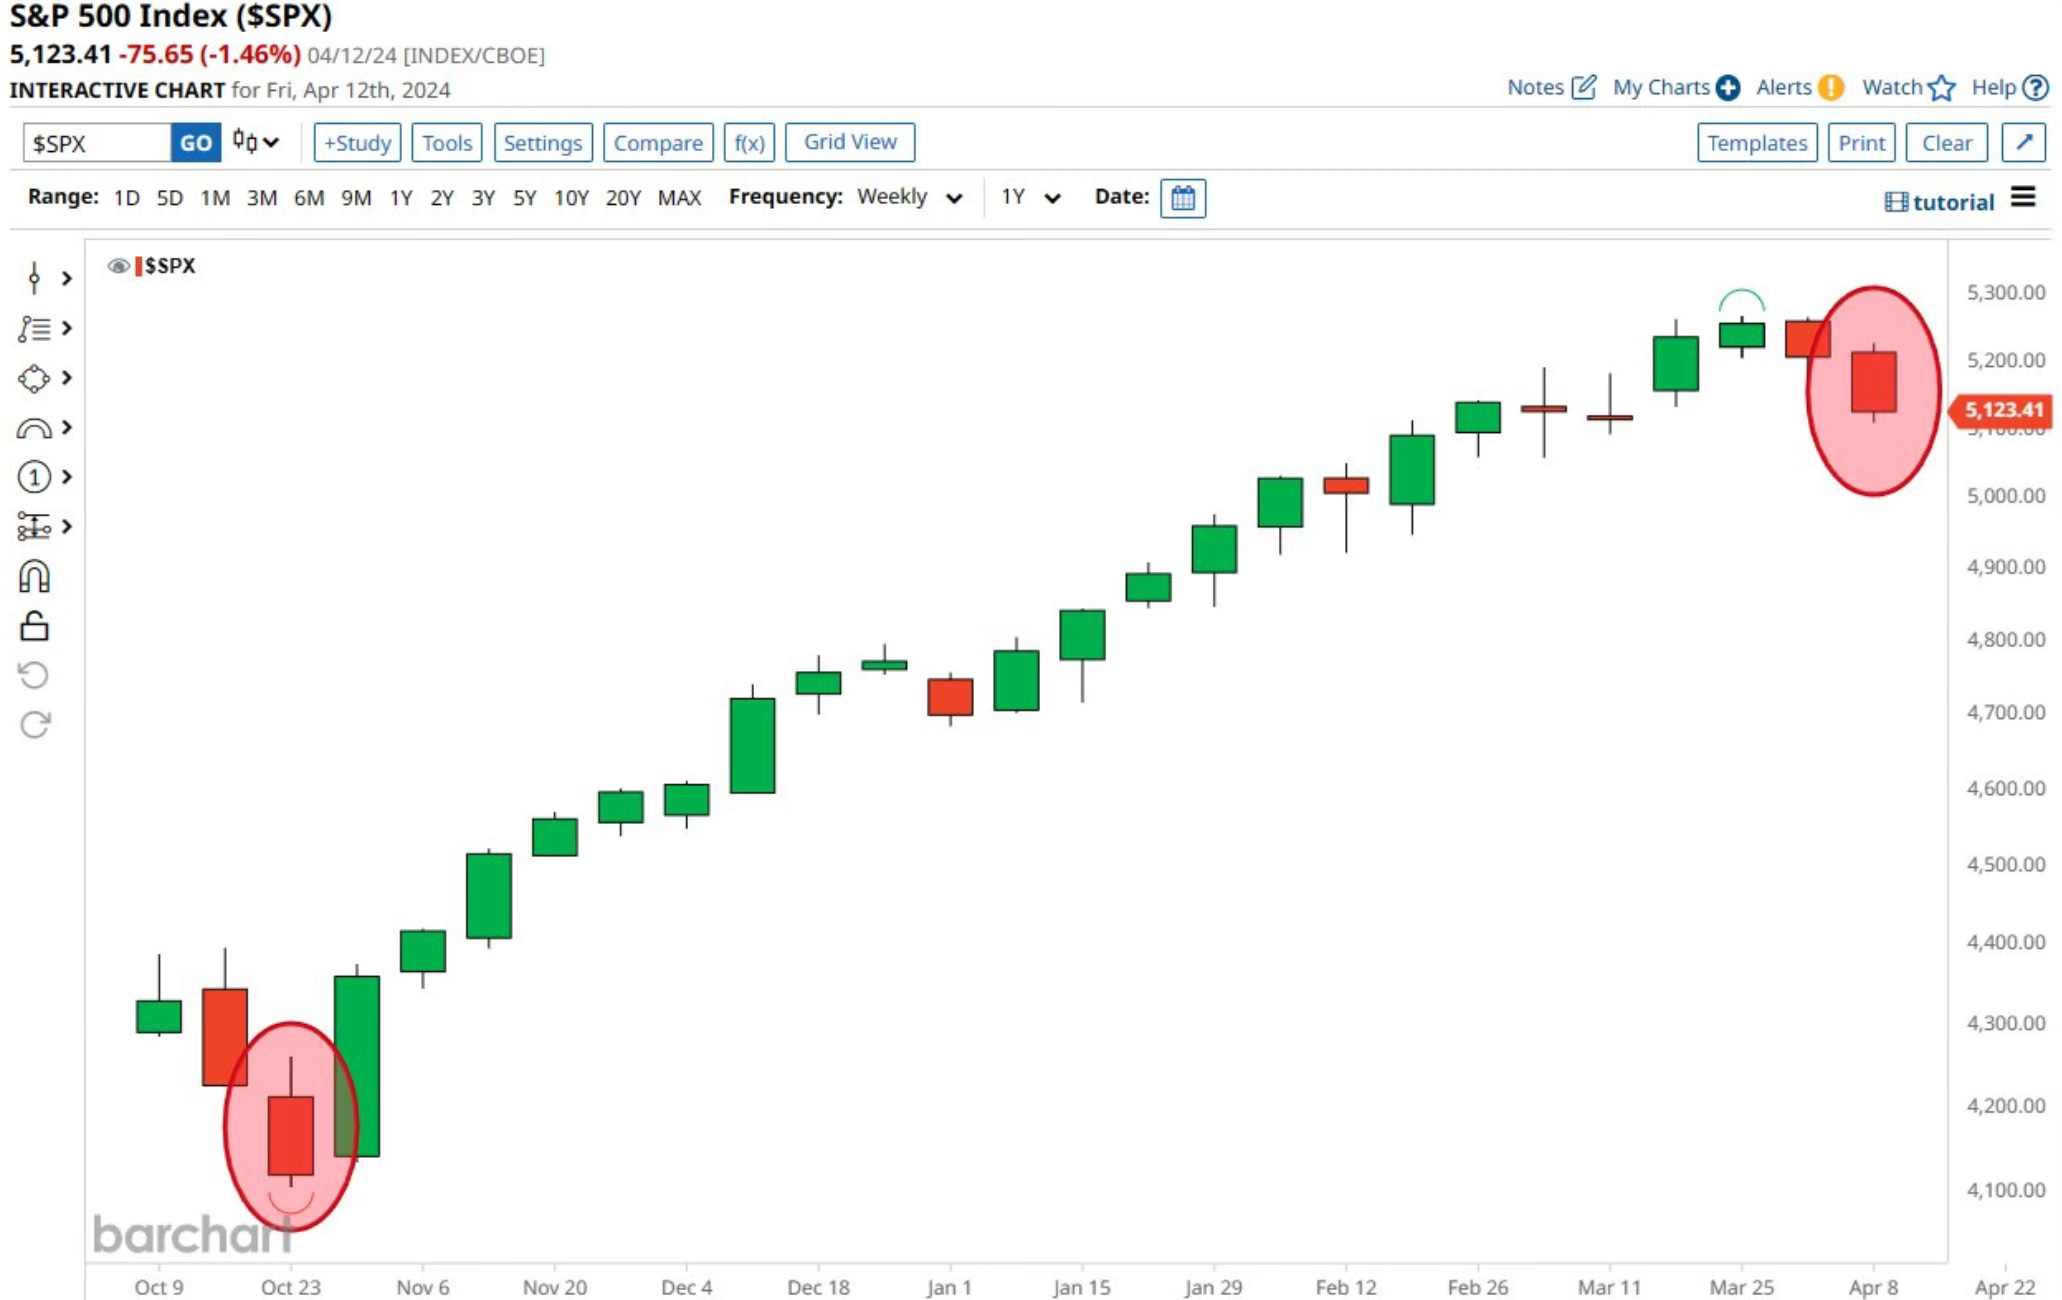
The initial selloff in reaction to the inflation reading on Tuesday was short lived. All the losses from the CPI report were gained back heading into Friday.
Then the bottom fell out on Friday with renewed concerns over an Iran strike on Israel. With the uncertainty it was clear investors didn’t want to be long going into the weekend.

This caused the S&P 500 to have its largest weekly loss in 6 months.
For the first time in 2024 we’re seeing some volatility. The VIX closed at its highest level since October. Even Nvidia saw its second weekly close below the 20-day moving average. That’s the first time since December.
Market Recap

Pullbacks Are Normal
With what’s really the first sign of any volatility this year, we have to remember that pullbacks are normal. I love this updated to date chart from Ryan Detrick that shows the max pullback per calendar year. So far in 2024 the max pullback has been 2.5%. You would have to go back to 1995 for such a shallow pullback. Remember the average intra-year drop is 14.2%.
I wrote about pullbacks last month in Why A Stock Market Pullback is Likely.

Who’s Cheapest Of The Magnificent 7?
From a 12-month forward P/E ratio, Alphabet continues to be the cheapest among the Magnificent 7 stocks. Meta and now even Apple aren’t that far away. The surprise to me is that even with Nvidia’s giant run, it’s still cheaper than Amazon and Tesla. I think all of these still offer a very good long term upside. You can make the case for any of them as the best one to buy right now.

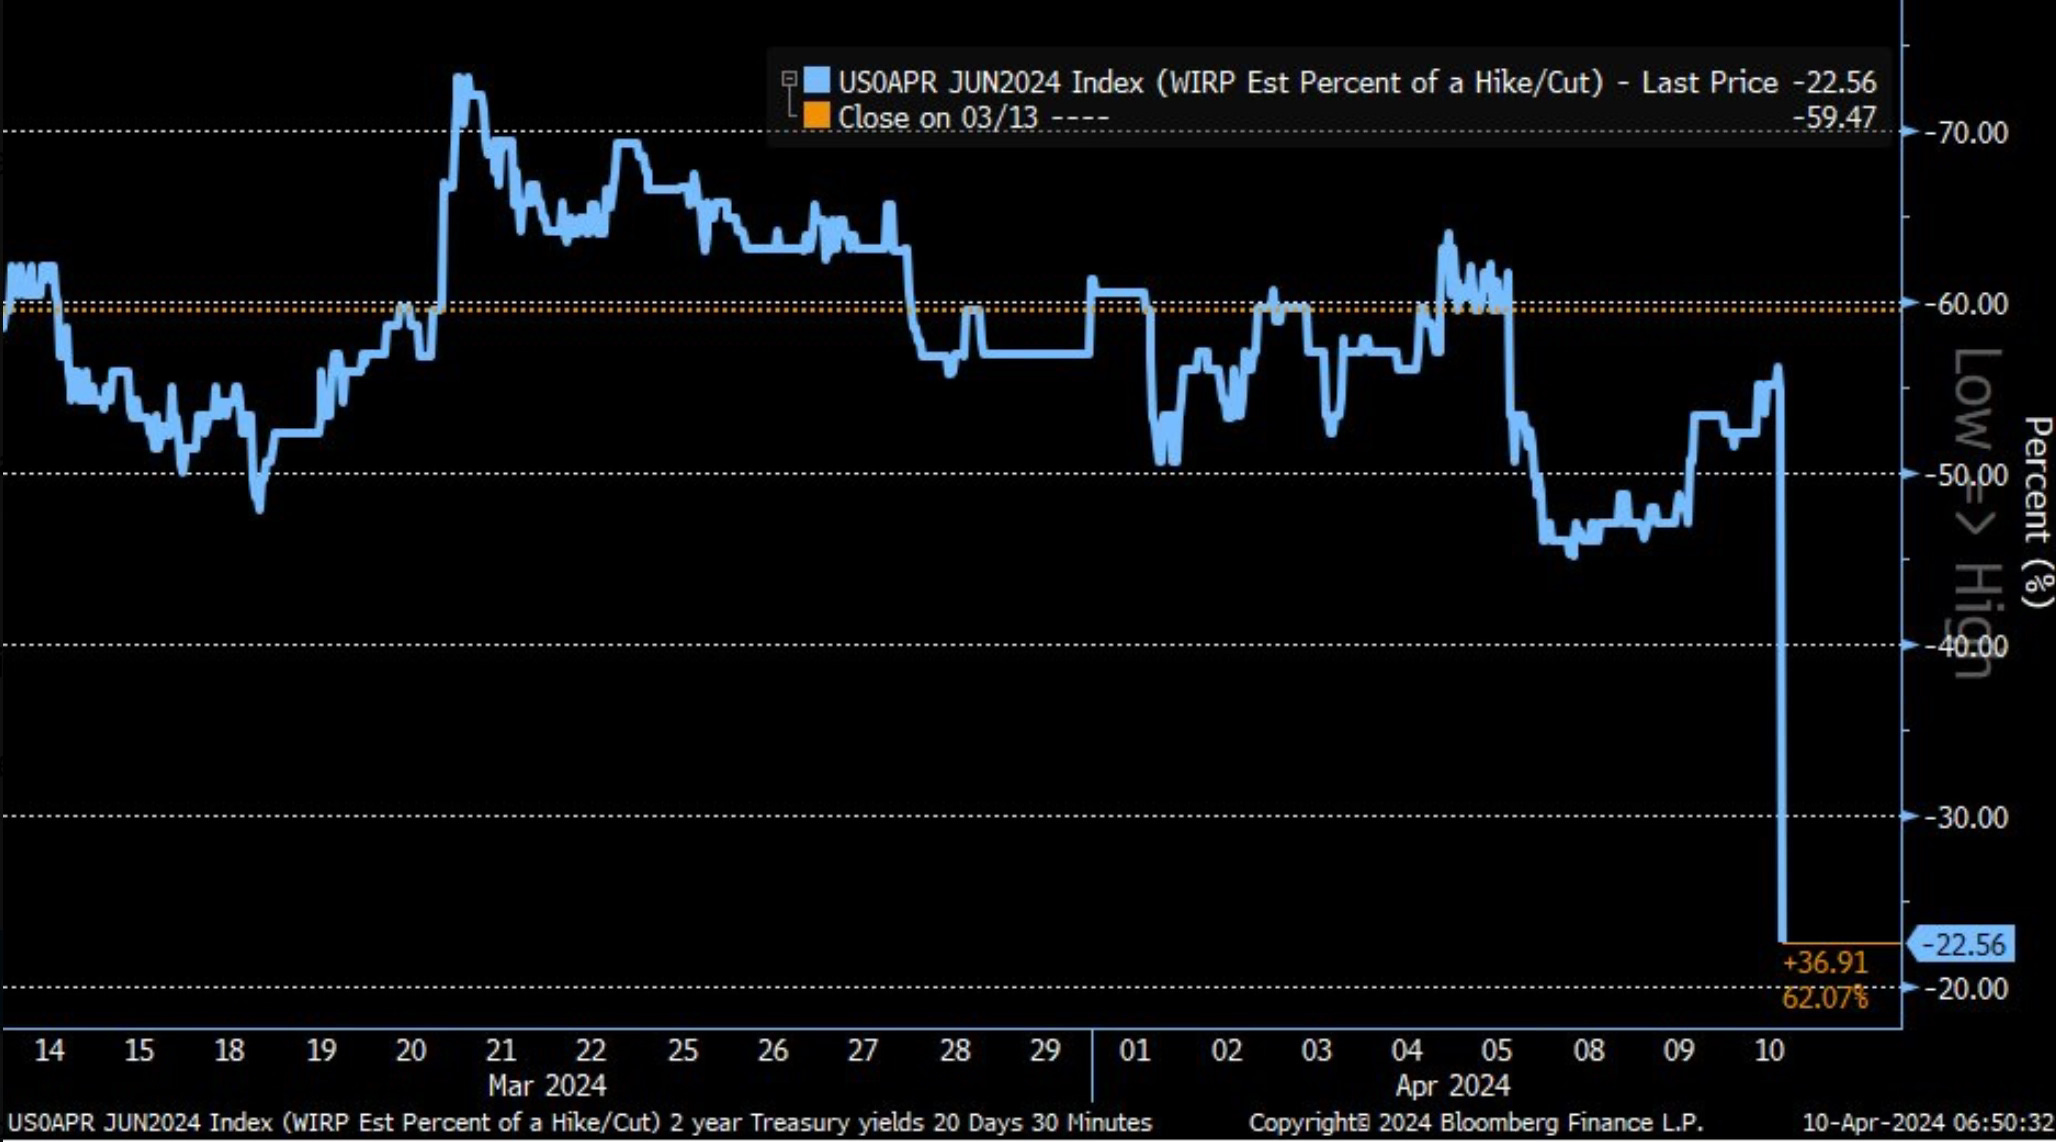
Rate Cut Chances Fading
This week saw the chances of a June rate cut take a drastic fall after the inflation report. With June likely off the table, I really wonder what happens if we continue to see a continued flattening in the next readings. Or what if inflation continues to tick upward again? Do we start hearing the talk of rate hikes? The upcoming inflation reports just got even more interesting.
Data That’s Sticking Out
There continues to be some data that sticks out and it keeps coming from small businesses. I wrote about this in detail last month (What Small Businesses Are Telling Us) and the sentiment and survey results continue to get worse.
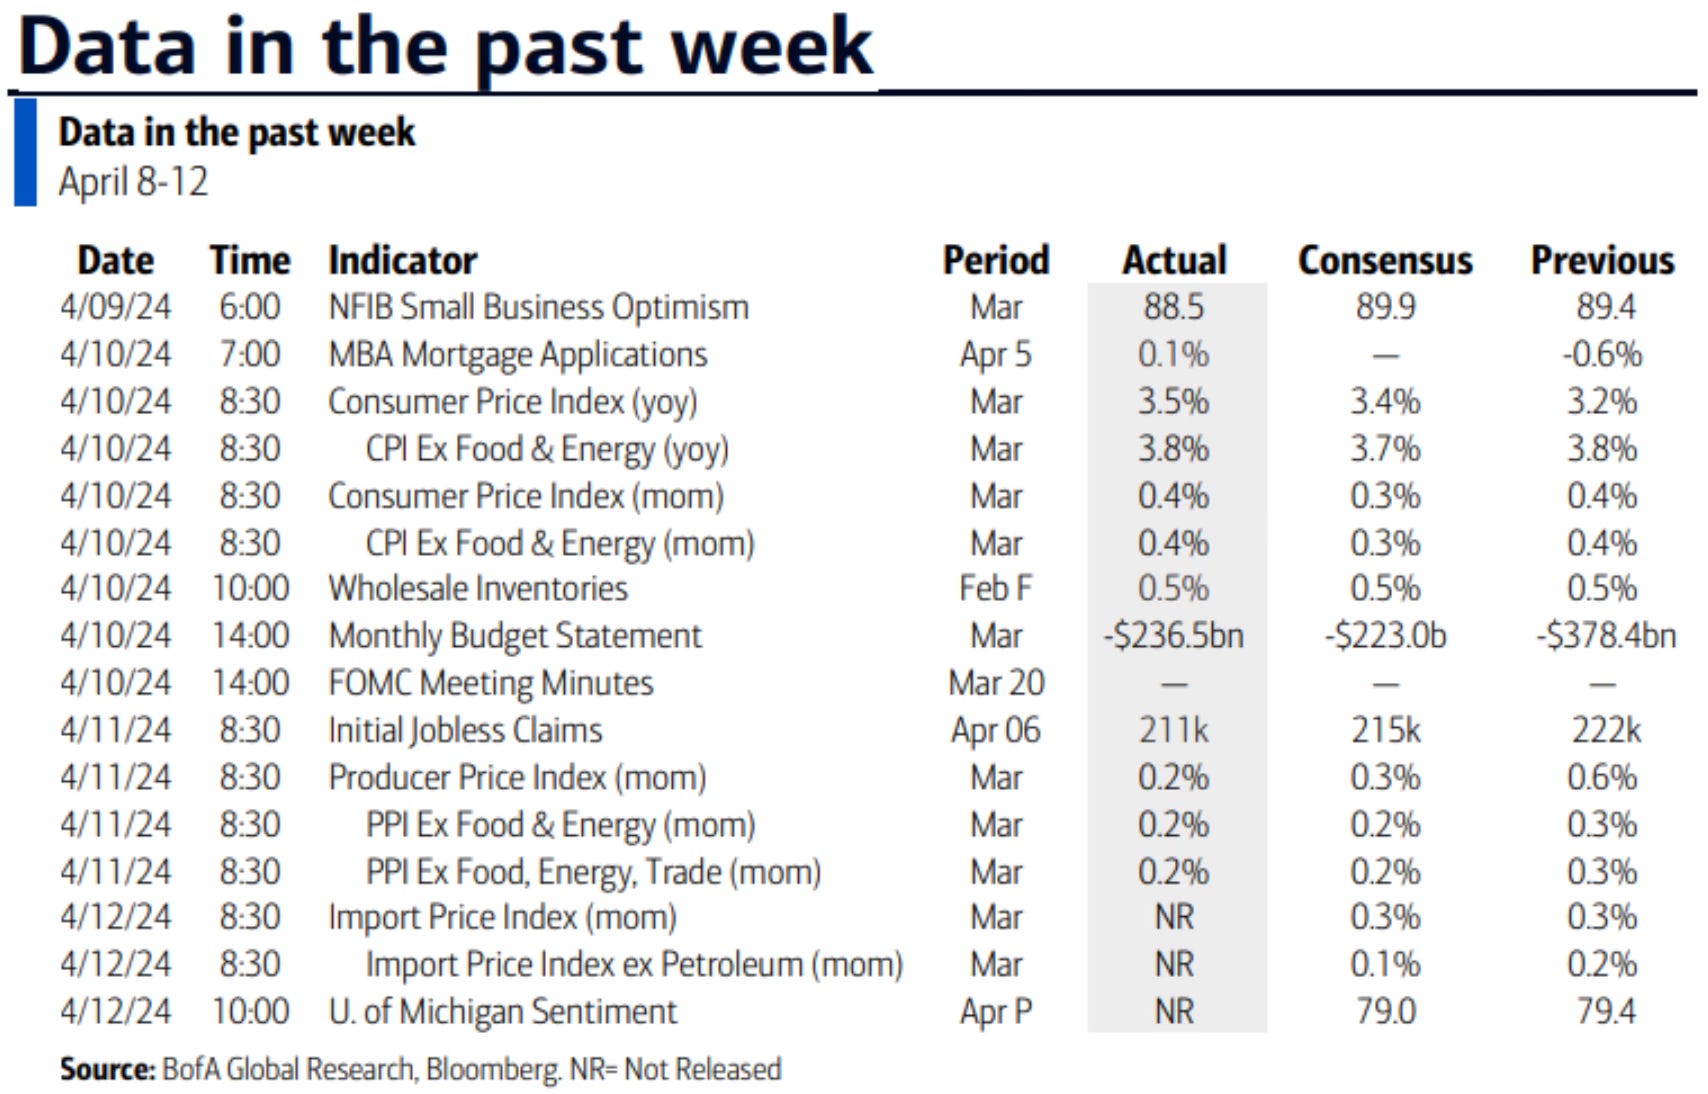
The small business optimism outlook continues to fall. It’s now at an 11-year low.

Small business hiring plans have also fallen further and now sit at the lowest level since June of 2016.

Poor sales is now starting to creep higher on the survey as the single most important problem for small businesses.

The most interesting chart on the small business survey topic was from Richard Bernstein Advisors.
They make the point that small business pricing plans tend to lead CPI (inflation). The latest survey results are pointing towards an increase in inflation, not a decrease.

Still in the small business arena, the chart that really caught my eye is what restaurants are seeing. I am still a bit shocked to see that restaurants sales and traffic are at their lowest levels since they weren’t even able to operate back during the pandemic. It’s actually fallen below the GFC levels and only the pandemic was worse.

Since this has now really been something that has been deteriorating for multiple months now, it’s really worth asking what does this mean? Is this a leading indicator of more trouble ahead? Or is this just a rough patch for small businesses and it won’t have an affect on the broader economy and stock market. Time will tell.
Upcoming Earnings & Data
Earnings start to get into full swing next week with 41 S&P 500 companies reporting.


The Coffee Table ☕
I learned a lot in reading What Makes Housing So Expensive by
who writes . I love his chart that shows the cost breakdown for a new single-family home. I would have shared it but it’s too big. This was a well researched and informative piece. If you’ve been puzzled by the housing market, this may help answer some of those questions.Michael Batnick wrote a great reminder about investing at all-time highs in Don’t Be Afraid. You can’t look at the stock market being at all-time highs as a reason to not buy. In fact the opposite is true and Michael provides some updated charts to reinforce that all-time highs is a time to buy.
The most interesting thing I came across this week was the ratings for the men’s and women’s college basketball championship games. The women’s title game had 18.9 million viewers versus the men’s who had 14.8 million. That’s the first time in history that the women’s game outdrew the men’s.

Thank you for reading! If you enjoyed Spilled Coffee, please subscribe.
Spilled Coffee grows through word of mouth. Please consider sharing this post with someone who might appreciate it.
Order my book, Two-Way Street below.
