


Investing Update: Hedge Fund Buys & Holdings
What I'm buying, selling & watching
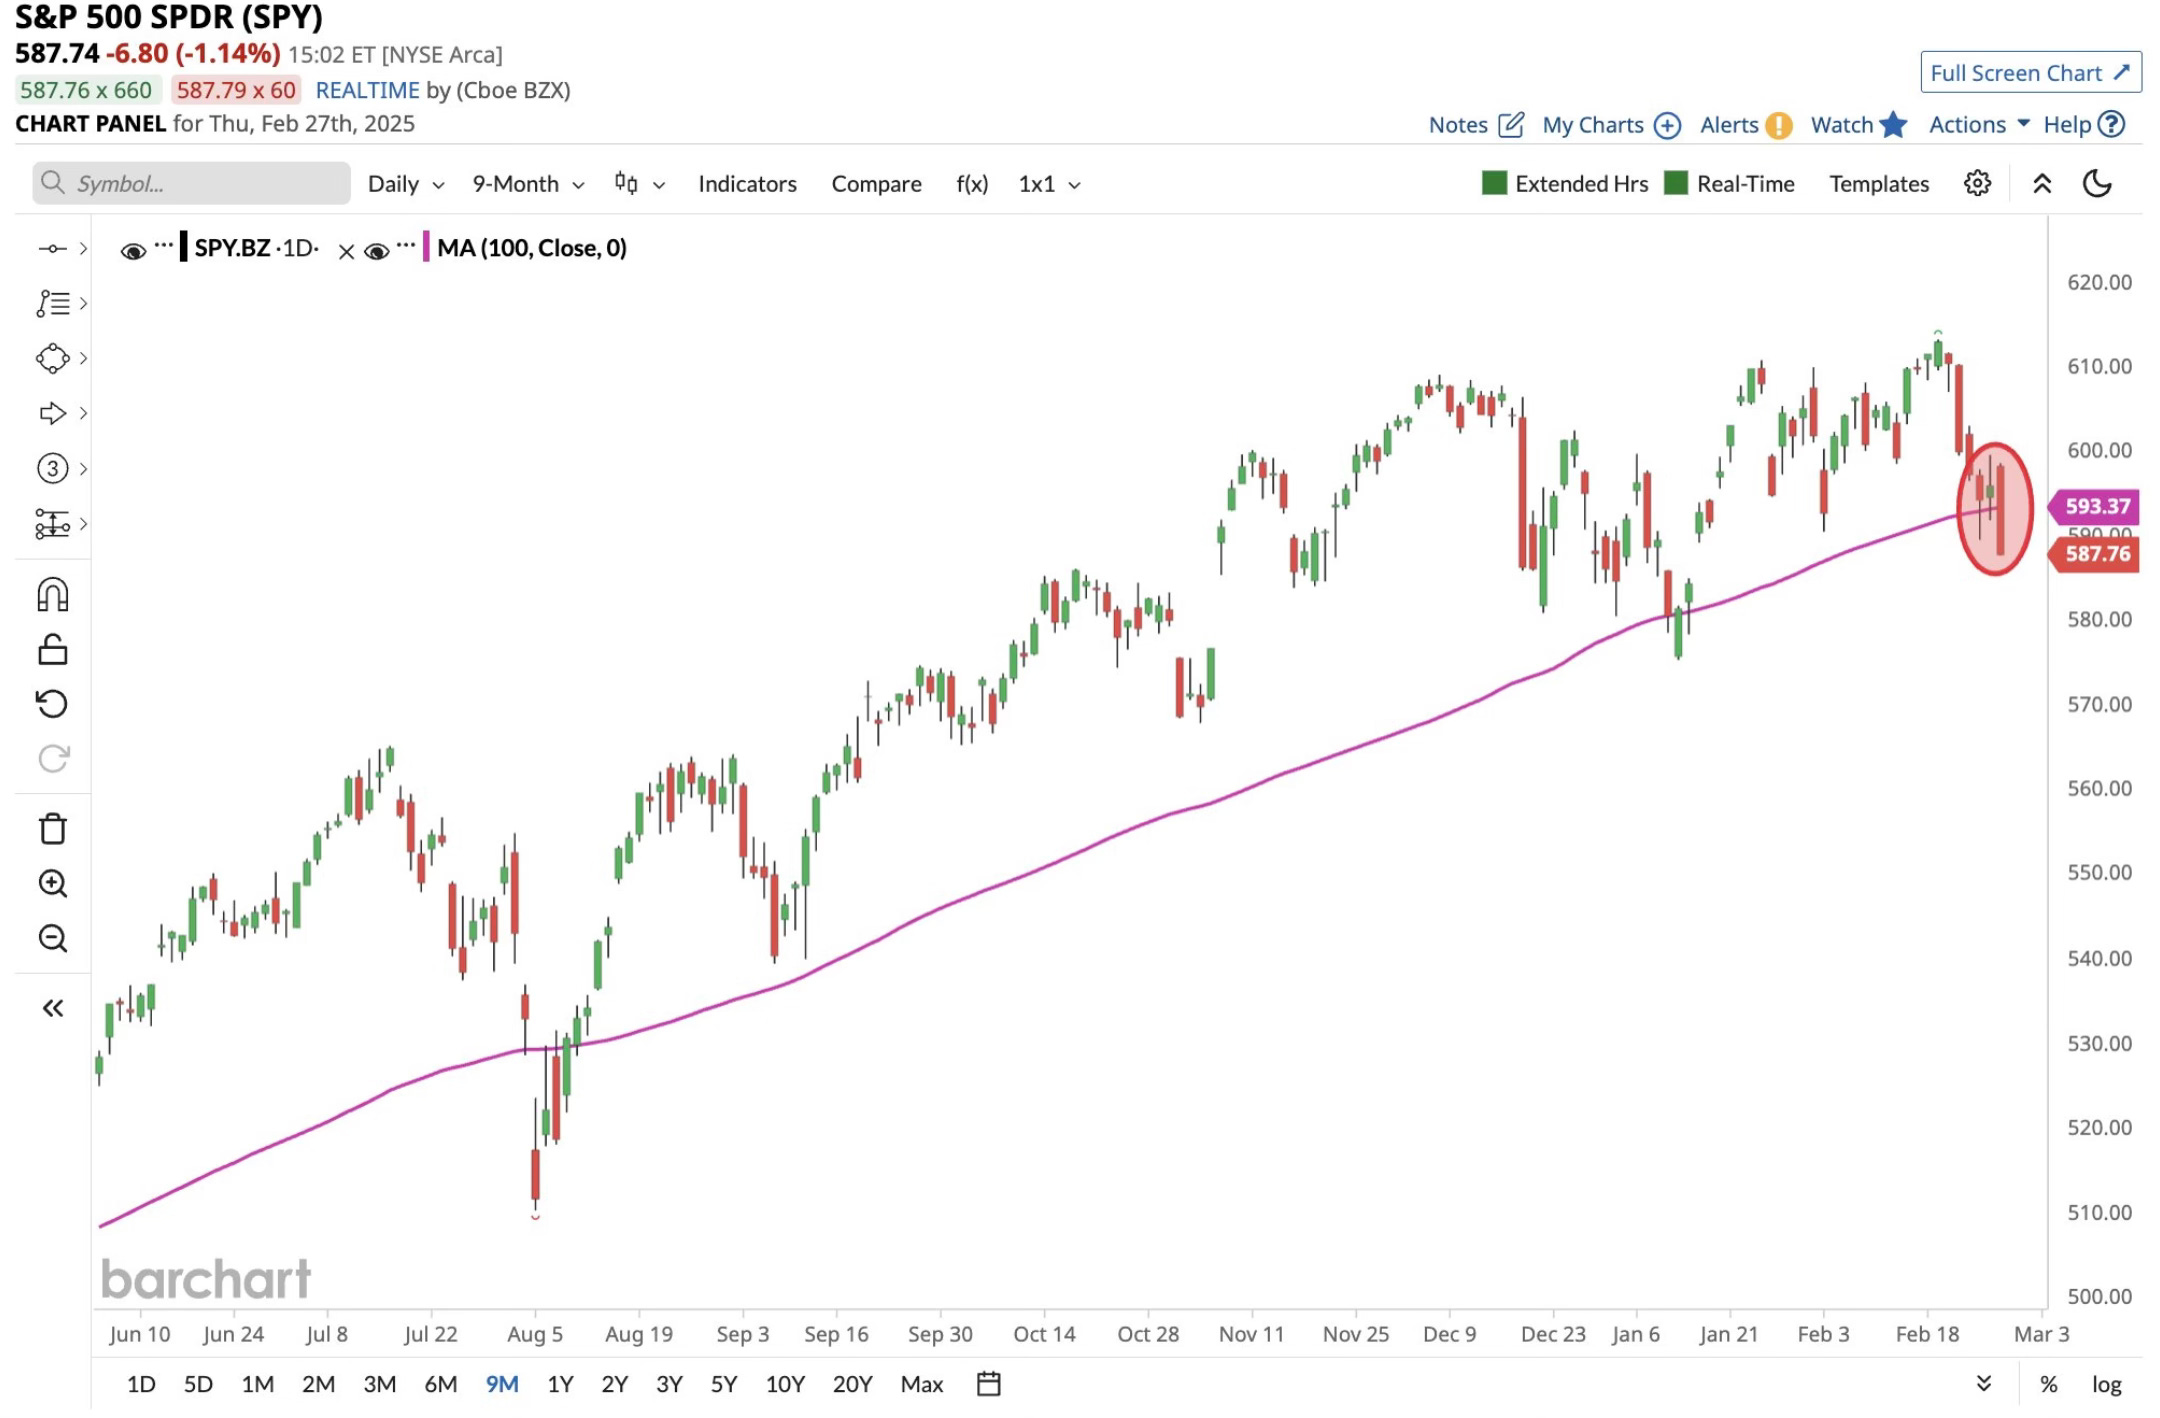
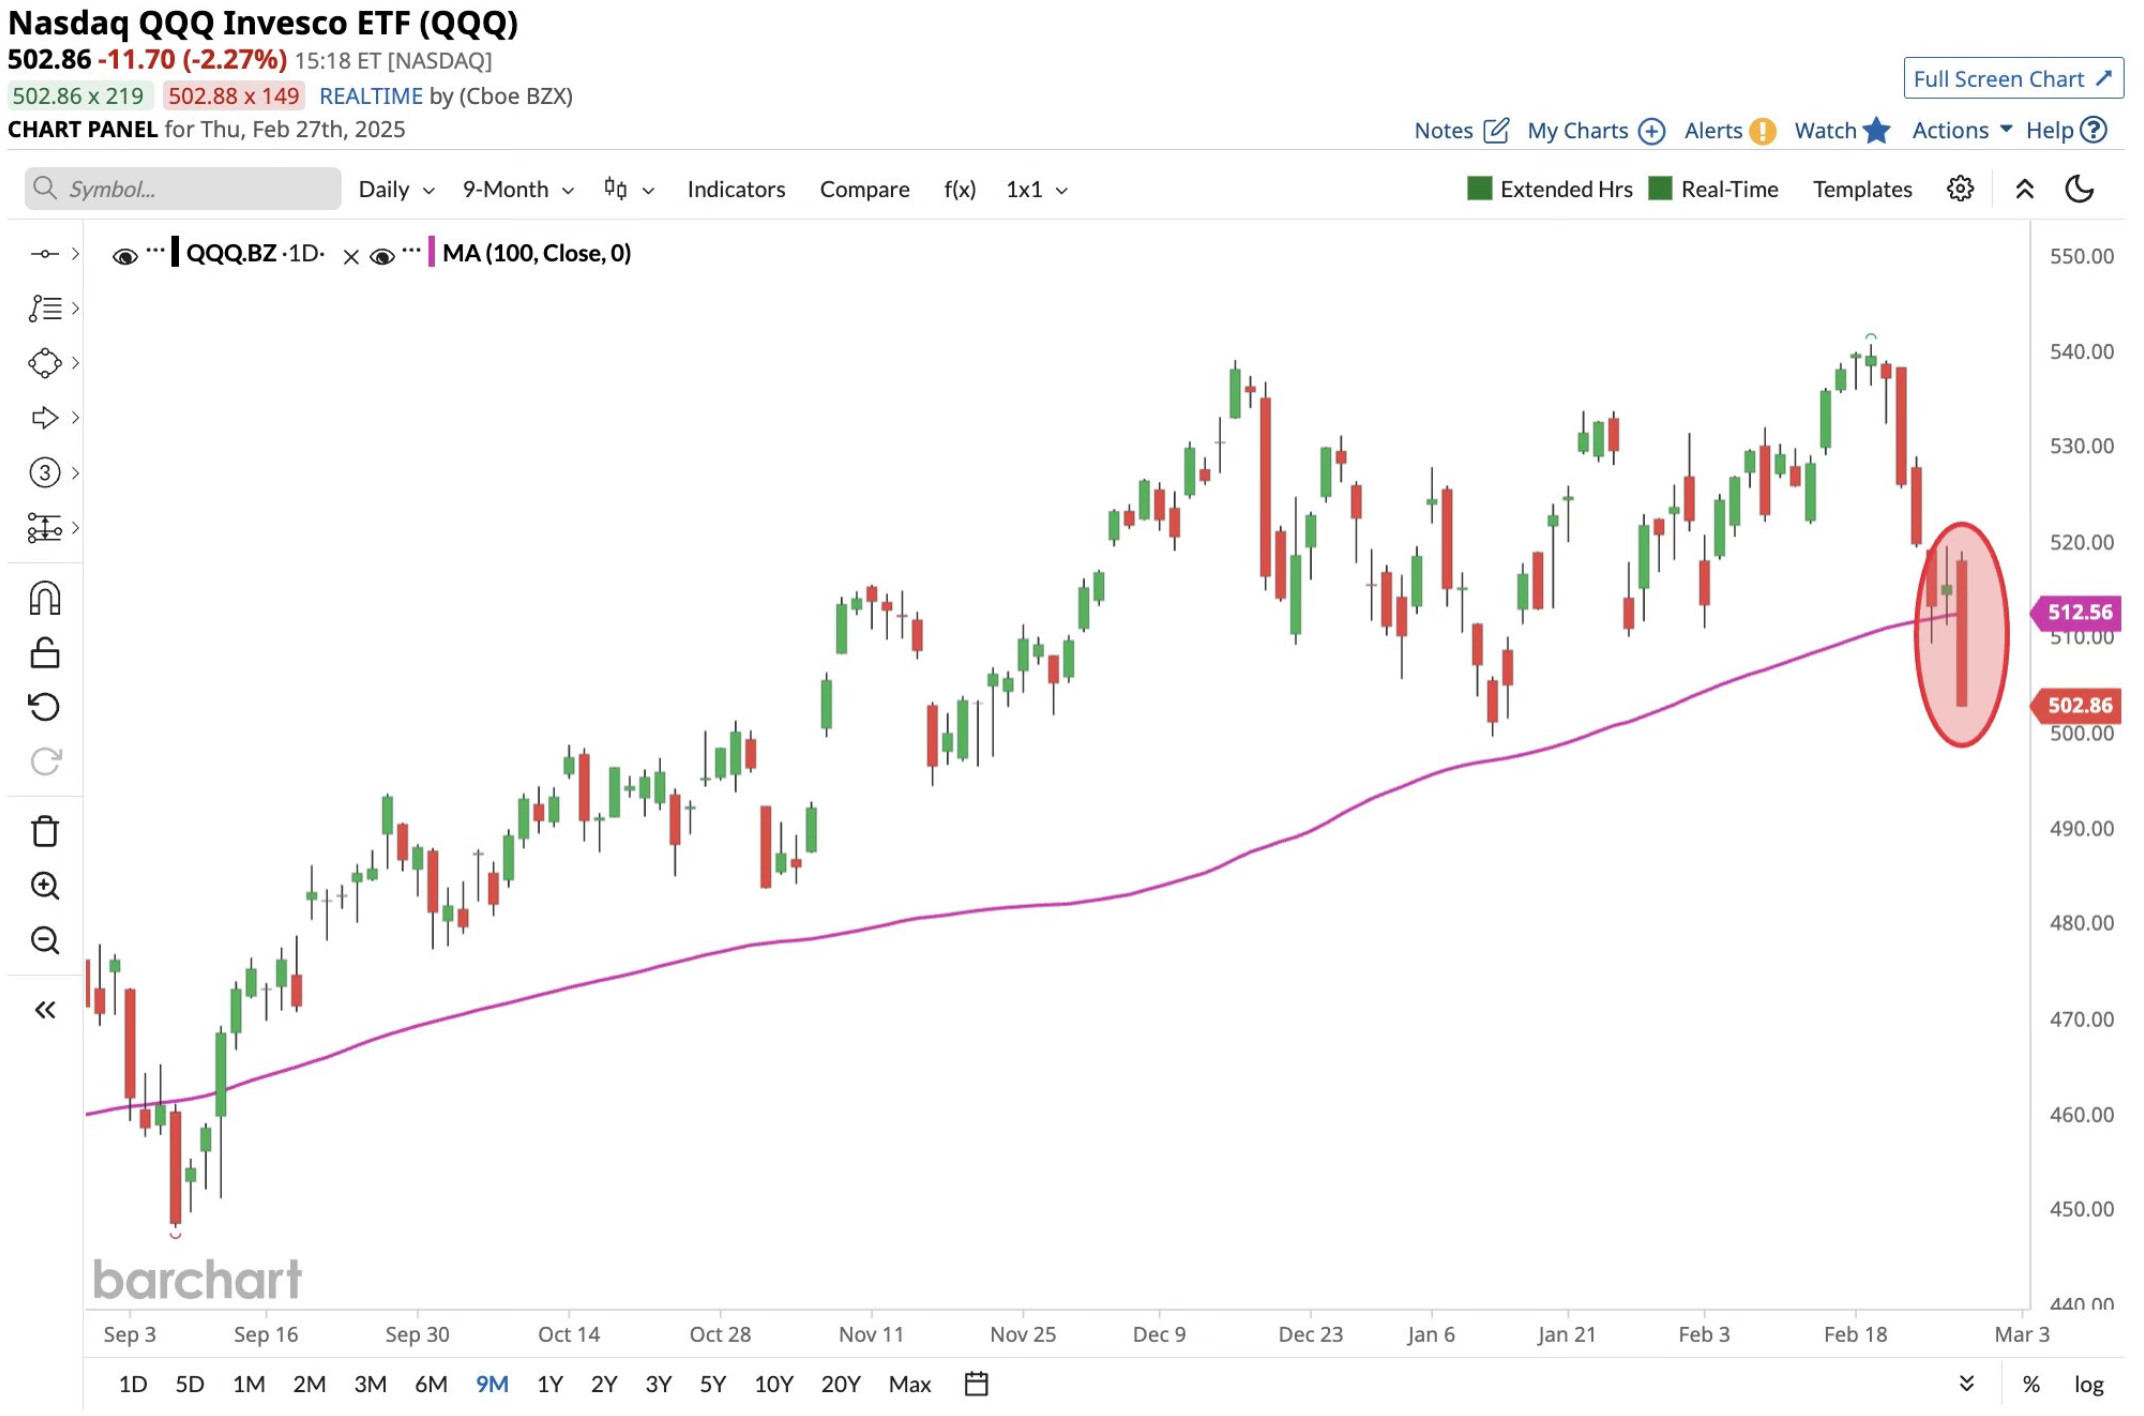
This week saw the YTD gains go away. The S&P 500 and Nasdaq both fell below their 100-day moving averages.
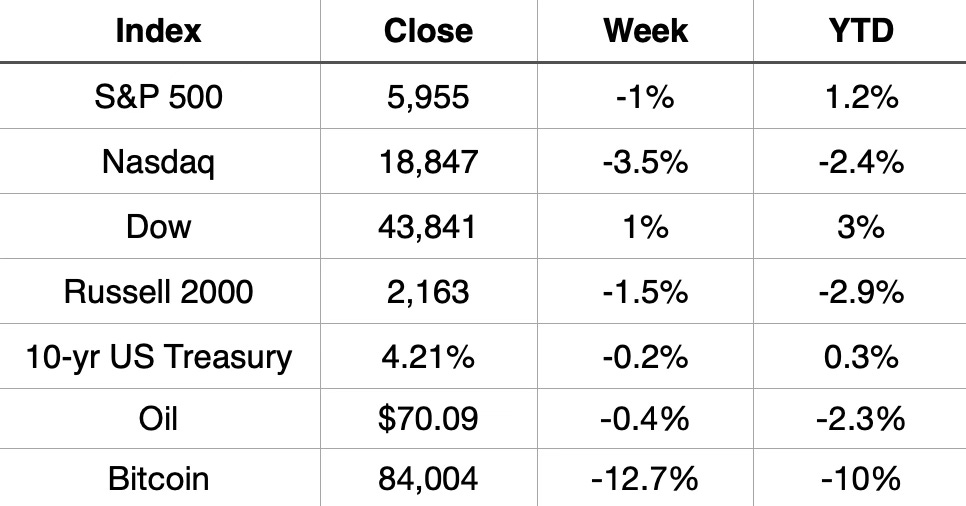
The S&P 500 finished down 1% for the week and its now only up 1.2% on the year.
The Nasdaq finished down 3.5% on the week and has now turned negative for the year, down 2.4%
Market Recap
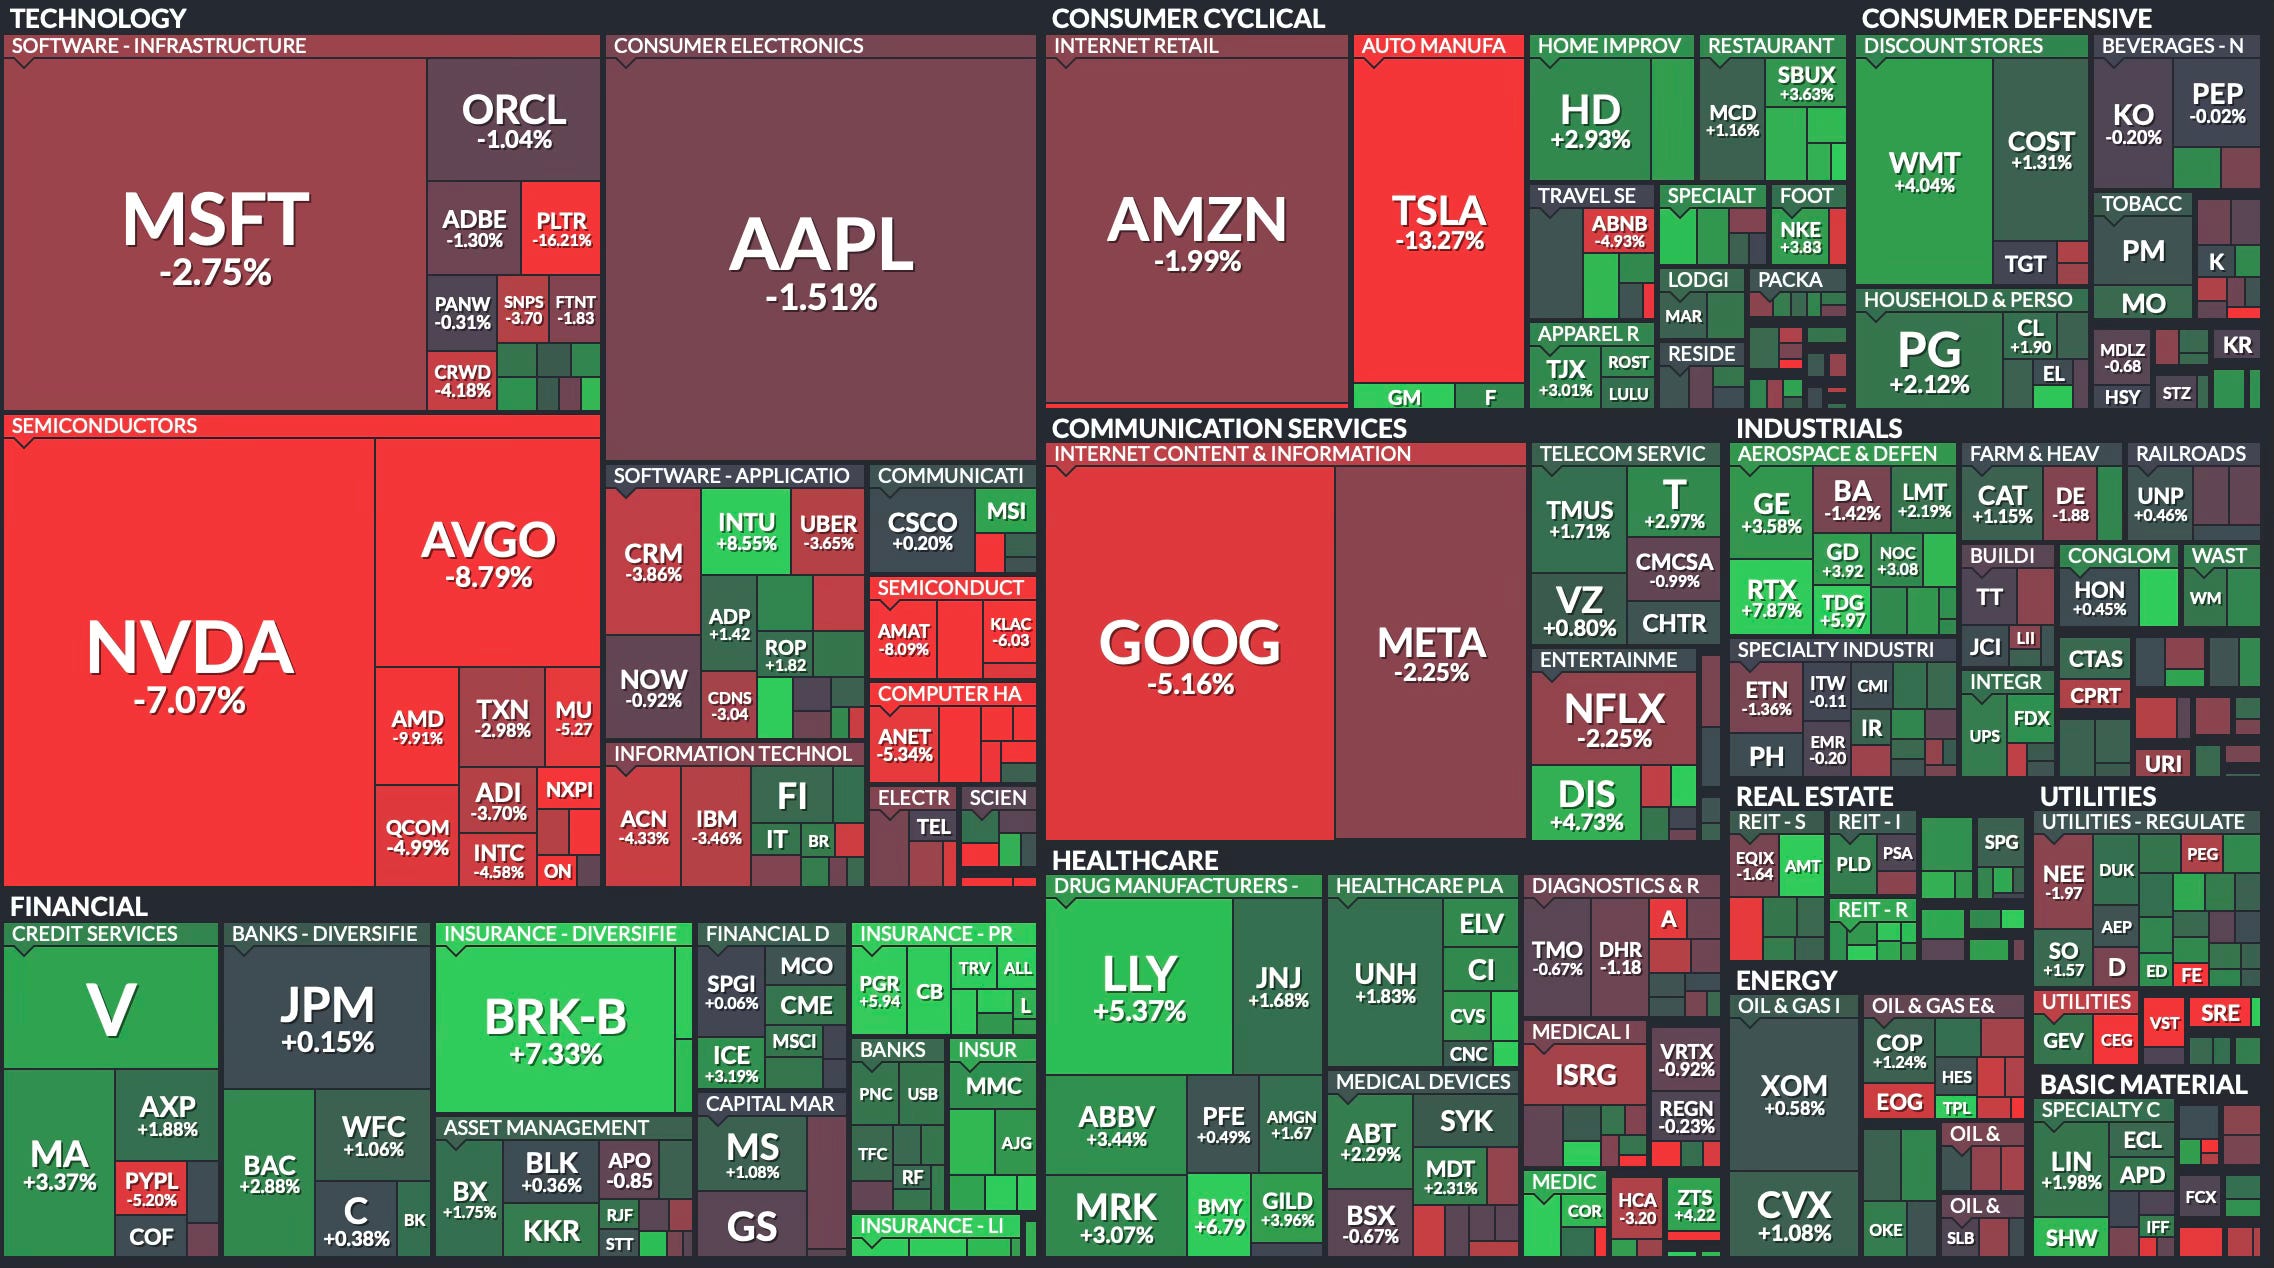
Weekly Heat Map Of Stocks
Here are some notable names and where they stand from their highs through Friday.
% Off 52-Week High
Gold -3%
S&P 500 -4%
Apple -8%
Amazon -13%
Microsoft -15%
Google -18%
Nvidia -18%
Bitcoin -24%
Palantir -33%
Coinbase -38%
Tesla -39%
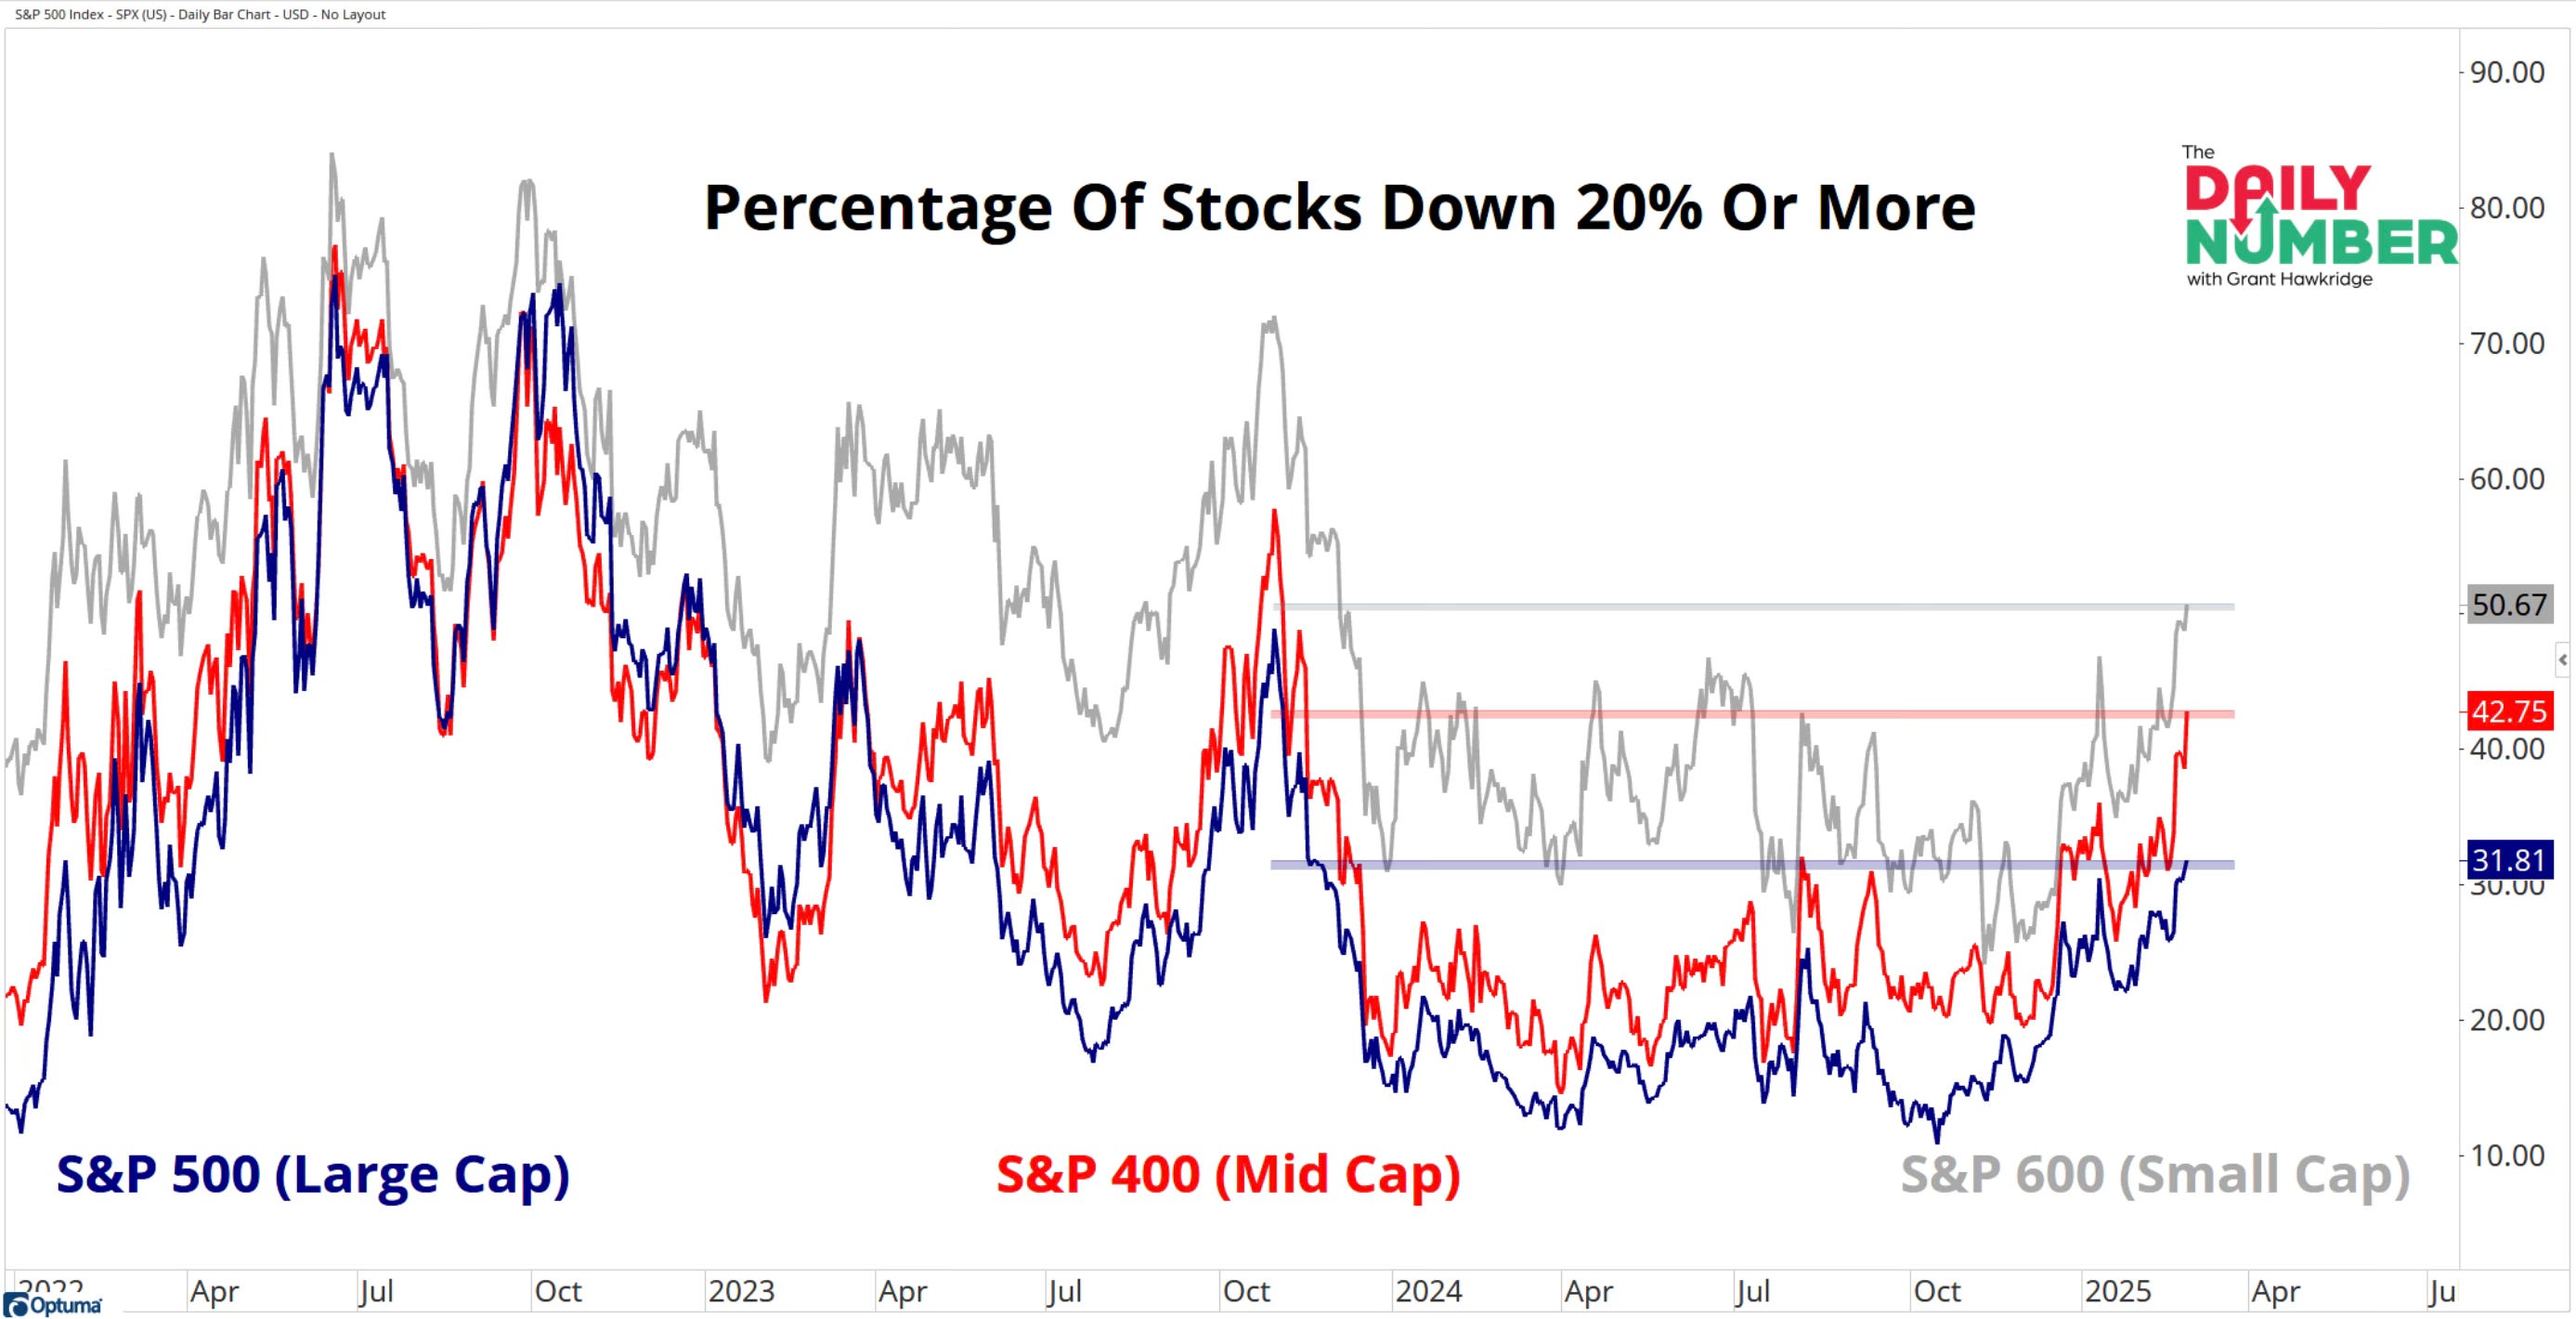
The percentage of stocks down 20% or more has spiked. 20% is an important number as that is technically considered a bear market. Almost one-third of S&P 500 stocks are now down 20% or more. This is noteworthy and bears watching.
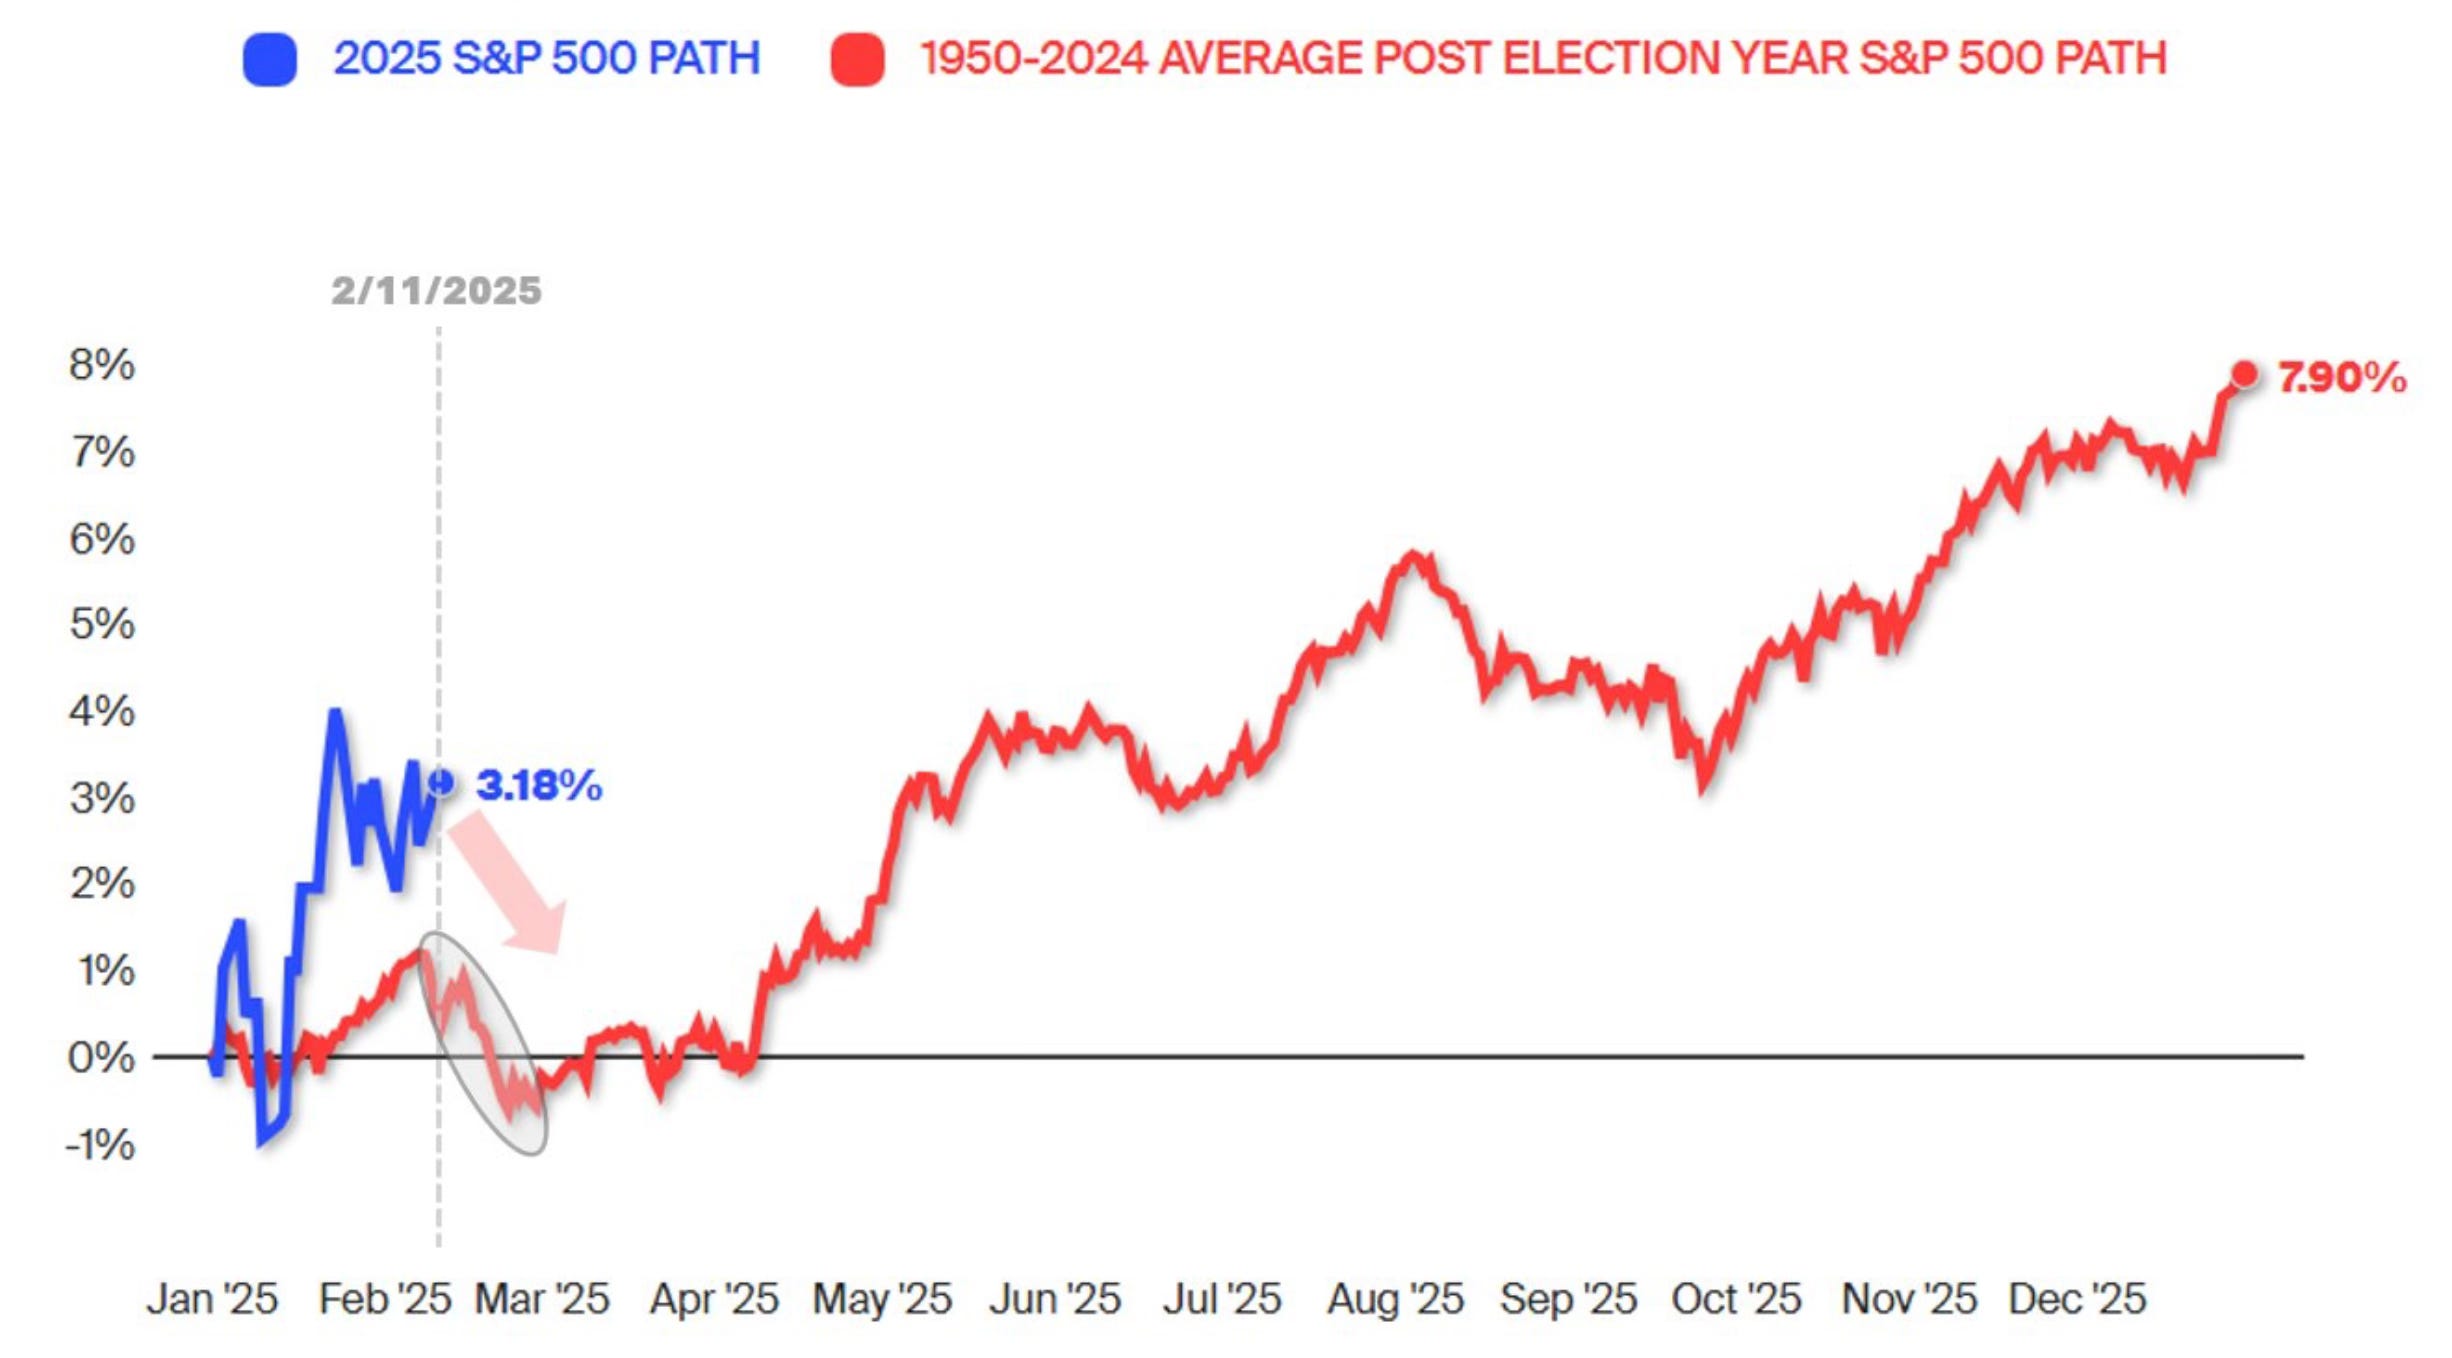
Now we have to keep in mind that this isn’t abnormal to see some high levels of volatility at this point in the year. Especially in a post election year. It looks like it’s actually tracking very similarly to the average S&P 500 post election year going back to 1950.
We will see what March holds. Three area are under the microscope as we turn the page on February. Economic growth concerns are starting to come into question, trade policy via tariff uncertainty still remains and the Magnificent 7 struggles are leading to questions if the market can hold without their leadership.
None of these are showing anything other than assumptions at the moment. This bull market still is intact and there is no reason to think otherwise. Nvidia didn’t bomb earnings and crash the market. Earnings still remain very strong from companies. A slight pullback isn’t unhealthy. It’s normal.