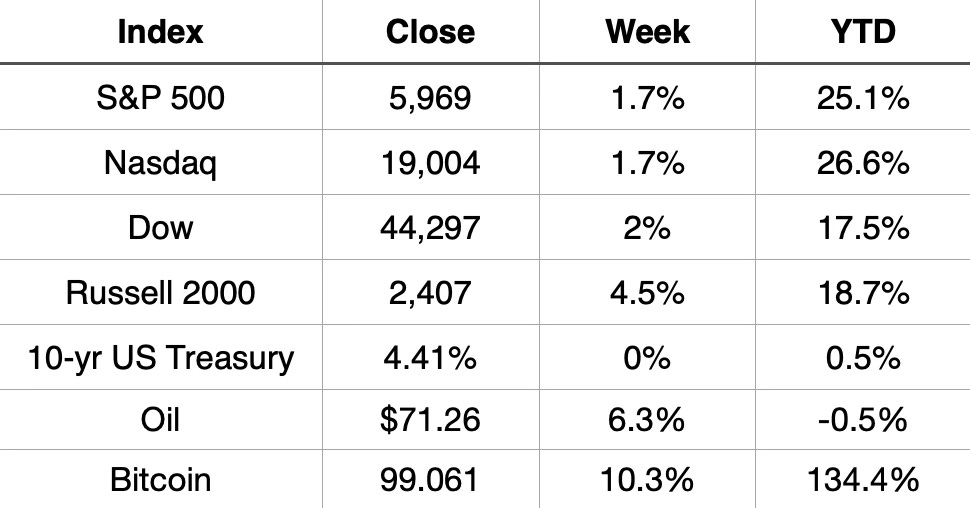
With a week full of company earnings and Nvidia reporting Wednesday, Wall Street liked what companies had to say. The stock market climbed higher all week long. All three major indices finished positive for the week.
The S&P 500 is now up 25.1% YTD. The Nasdaq leads all three indices up 26.6% YTD. The Dow is up 17.5% YTD.
Market Recap
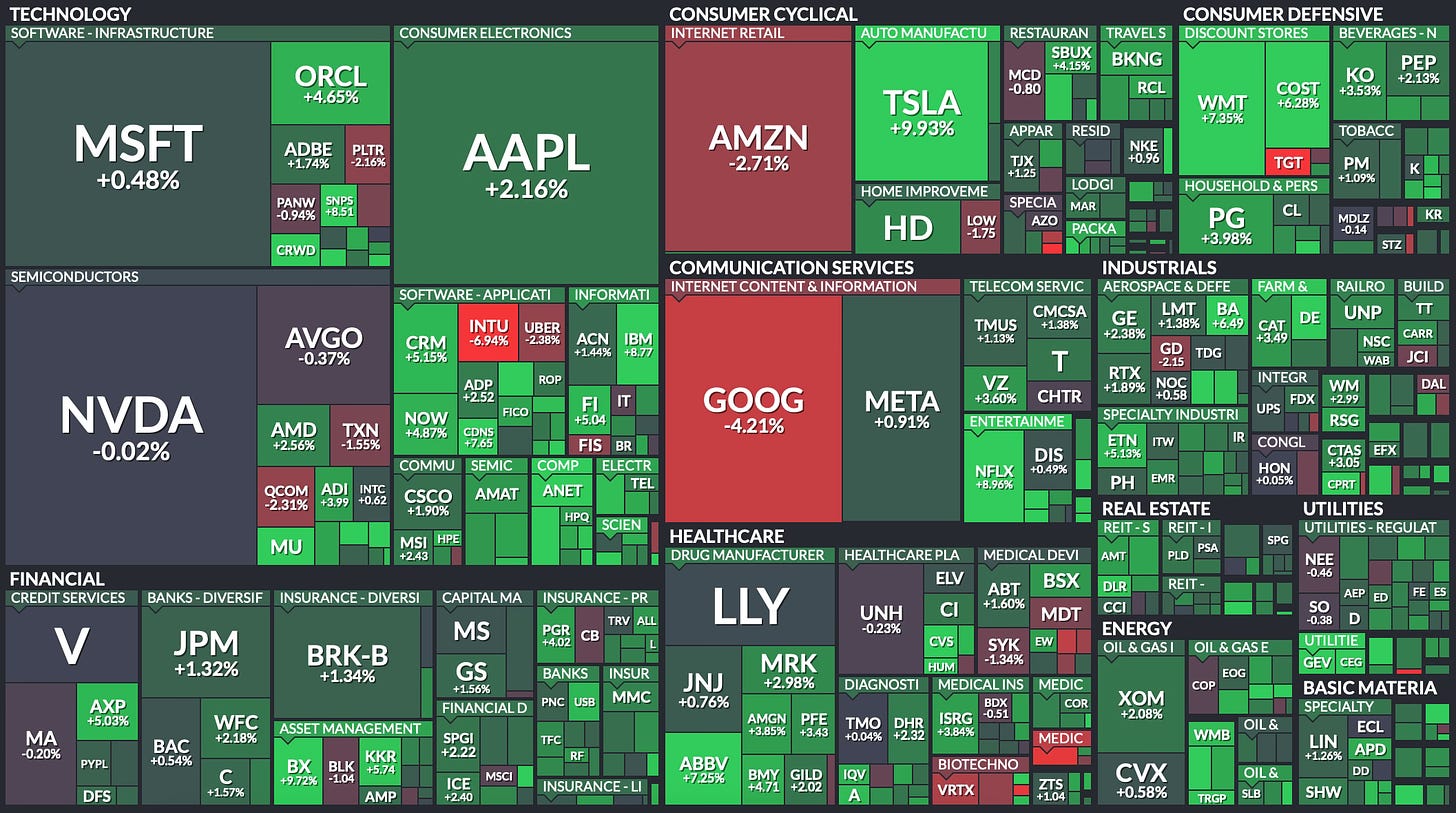
Weekly Heat Map Of Stocks
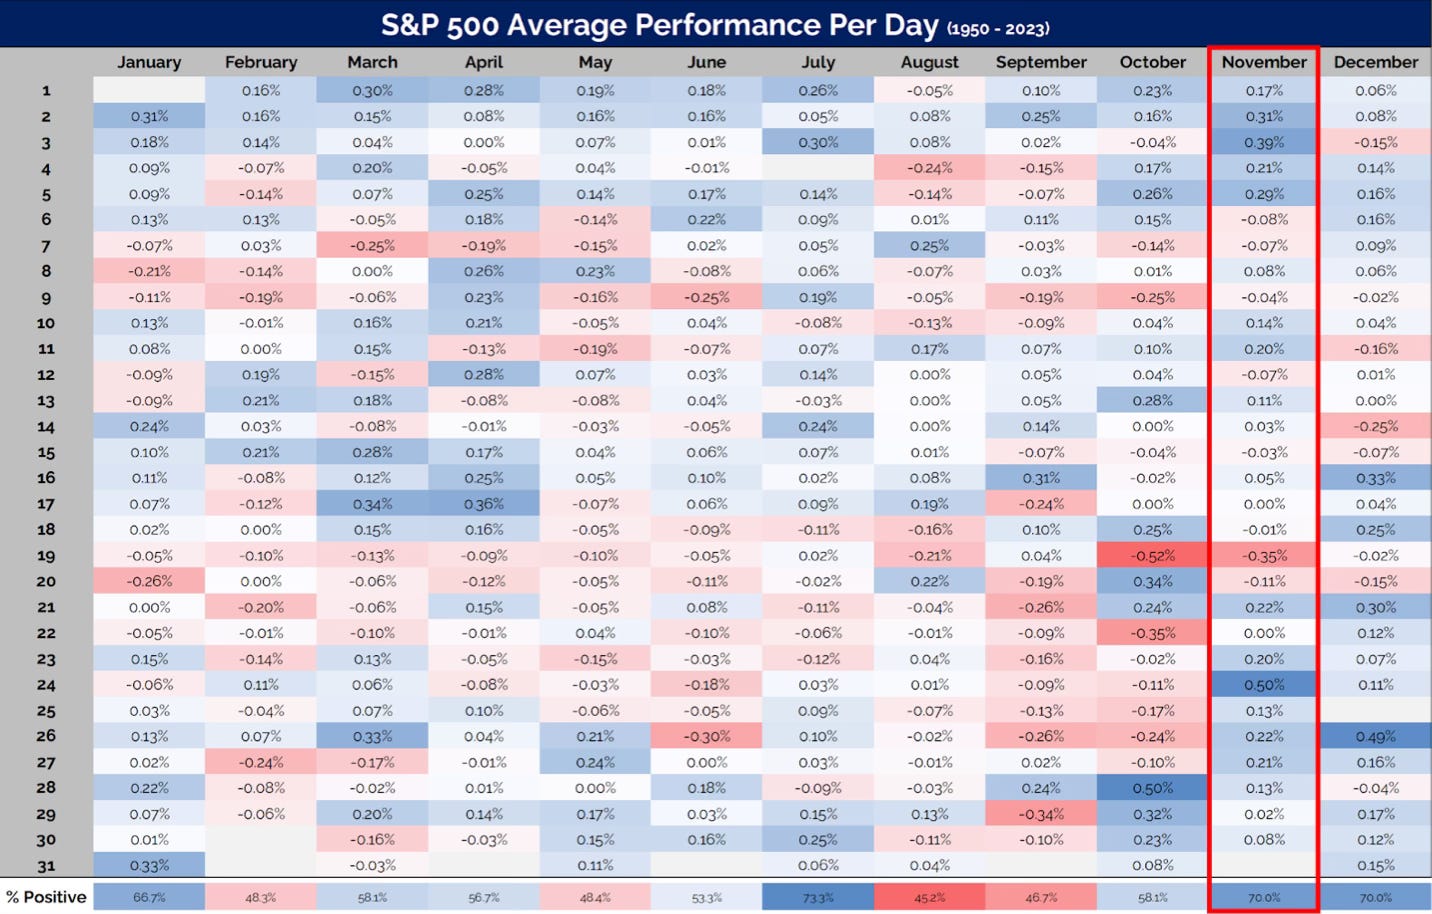
What is normally a down stretch in November is about passed. We now embark on what has traditionally been a Thanksgiving rally into month-end.
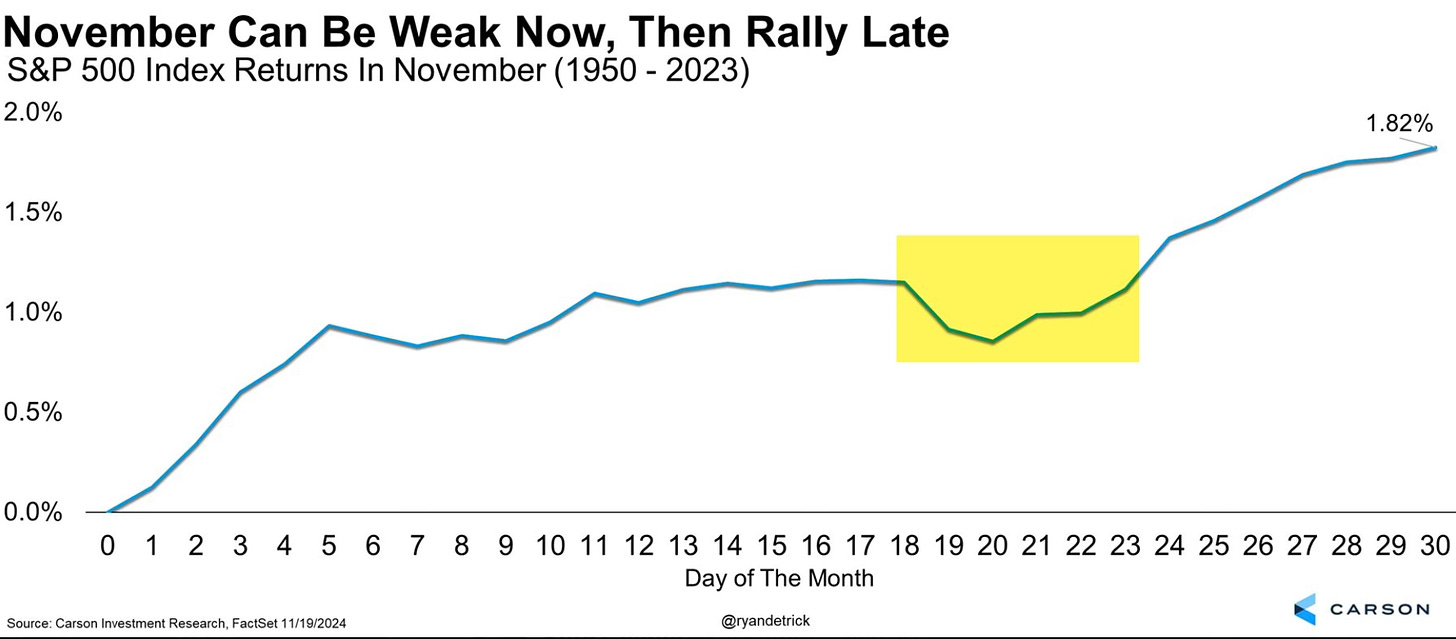
If you look at the historic daily performance, you can see the possible strong stretch upcoming. The back part of this month leads into a Thanksgiving rally. Then the end of next month leads into the annual Santa Clause Rally.
Noteworthy Charts
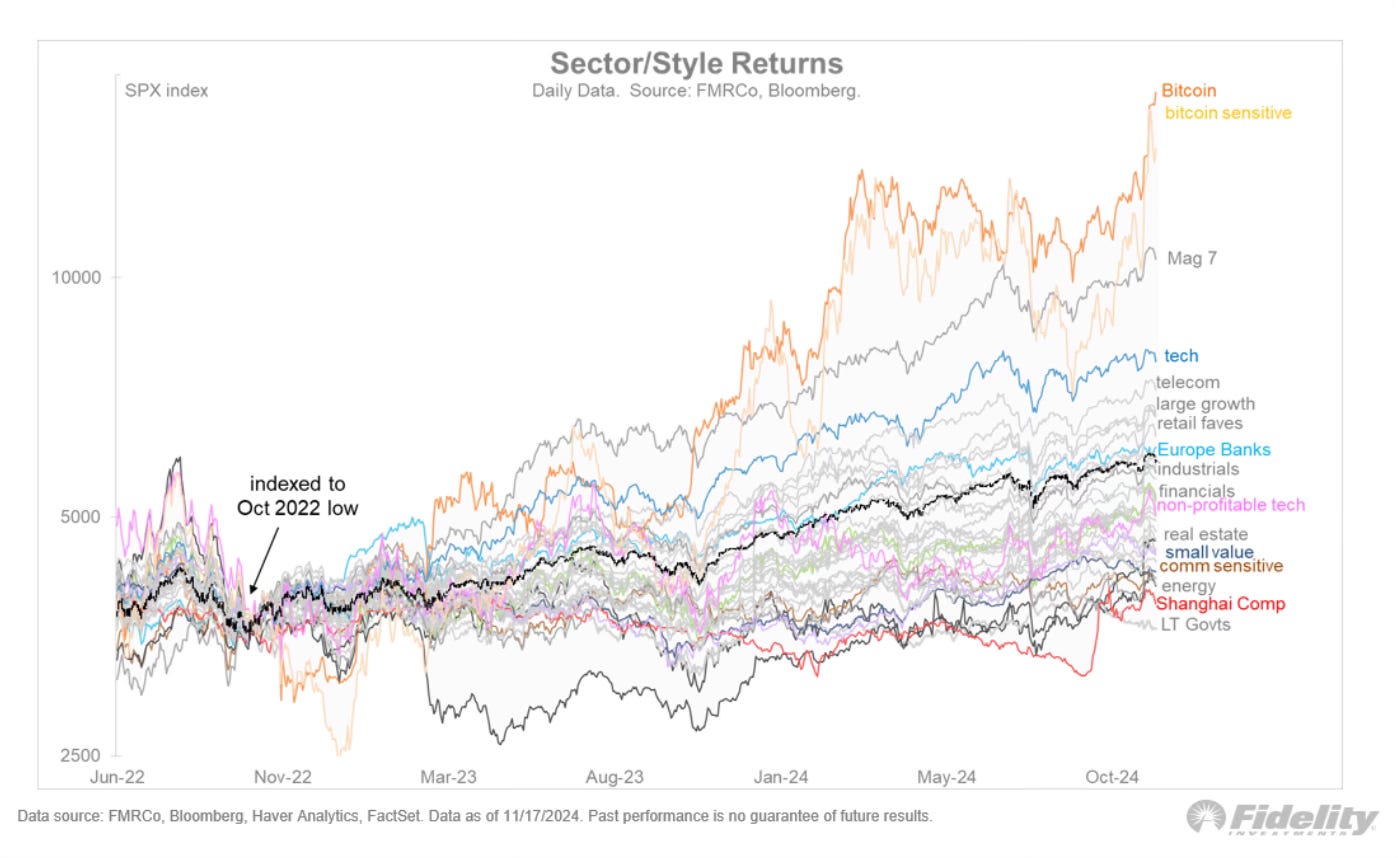
I found this chart interesting to see what different sectors have done. You can see what each has done since the October 2022 lows and then the big moves since the election.
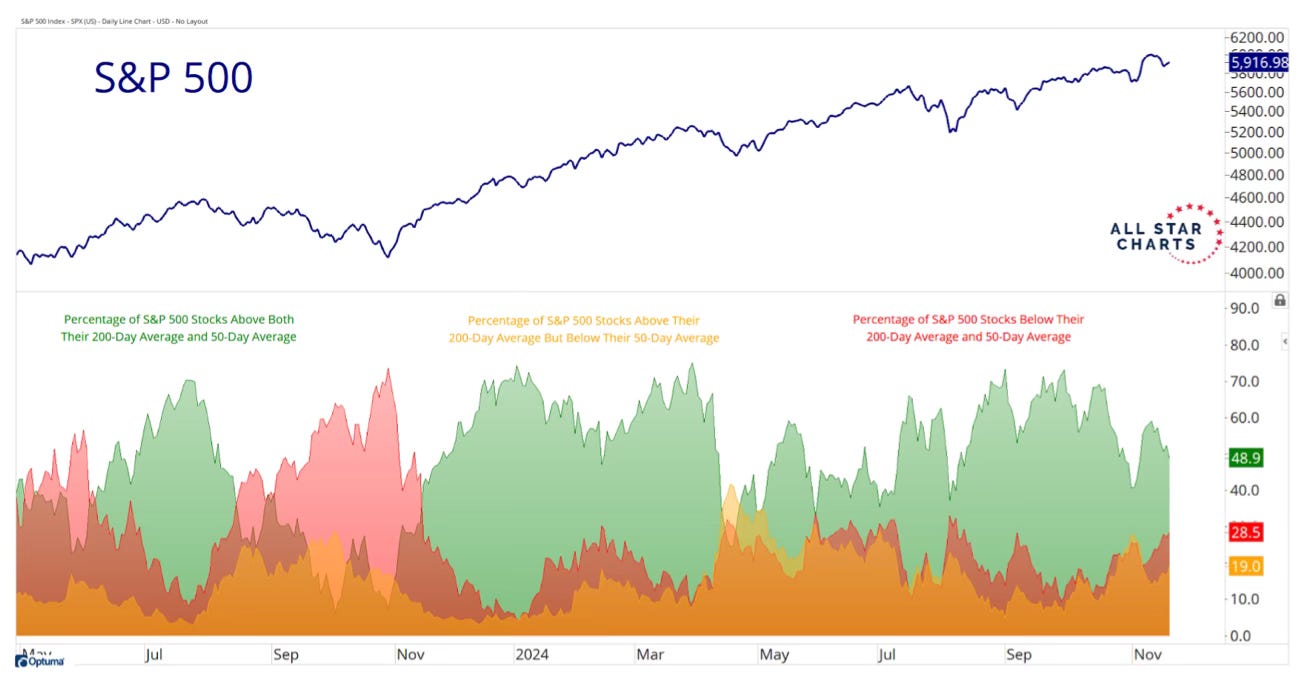
I was surprised at what found when I looked at some of the under the surface data. Did you know that less than half the S&P 500 stocks are in an uptrend? I wouldn’t have guessed that. That’s showing a little weakness to me. It isn’t anything to worry about yet, but it is something to monitor.
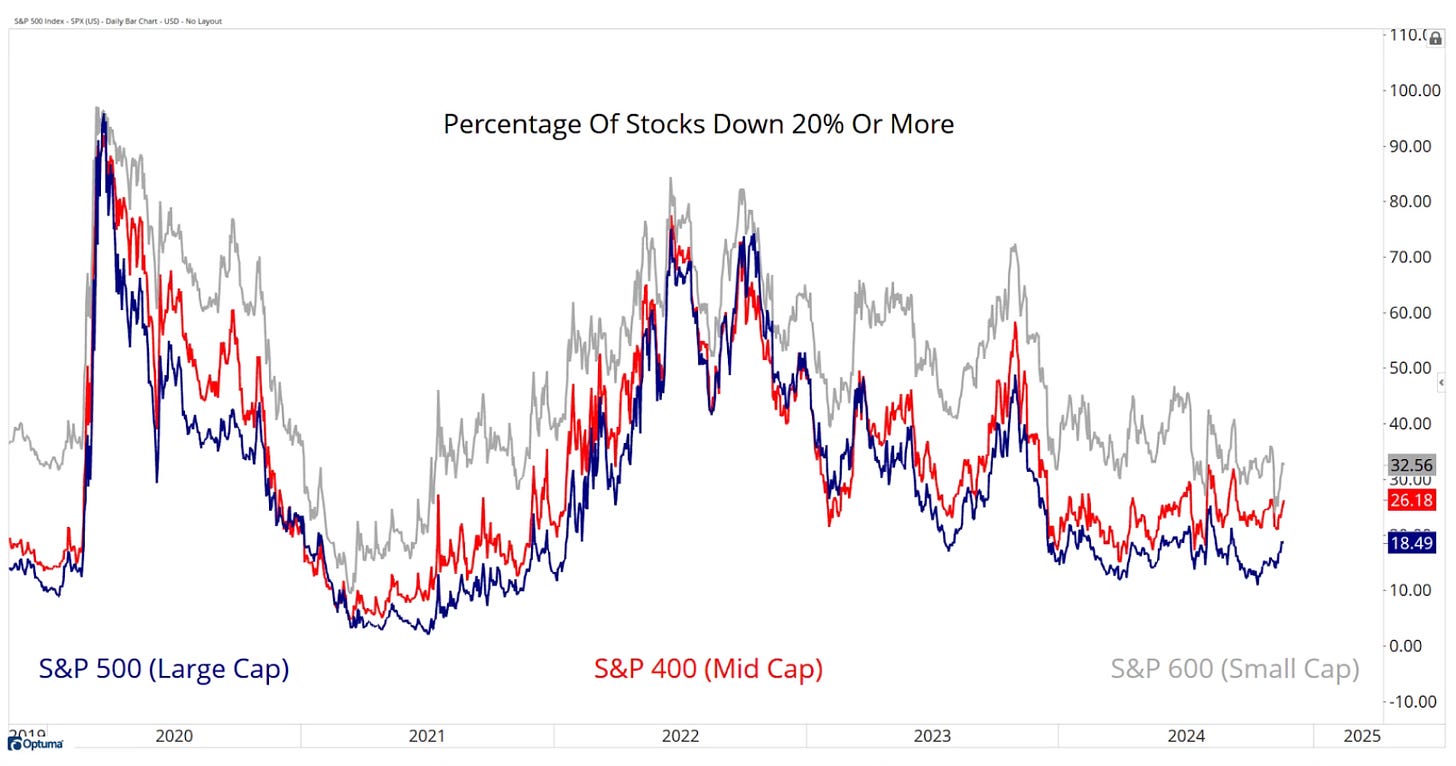
The percentage of stocks down 20% or more among large-caps, mid-caps and small-caps are at multi-year lows. As these remain low, the bullishness will rage on.
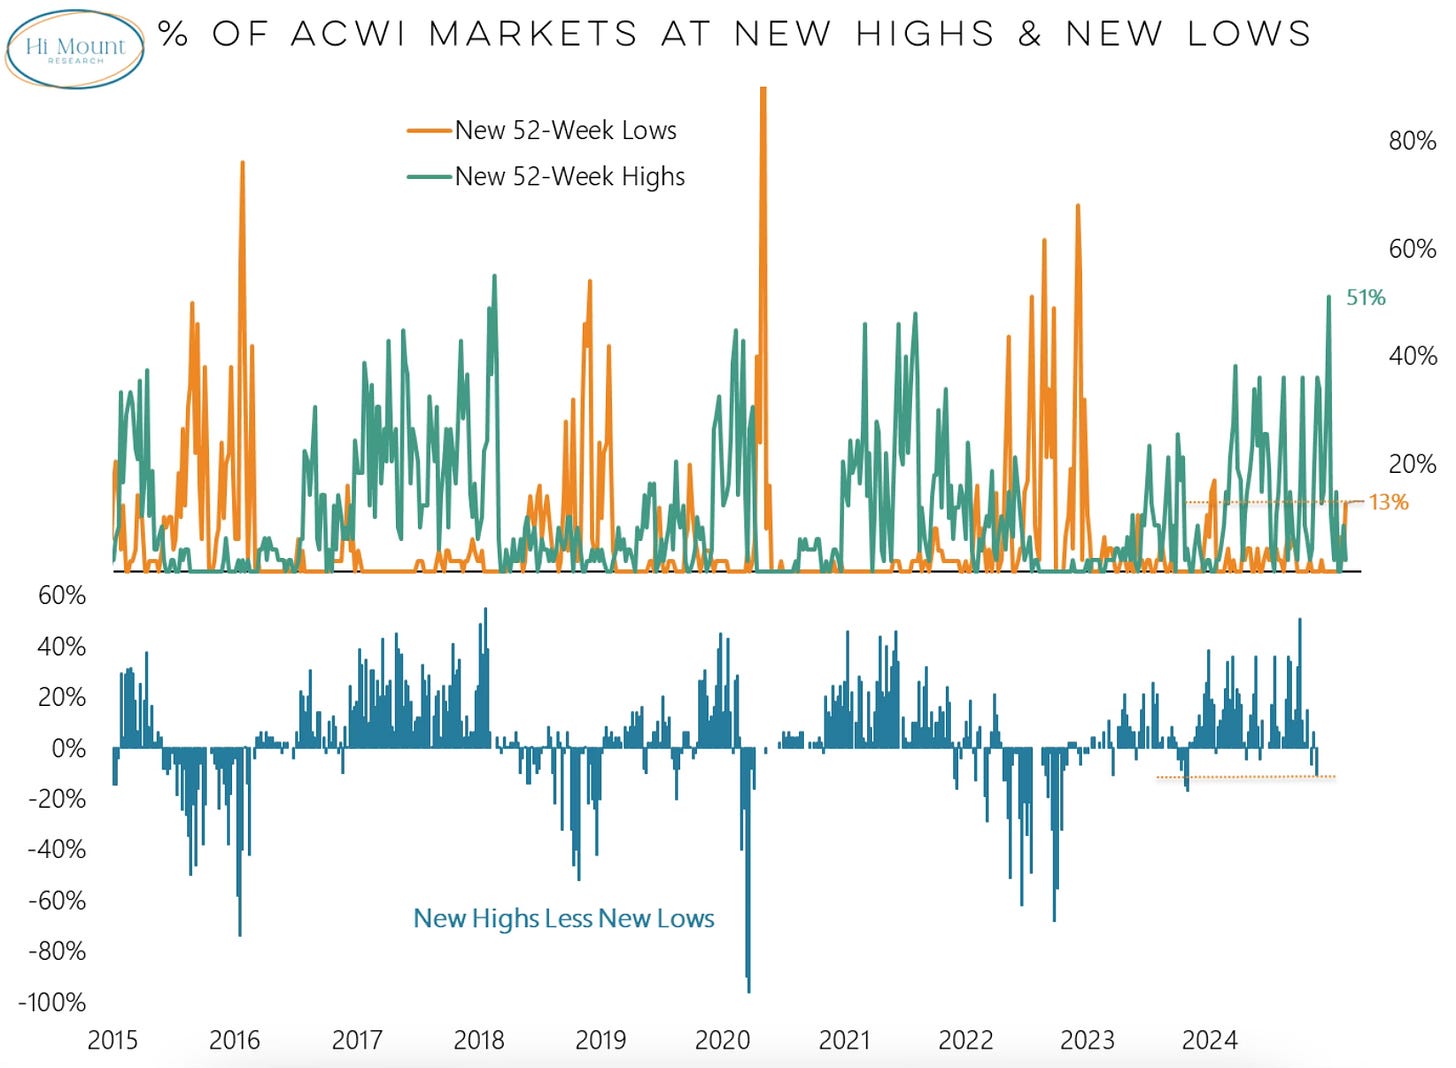
The number of markets hitting new lows actually reached the highest levels of the year. The under the hood data is starting to show some unexpected change as investors are expecting a year-end rally.
