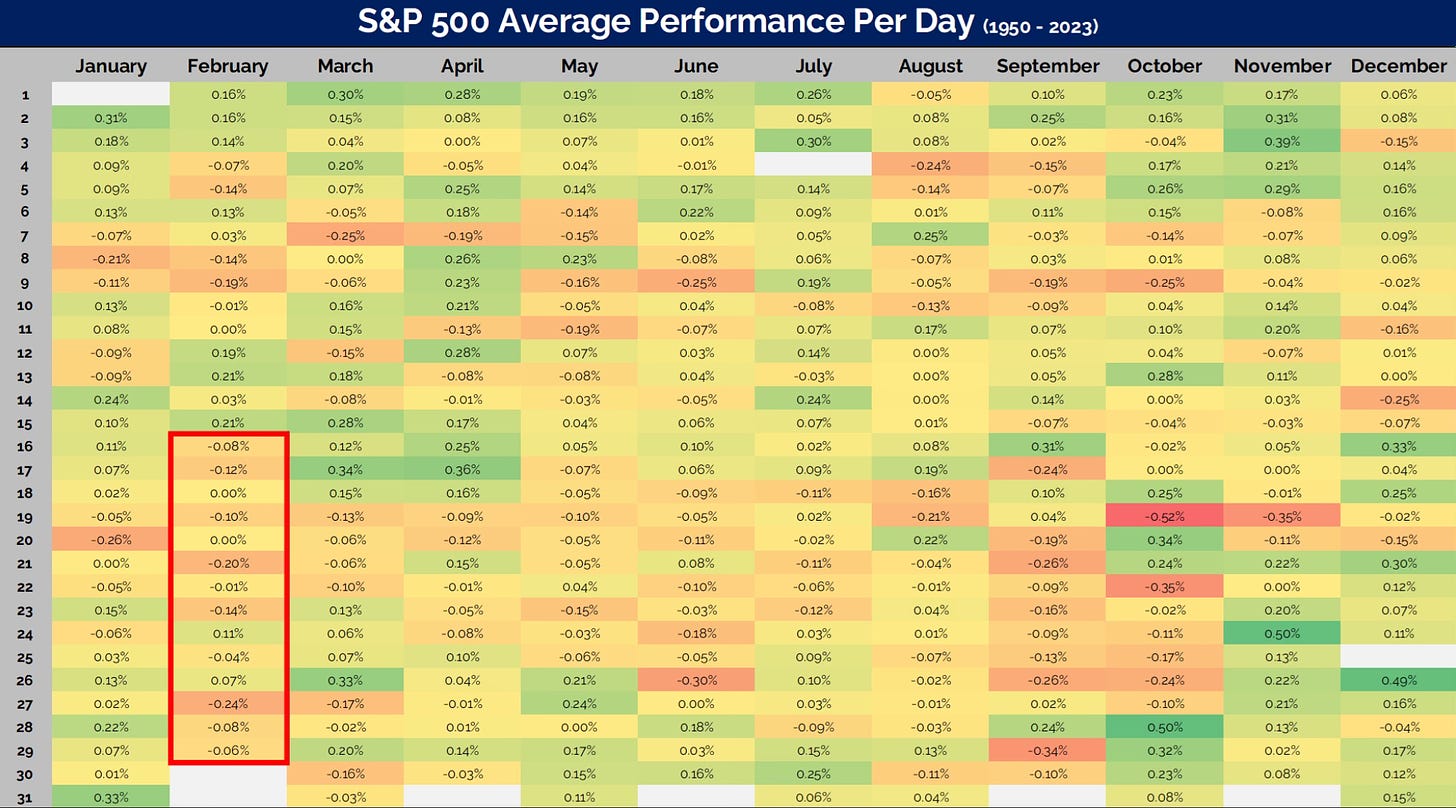
Historically we have seen mid-February and even into early March perform rather poorly. This chart shows what the S&P 500 has done in Februarys going back to 1950.
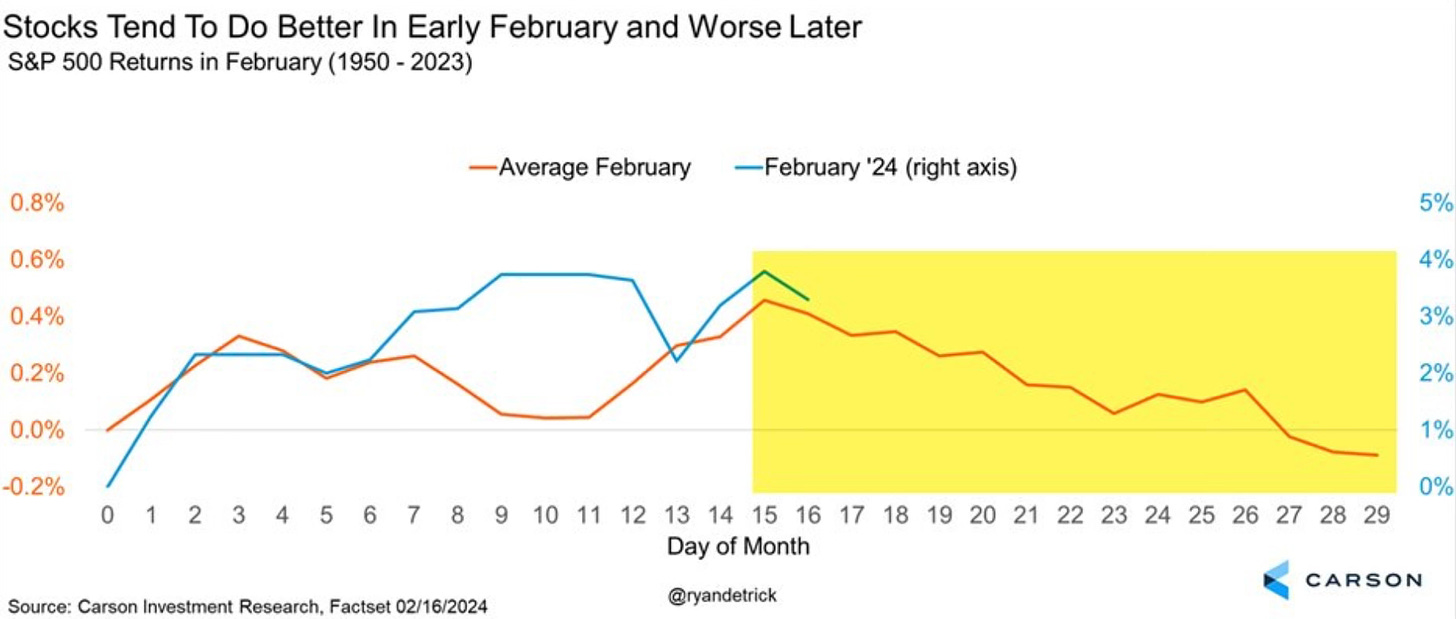
Here is a daily breakdown chart of the S&P 500 average performance per day and you can see just how weak late February into early March usually is.
That script and trajectory was flipped Wednesday after the bell this week when Nvidia reported earnings. Nvidia pulled the entire market higher on Thursday.
All three of the major indices finished Thursday at new all-time highs. Here is what they did on Thursday.
Dow 1.1%
S&P 500 2.1%
Nasdaq 2.9%
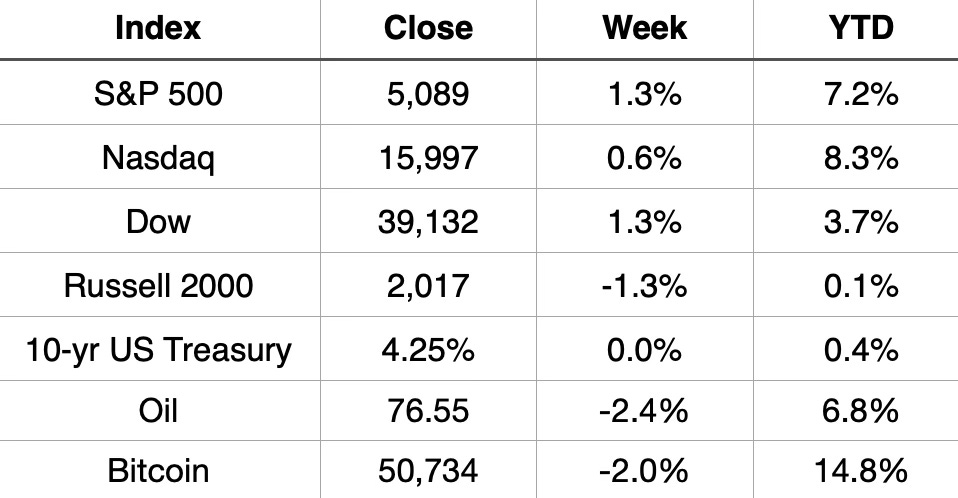
The S&P 500 had its best day in 13 months, while the Nasdaq had its best day in a year. Putting the S&P 500 up 7.2% YTD and the Nasdaq up 8.3% YTD. All the indices ended the week sitting at new all-time highs. What a start to 2024!
Market Recap
The Nvidia Run Continues
Nvidia’s earnings blew the top off yet again. This time it even moved the entire market significantly higher. If you still needed any further proof that Nvidia is now the key to the market and not Apple, look at what the overall market did in reaction to Nvidia’s blowout earnings. As Nvidia goes, so does the market
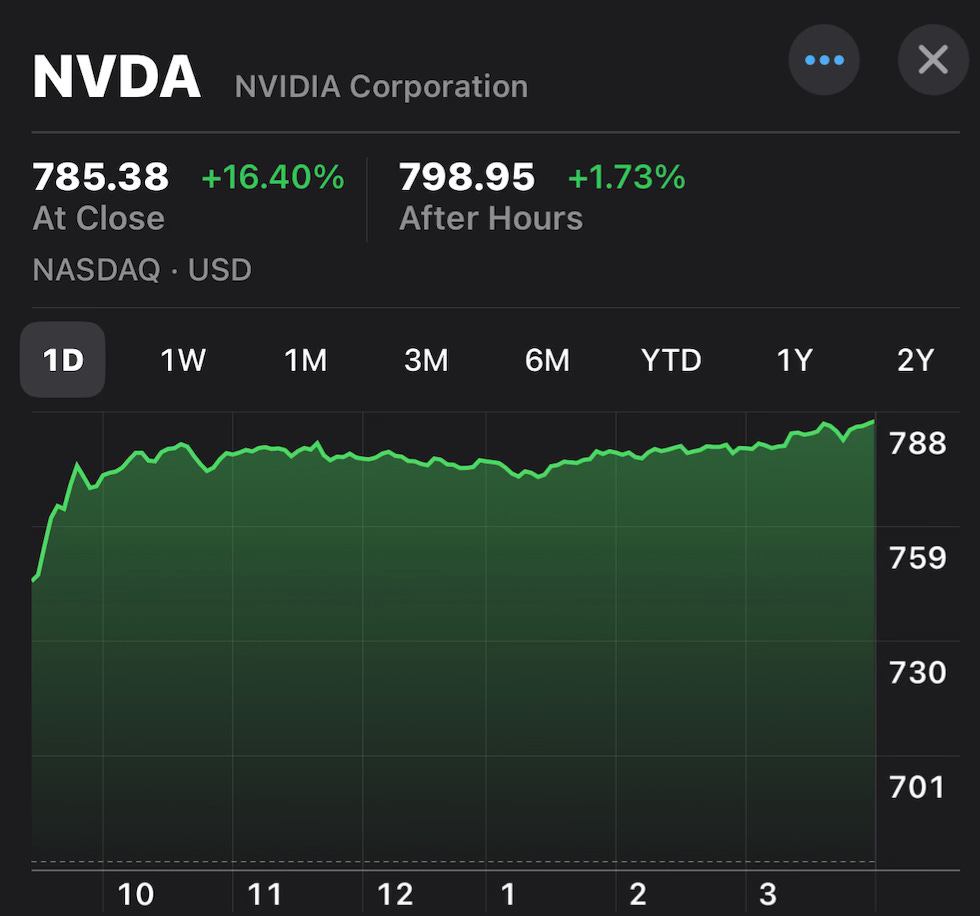
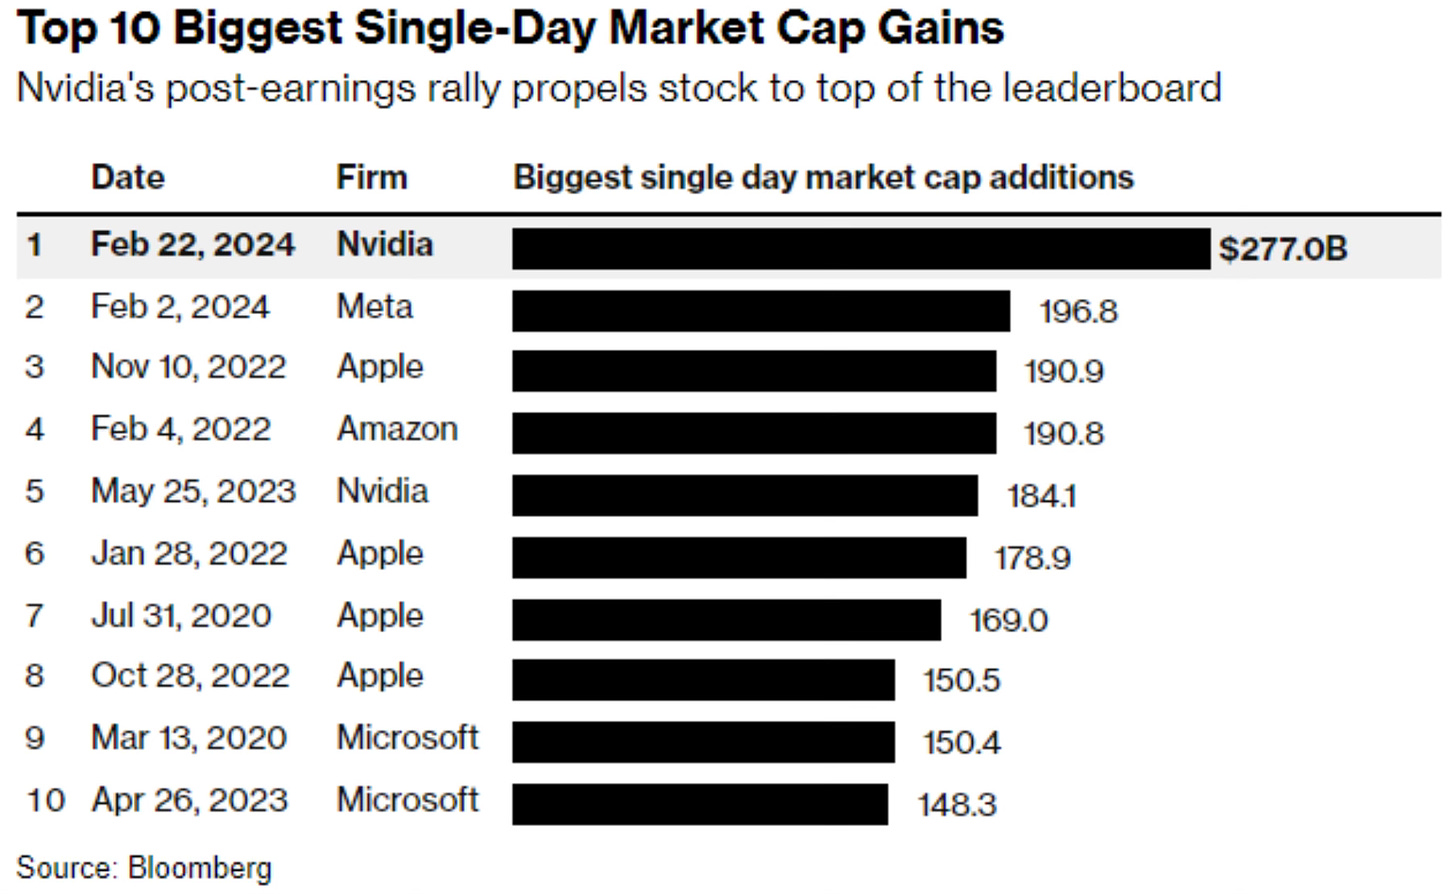
Nvidia finished the day Thursday up over 16%.
It gained $277 billion in market cap in one day! That’s the entire market value of Netflix ($253 billion) and Coca-Cola ($264 billion). In that one day, what it added in market cap would have made it the 33rd most valuable company in the world. That’s just astonishing to me.
That proved to be the greatest single-day gain for a company in market history.
Here are the breakdown of its Q4 income statement from its earnings results. I love this visual that
does on companies.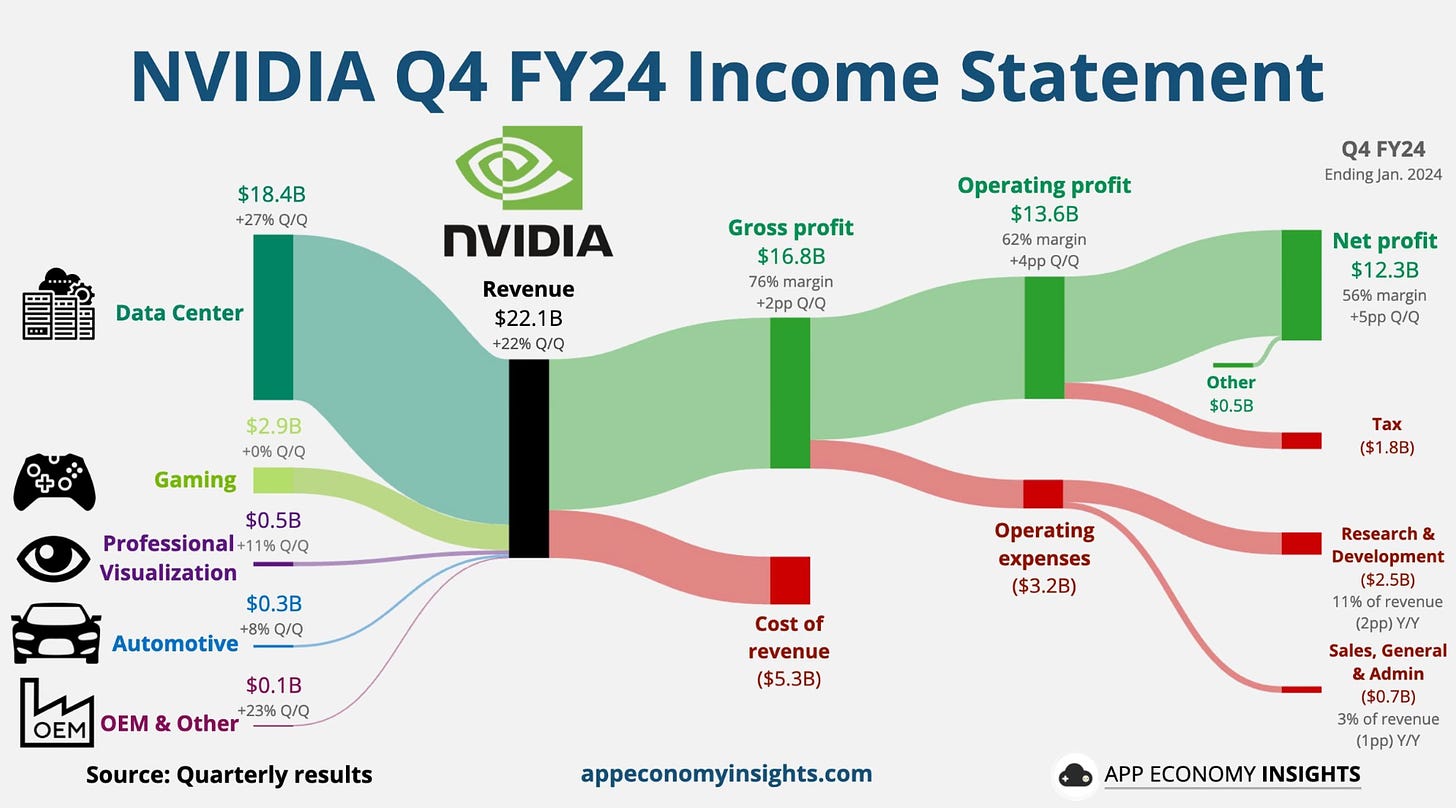
Then this is the specific breakdown that
did on Nvidia’s earnings. I also love these company earnings breakdowns that Brad does. @bestinterest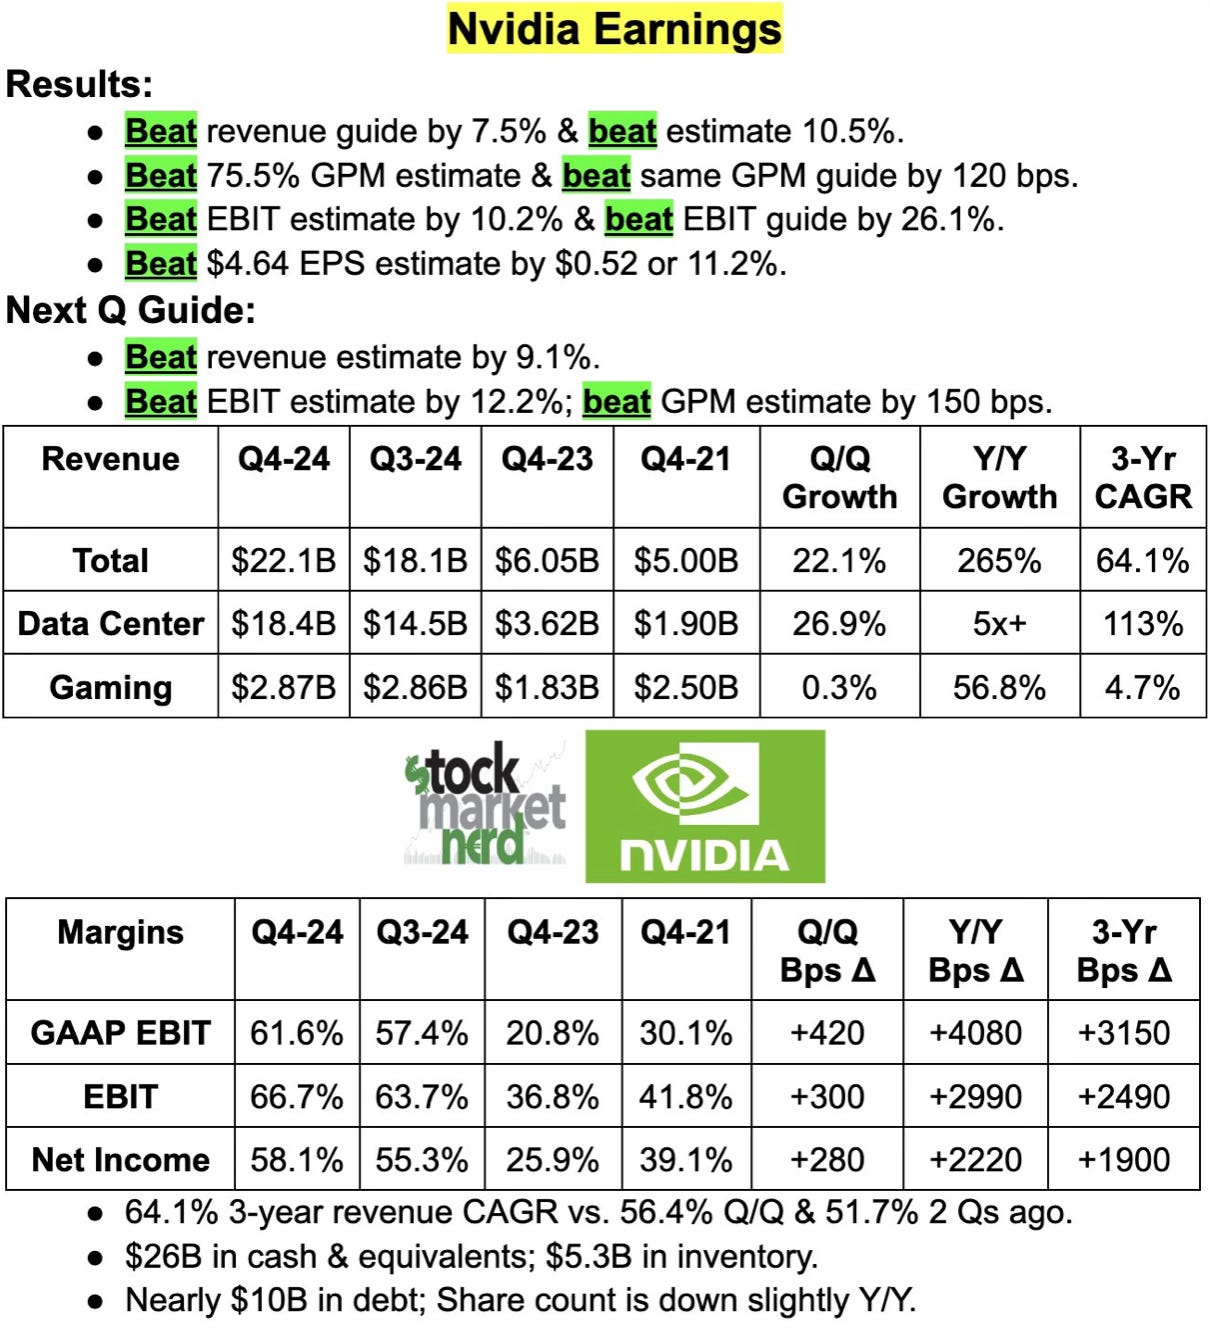
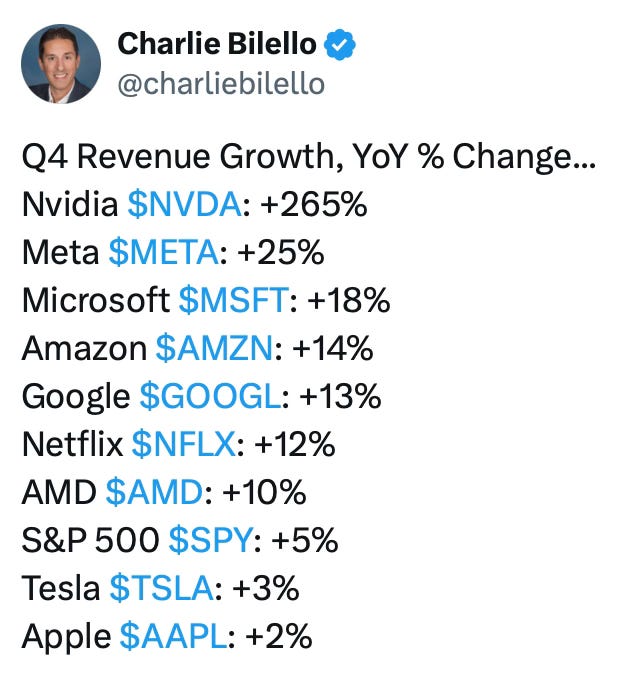
I think the most jaw dropping figure from Nvidia’s earnings is their Q4 revenue growth. YoY it was up 265%! That number is just unbelievable. When I read that, I actually had to go to multiple other spots to verify it was accurate.
And it’s a similar story with earnings growth. Just in a class by itself compared to the other Magnificent 7 names.
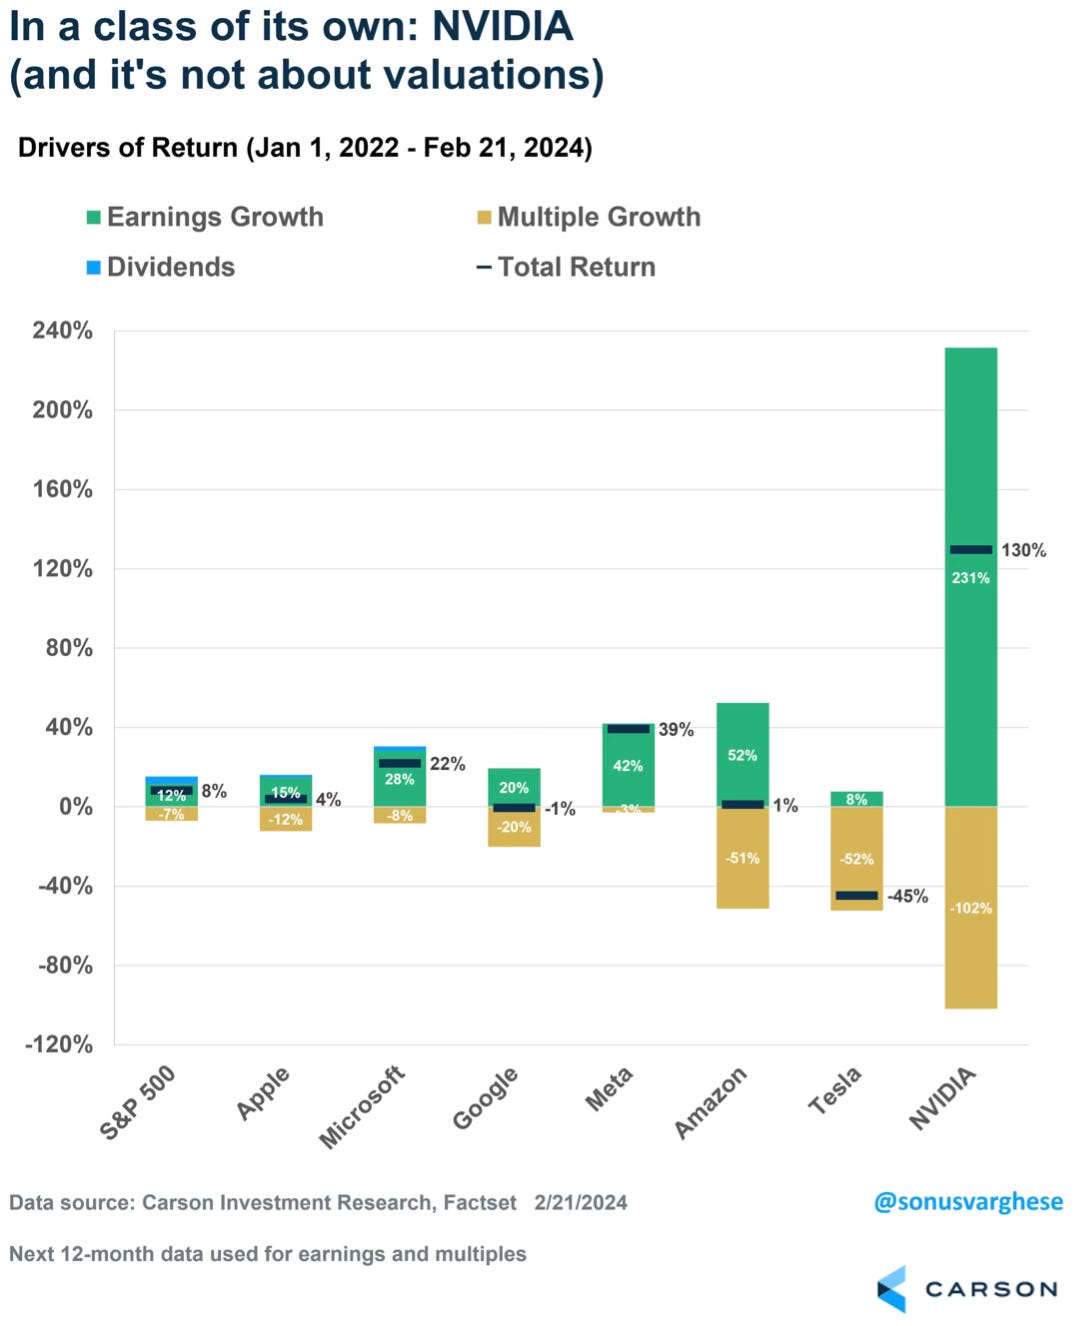
Everyone keeps wondering how long this can continue for Nvidia. It’s a great question. With earnings like this it could go on for a while.
I discussed Nvidia and my position in it a week ago on February 14th in my post called The Nvidia Surge. Here is a clip of what I said leading up to this week’s earnings.
I may be getting a little greedy but in my opinion other than the price appreciating so much, I don’t have reason enough to even trim my position. I look back at what I’ve done with my other early big stock winners as an early investor in Apple and Amazon. Those positions I also didn’t sell off. I still own them today.
You can scour the internet for both bullish and bearish content on Nvidia. Just as you can with any stock. The bottom line is Nvidia has been crushing it with results for some time now. Yes, the euphoria around AI may be overblown. But what if it isn’t? If Nvidia continues to produce and reward investors this run can very well continue.
Have your own conviction and come to your own conclusions when you’re an investor and own stocks. Make your own decisions and don’t base them off what people on TV or so called “experts” say you should do. It’s your money and your decisions.
Continued Market Strength
As we continue to hit new highs, it’s important to see if the underlying factors continue to support a climb higher. So far things continue to show a lot of strength.
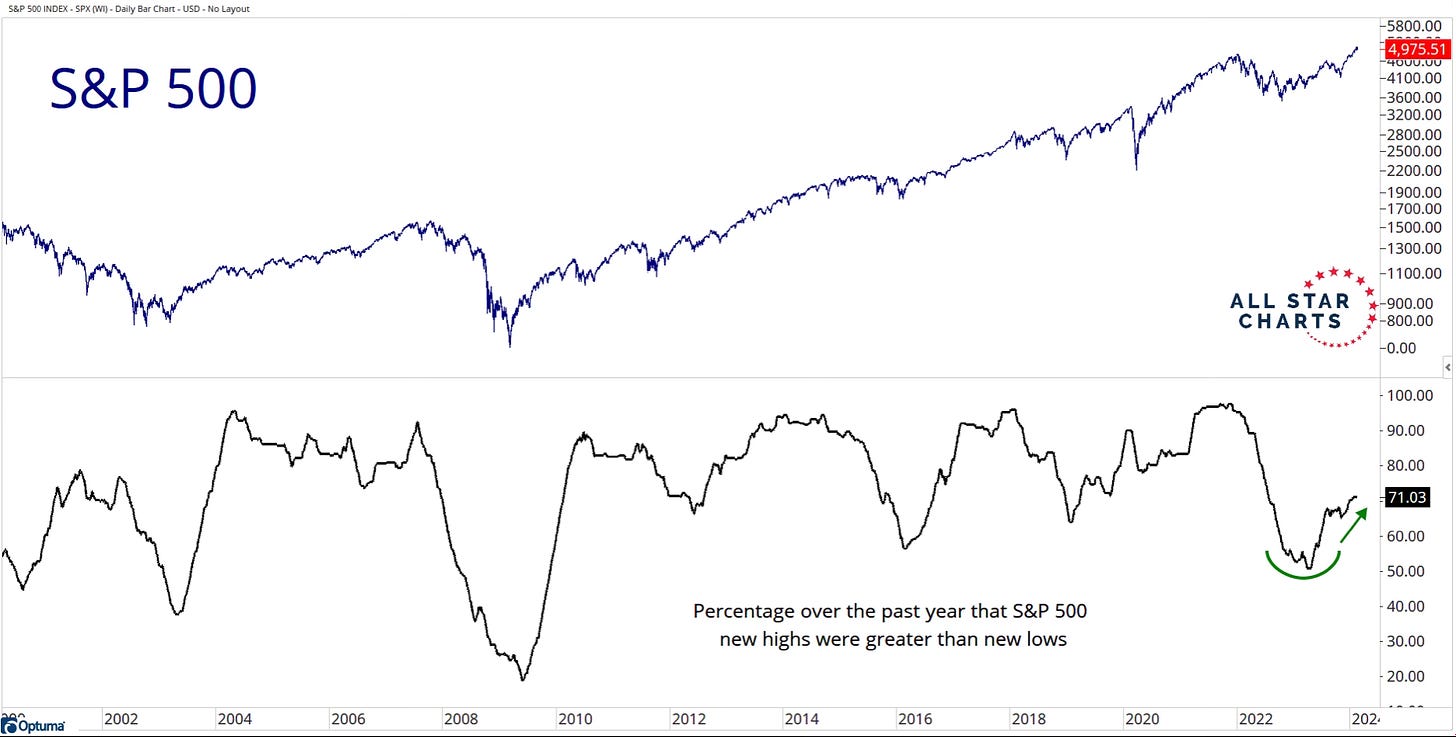
Over the past year the S&P 500 new highs have been greater than the new lows 71% of the time. That’s the highest level since July 2022.
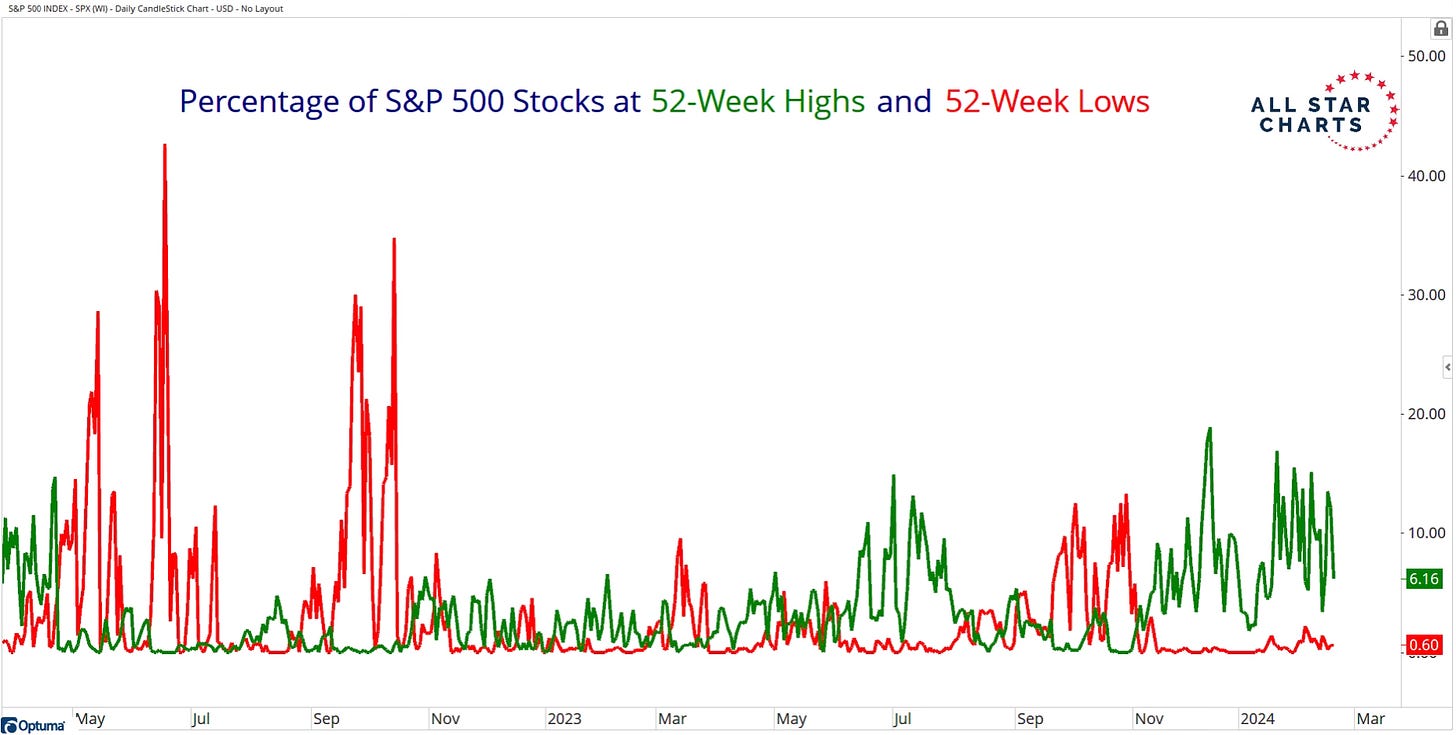
The 52-week highs continue to dominate the 52-week lows. It hasn’t been close for months now. In fact, in the last two weeks over 33% of S&P 500 stocks have hit a new 52-week high.
You simply can’t have a correction or pullback of any kind when stocks are going up. They aren’t going down in price and haven’t for a while now. Until that happens expect this market to continue higher.
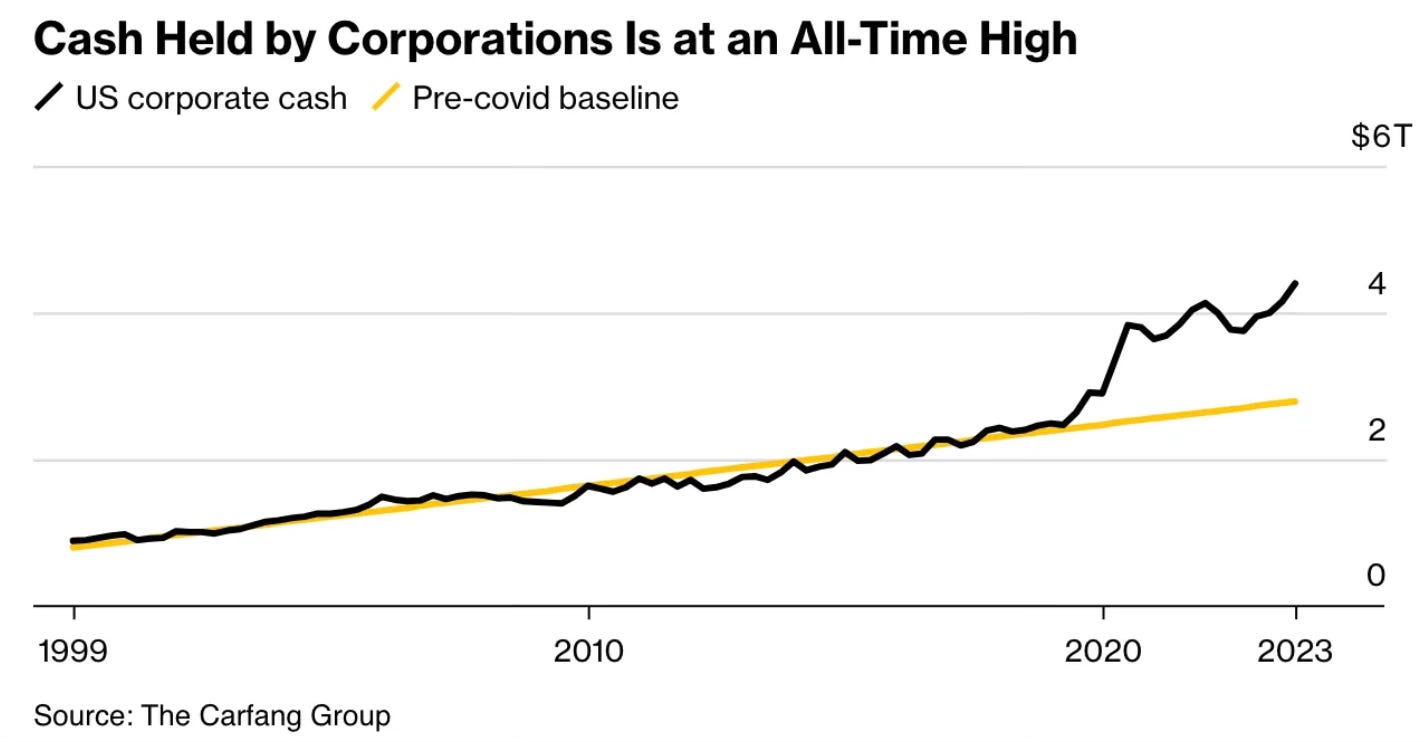
Another area that is overlooked is the amount of cash that is held by companies. It’s actually now at an all-time high. This is a reason that the raising of rates has had little impact on companies. Companies are flush with cash.
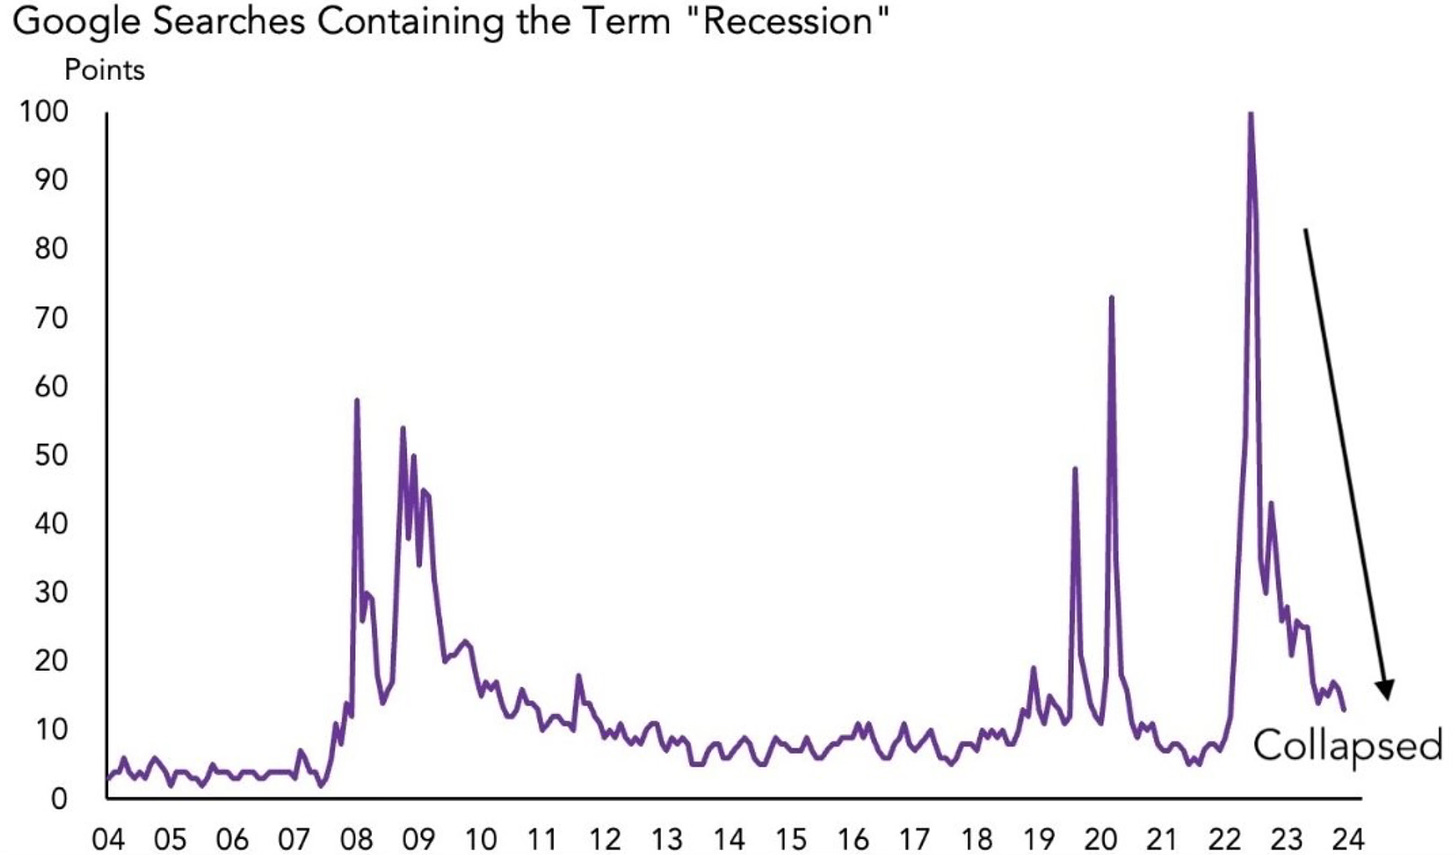
To understand sentiment on where things are, a good indicator of this is Google searches. The searched word that’s watched about the most is recession. And it has fallen off a cliff. After it seemed like that’s all anyone wanted to talk about not that long ago, now nobody seems to care. We will see how long this lasts.
Something Worth Watching
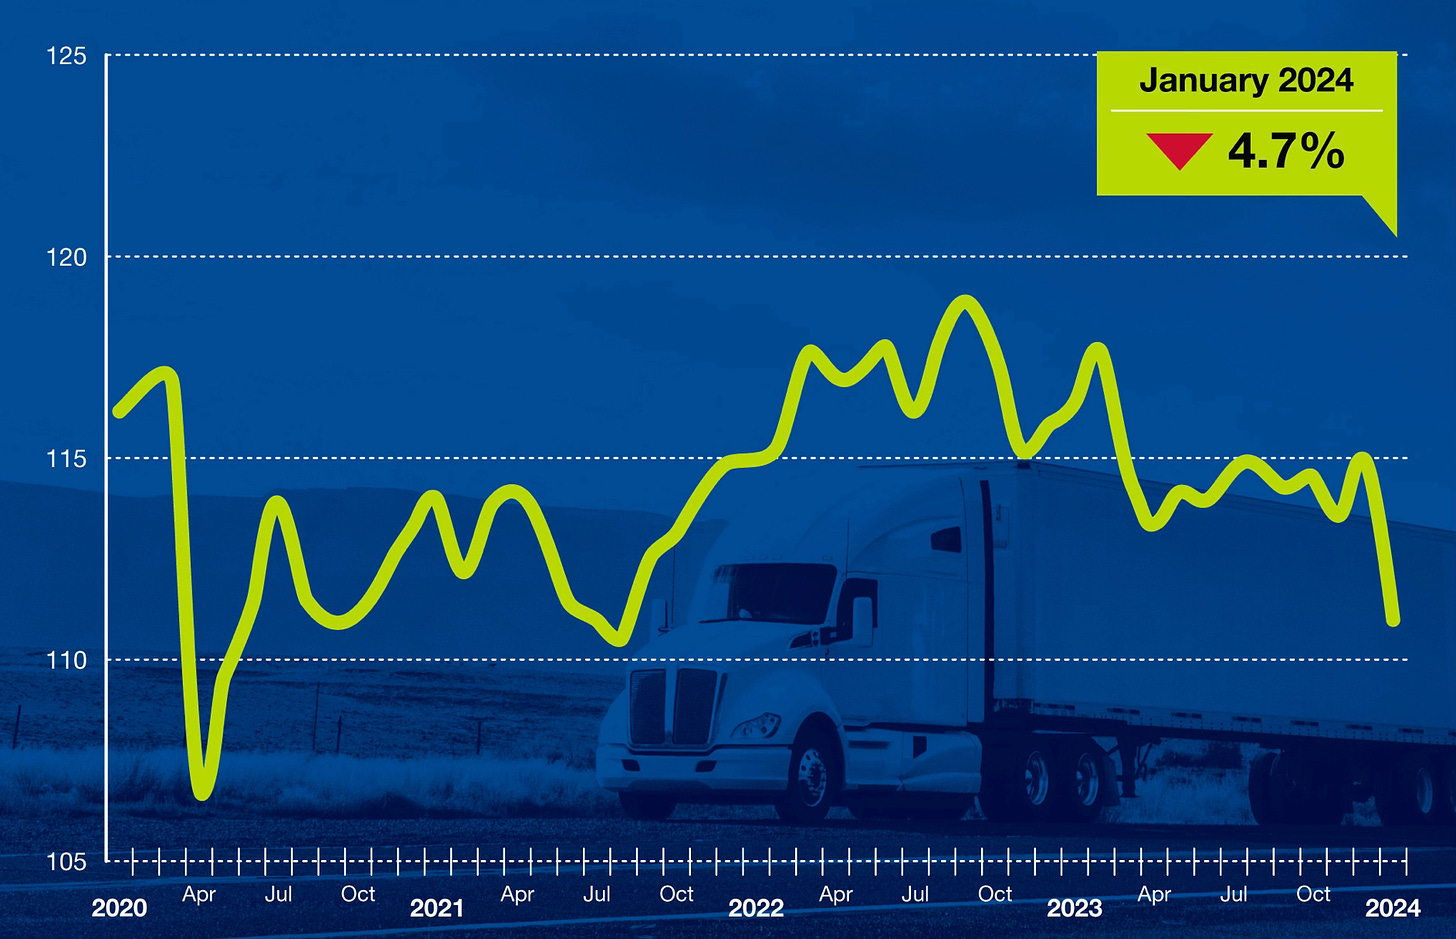
For all the positives in the economy and stock market that we continue to see, there was a reading this week that stuck out to me. That was the Truck Tonnage Index. This an index that measures the gross tonnage of freight that is transported by motor carriers in the US for a given month. Trucks account for almost 73% of US freight and this gives a good measurement of the US economy.
That reading for January showed a decrease of 3.5% month-over-month and a decrease of 4.7% year-over-year. That’s now 11 straight YoY declines.
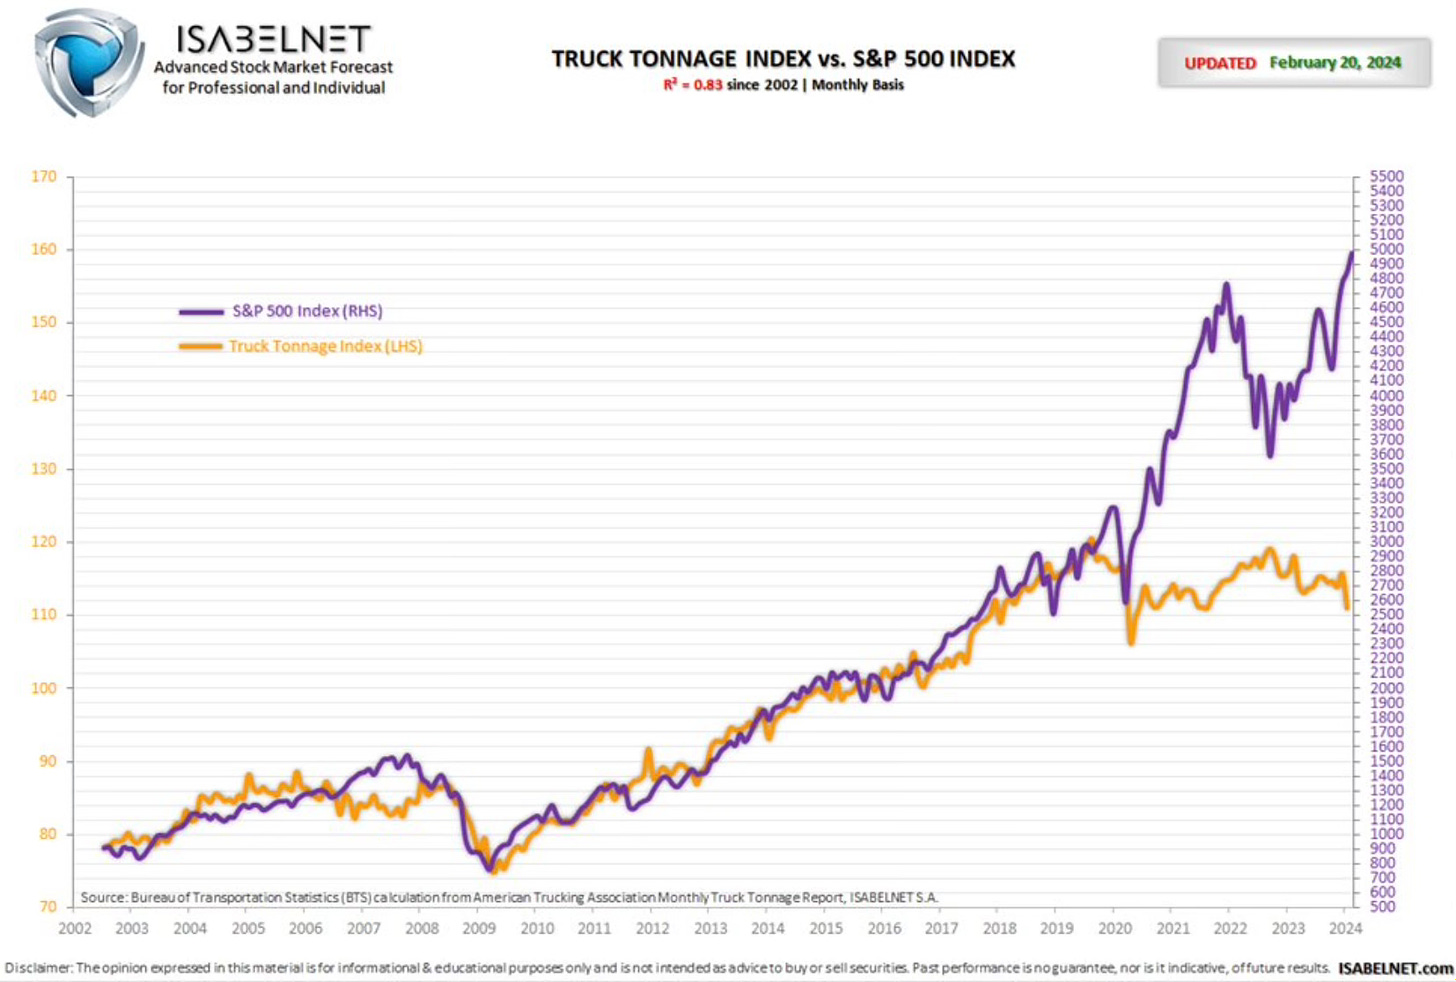
If you zoom out and look at it versus the S&P 500 you can see how it has gone in the opposite directions of late. We have to remember that the stock market is not the economy.
If we look at the trucking sector you can see the number of layoffs are up.
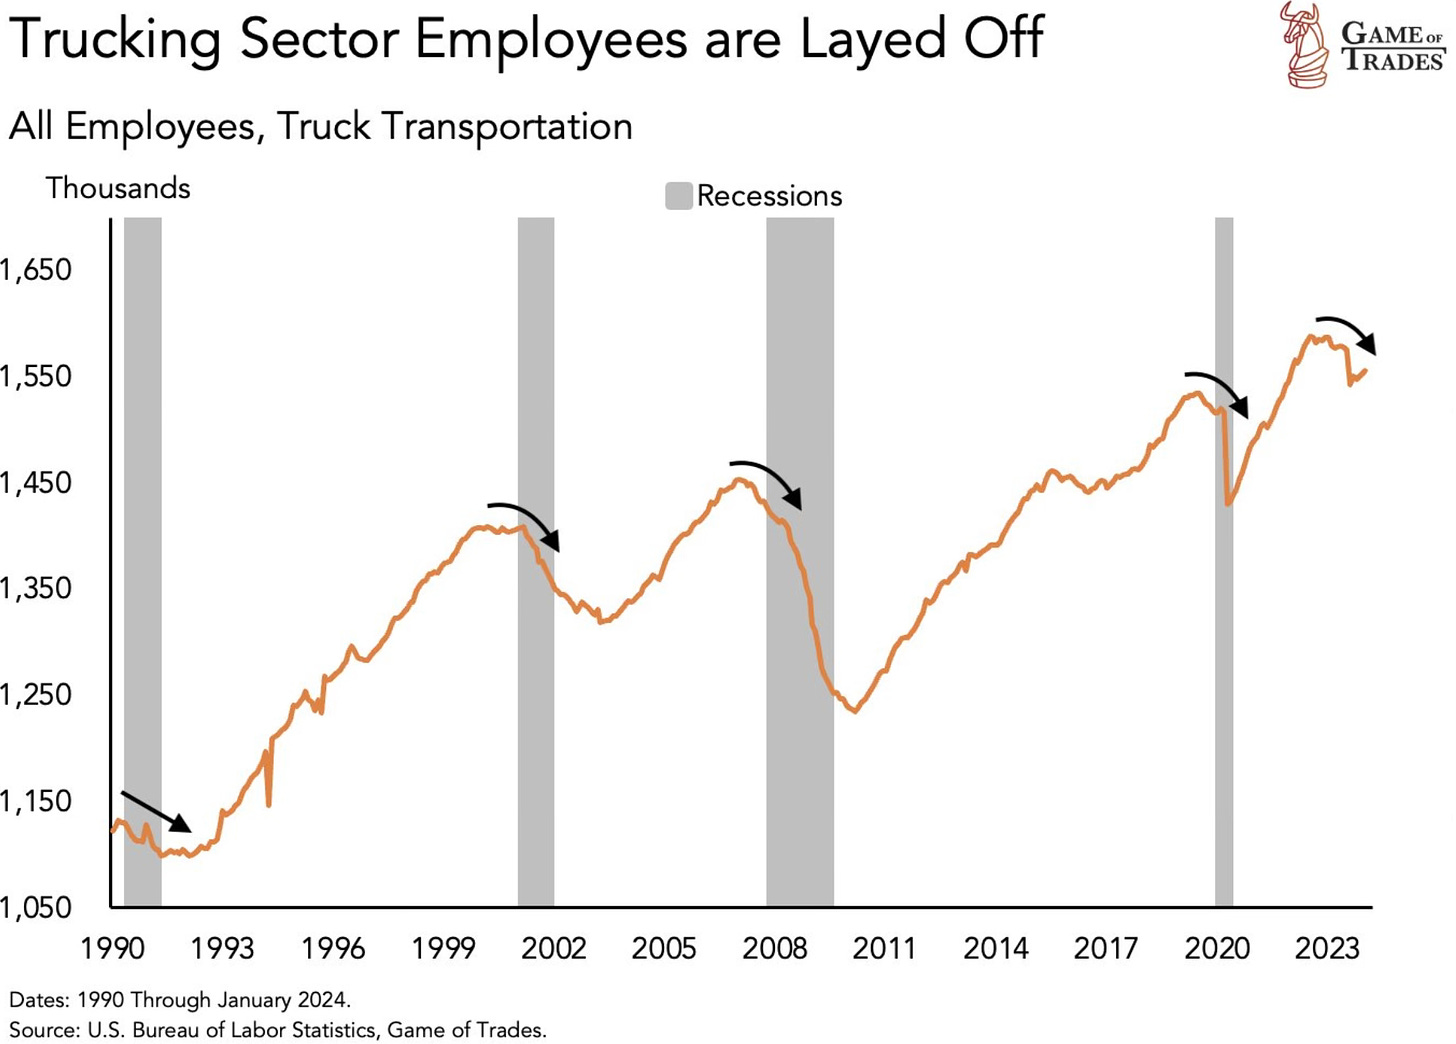
These will be one of the things to monitor moving ahead. If cracks start to form in the economy this is one of the areas that may show it first.
Hedge Funds Buys & Holdings
In reviewing hedge funds buys from the Q4 2023 13Fs, we can see that tech and the semiconductors sector were the most bought. A lot of high risky, high growth companies are starting to be bought again. Signaling more of an appetite for risk and growth.
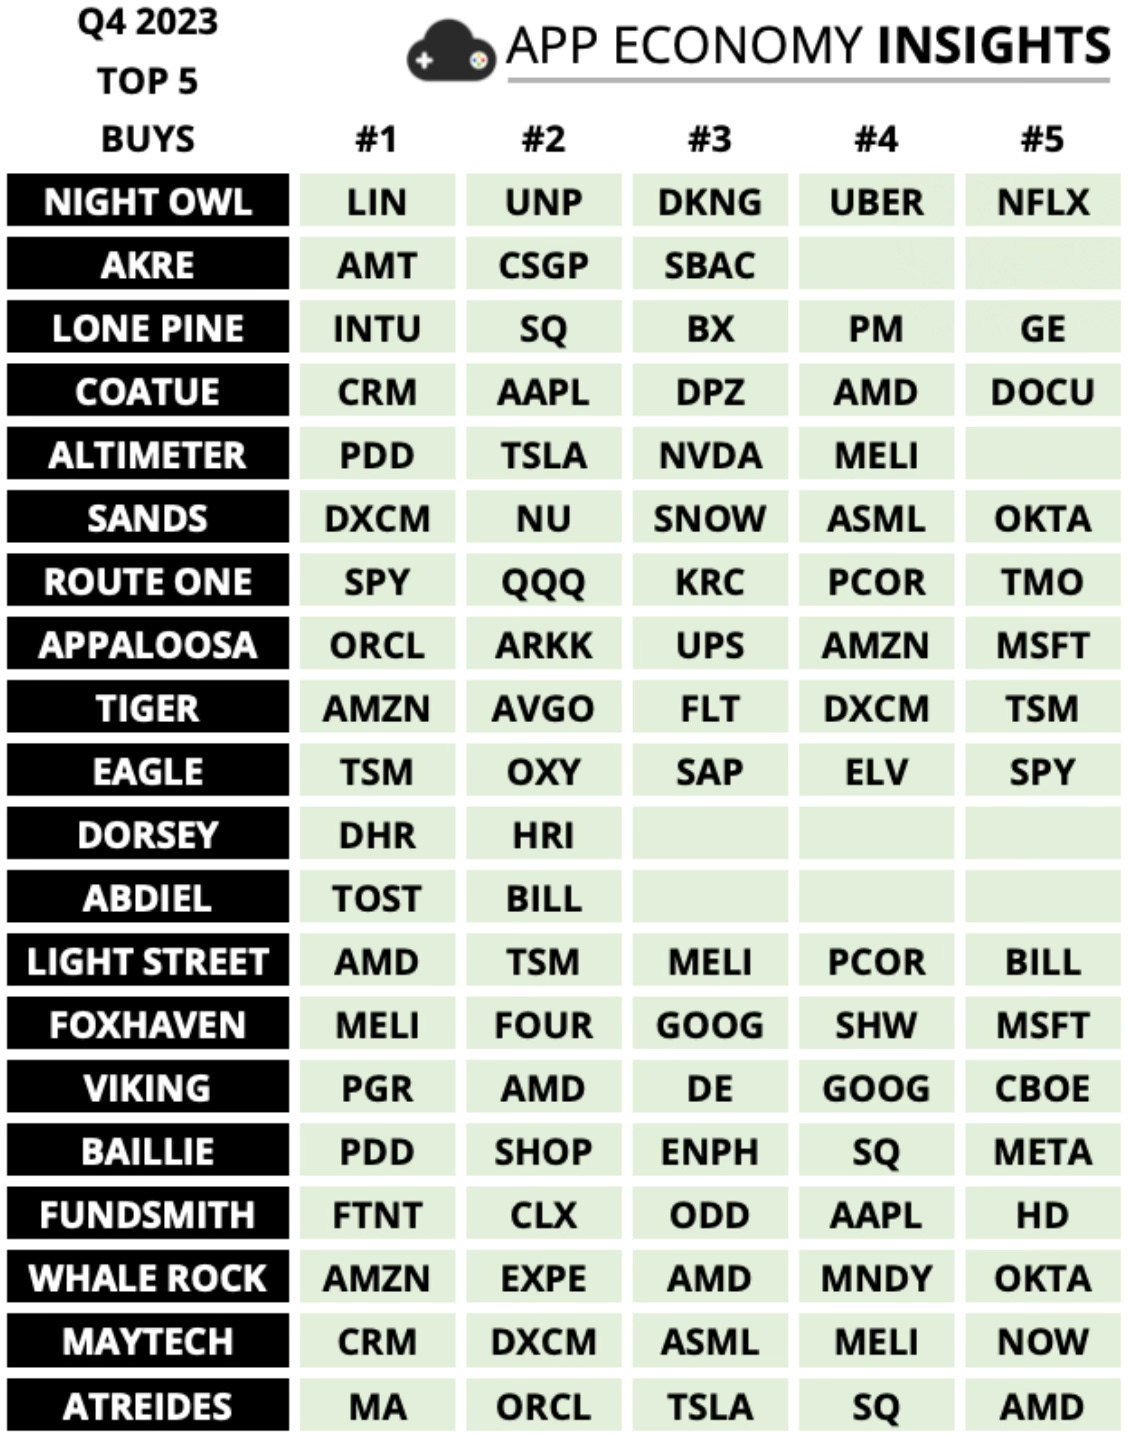
On the top 5 holdings side for these same hedge funds we can see the popularity of the Mag 7 stocks. I’m a bit surprised to see this heavy of concentration in all the Mag 7. Most of them have multiple of the 7 in their top 5 holdings. When I see this much in one area I start to wonder if the Mag 7 trade is getting stretched a bit.

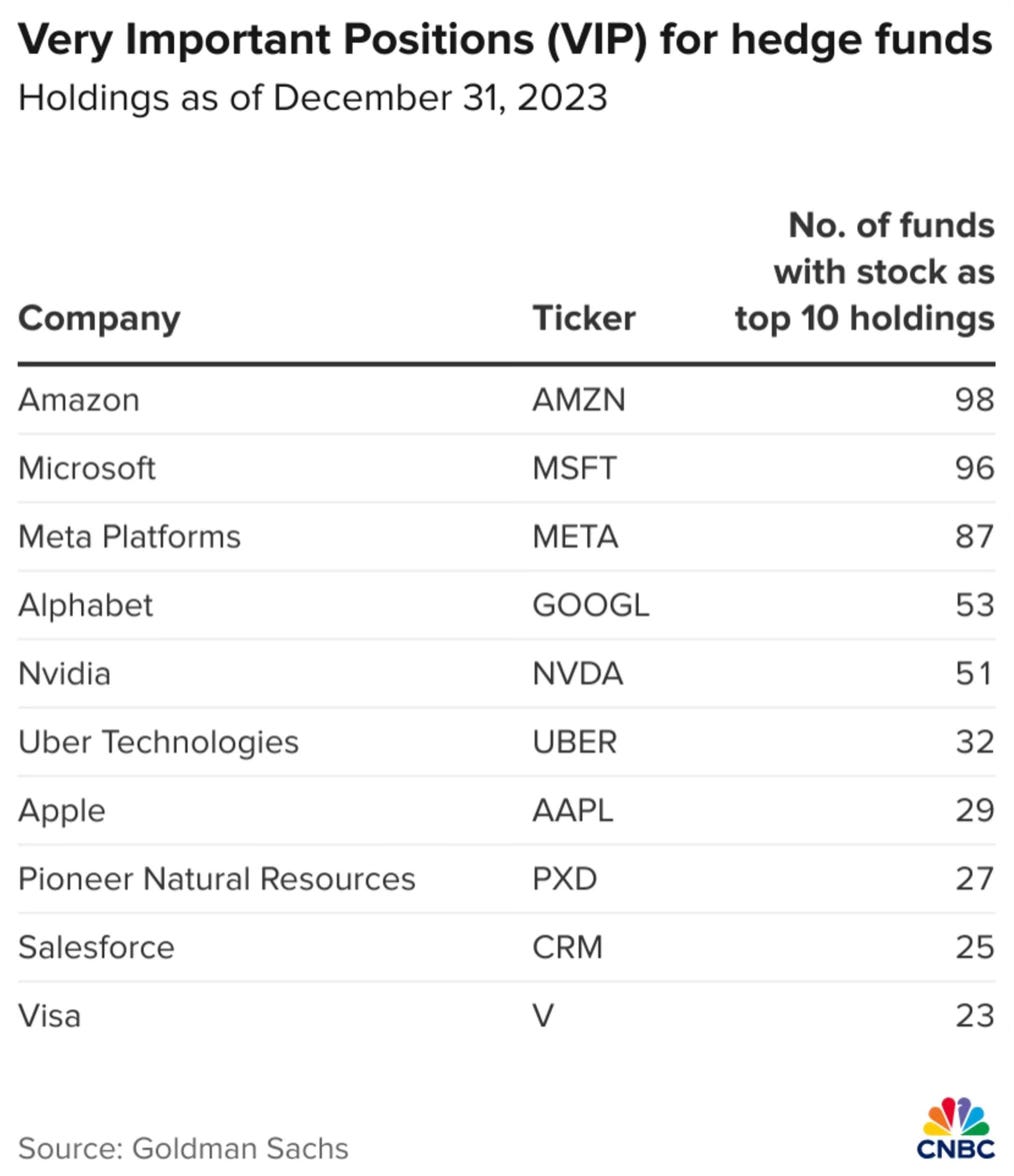
This chart shows the overall consensus of the hedge funds holdings. The number of funds with stocks in their top 10 holdings is led by Amazon, Microsoft, Meta, Alphabet and Nvidia. Uber and Pioneer Resources being this widely held among top 10 holdings surprised me a bit.
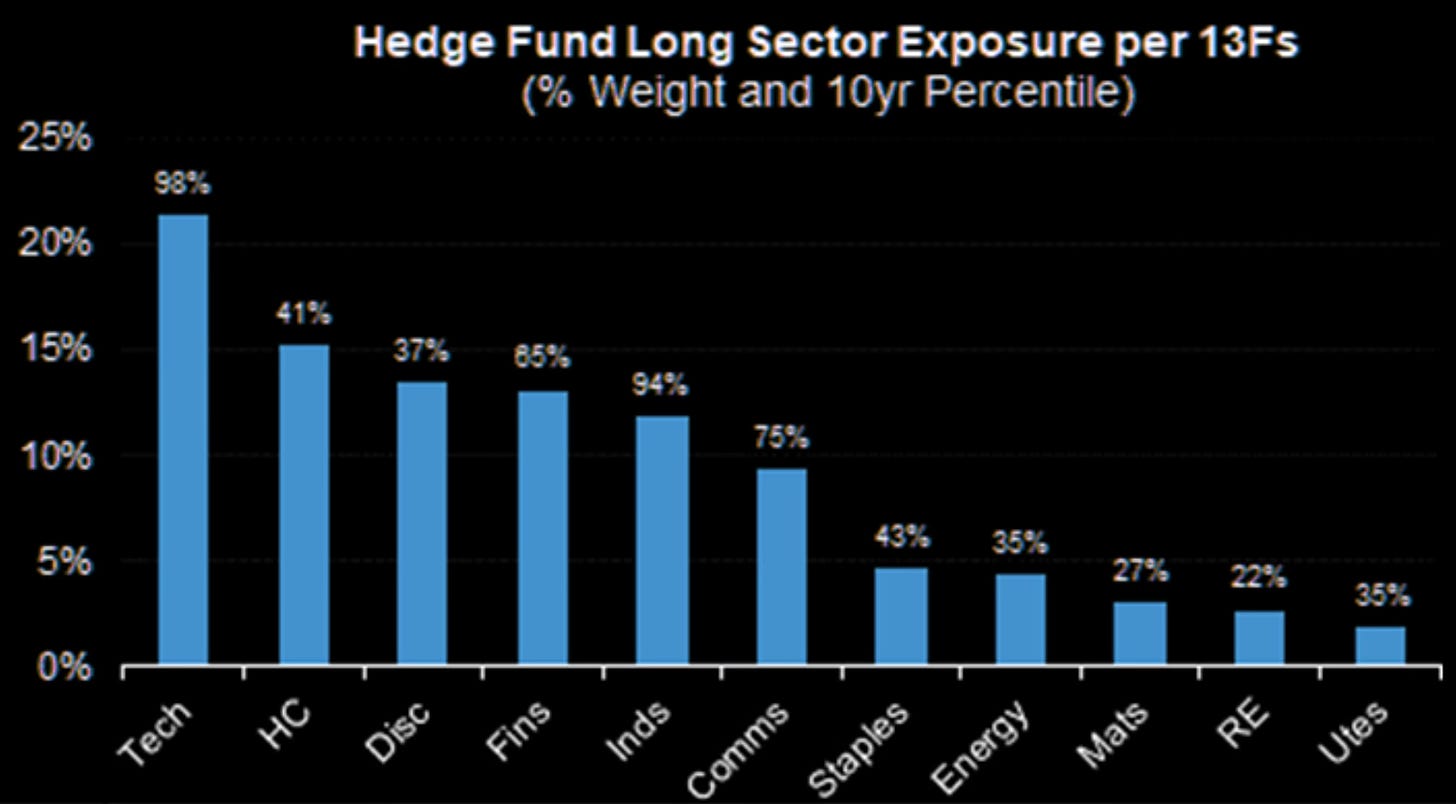
From a sector breakdown among hedge fund long positions we can see just how heavy they are into technology. They seem to be all-in on the technology trade moving forward.
Here is a breakdown of stocks that represent the largest short positions among hedge funds. Tesla is no surprise but the next two stocks were a surprise to me, Exxon and Chevron.

The Coffee Table ☕
Drew Dickson wrote one of the the most informative posts I’ve read in months called Pods, Passive Flows and Punters He shows how a company’s earnings over time correlate to their rise in stock price. For instance, Nvidia which in the past 5 years is up 1,700% as the earnings are up about the same 1,700%. Meta over the past 7 years is up 260% while earnings are up 280%. Google over the past 14 years is up 980% and earnings are up 885%. He breaks down a number of tech stocks and shows just how closely over time their stock performance tracks their earnings.
I’ve read a number of articles and posts regarding Roth IRA conversions. This one by Jesse Cramer Should You Consider Roth Conversions? is one of the best and most informative I have read on the topic.
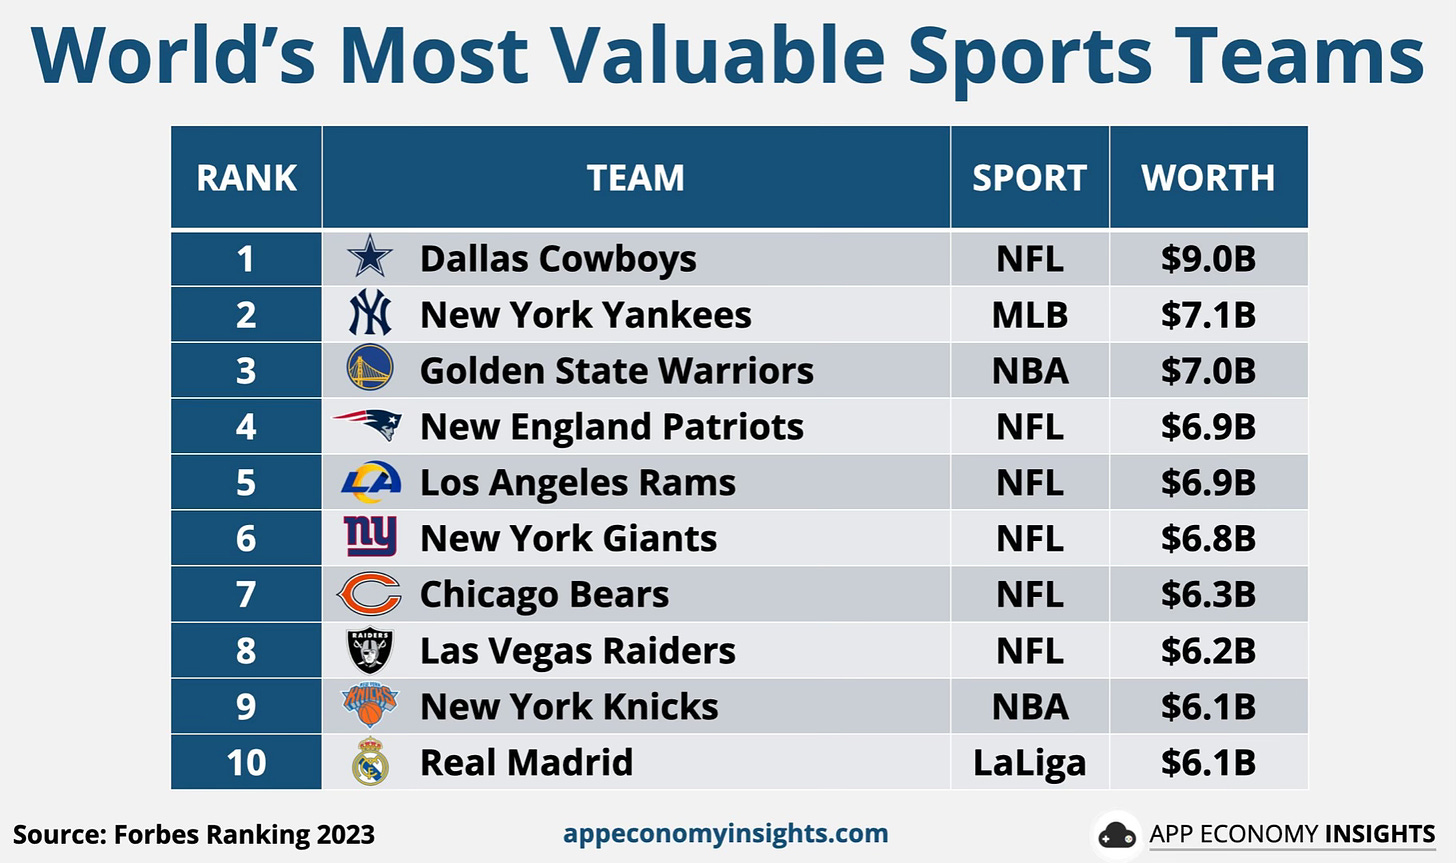
This was an interesting chart to see the world’s most valuable sports franchises. There are some teams on this list that surprised me and some teams that I thought would be on the list.
Thank you for reading! If you enjoyed Spilled Coffee, please subscribe.
Spilled Coffee grows through word of mouth. Please consider sharing this post with someone who might appreciate it.
Order my book, Two-Way Street below.


