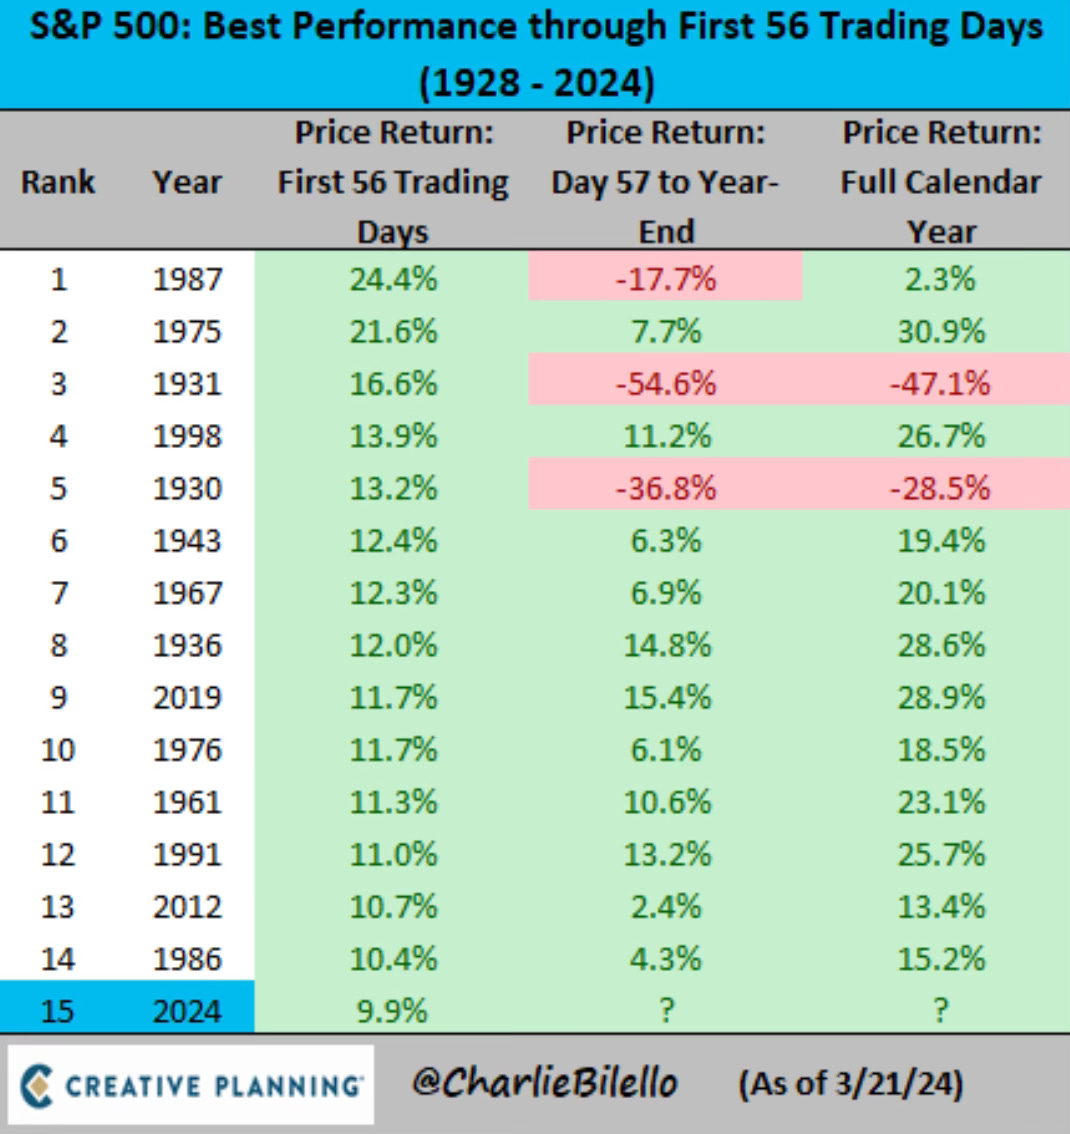
This week was the biggest week of the year for the S&P 500 finishing up 1.2%. It was another week of more all-time highs. 2024 is now off to the 15th best start since 1928.
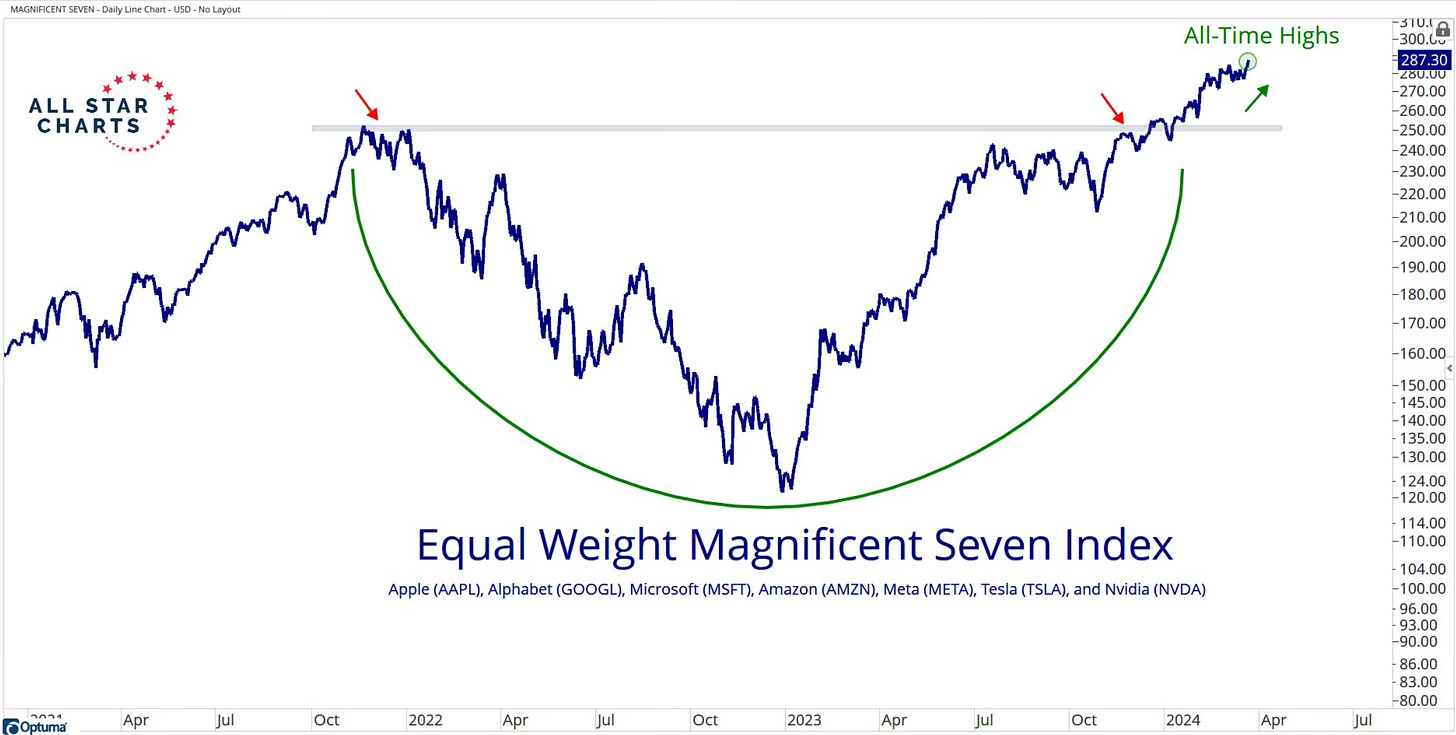
The Magnificent 7 index also hit a new all-time high.
What’s surprising is the Mag 7 still keep climbing without the participation of Apple and Tesla. They’re both still down on the year.
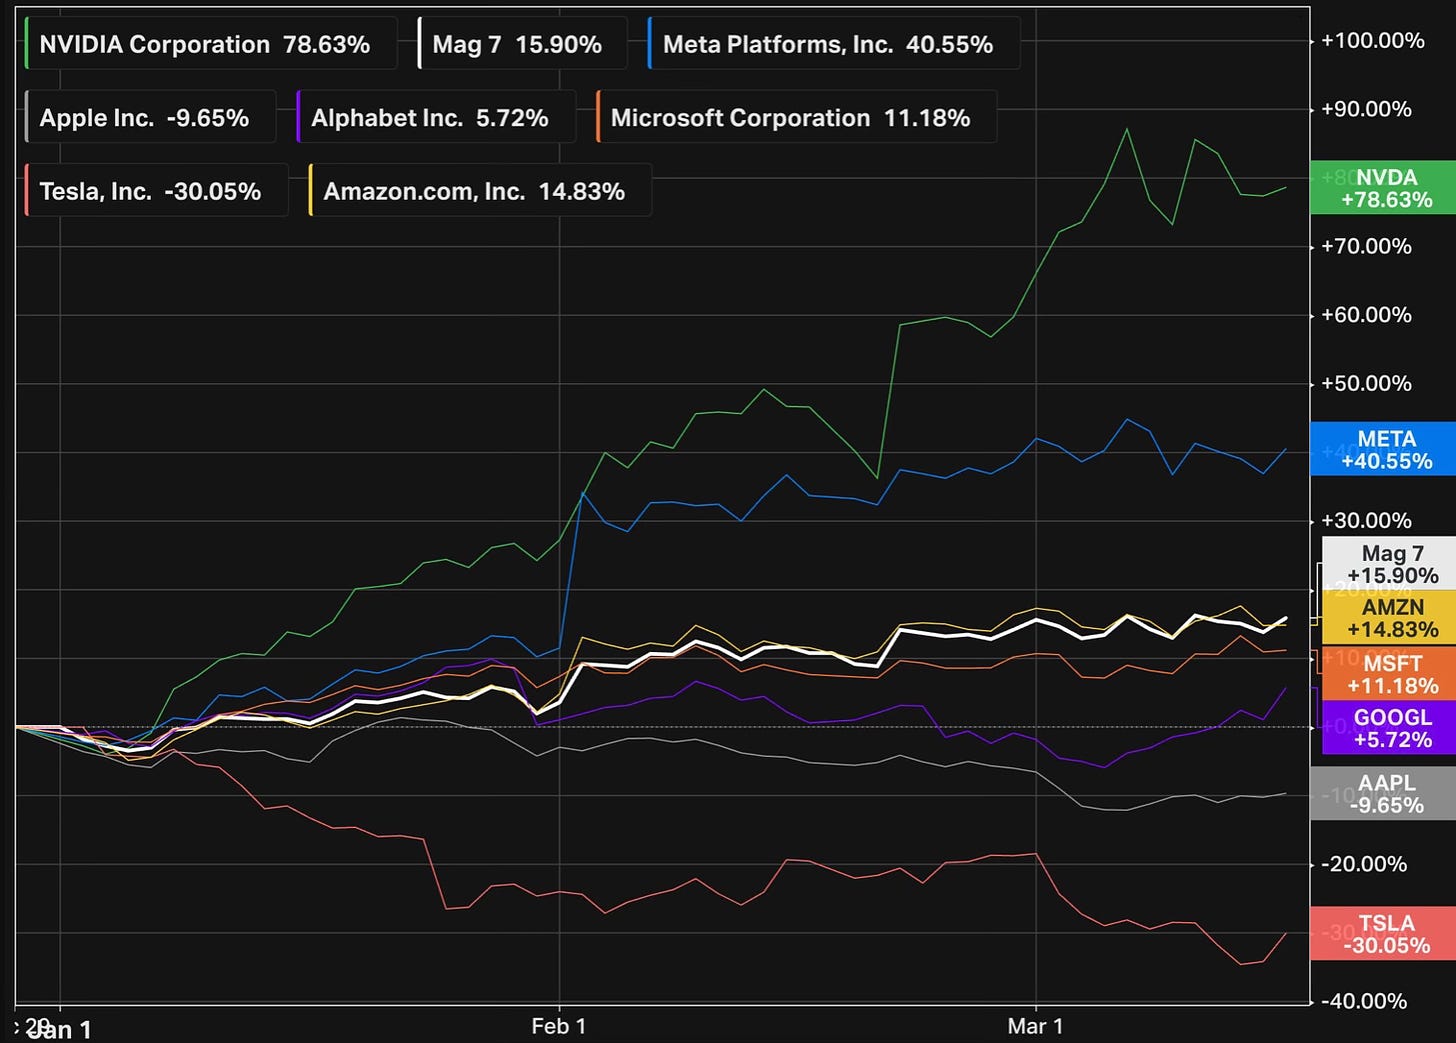
Nvidia set a record this week with its 11th straight positive week. That’s the best streak in its history.

It’s going to be hard for the stock market to fall if the hottest stock Nvidia and the Mag 7 index continue setting new highs and just refusing to go down. If we try to look for bearish signals you have to look awfully hard.
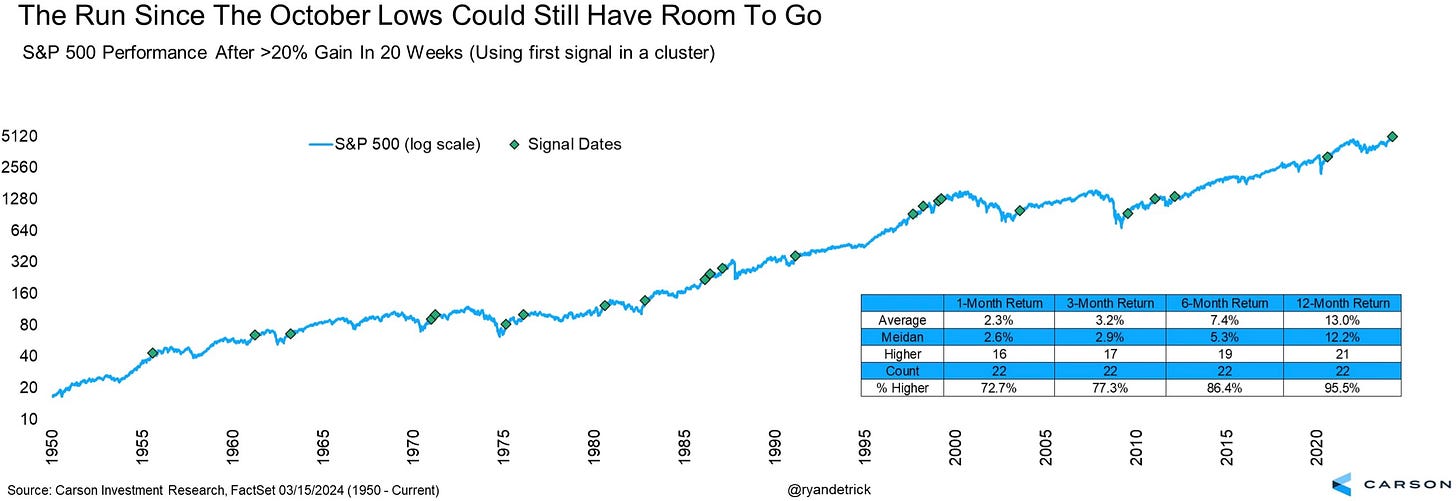
Yes, the S&P 500 has been on a quite a run. Does history tell us this run is set to run out of steam or can it continue running higher? Ryan Detrick answered that question this week.
S&P 500 up 24% the past 20 weeks. I found 22 other times it was up 20% or more in 20 weeks (using the first signal in a cluster). One year later? Higher 21 times.
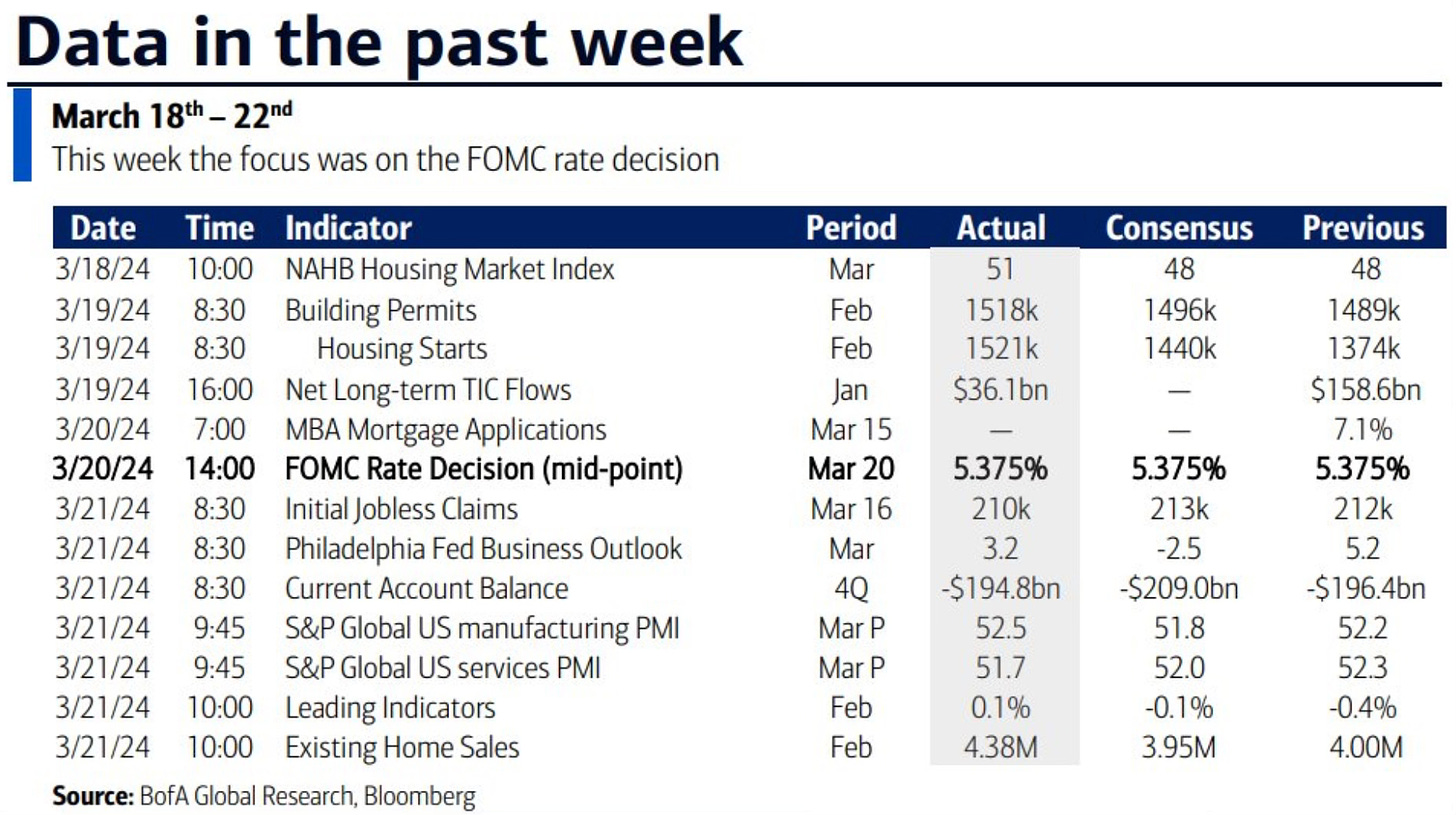
Market Recap
Household Financial Health
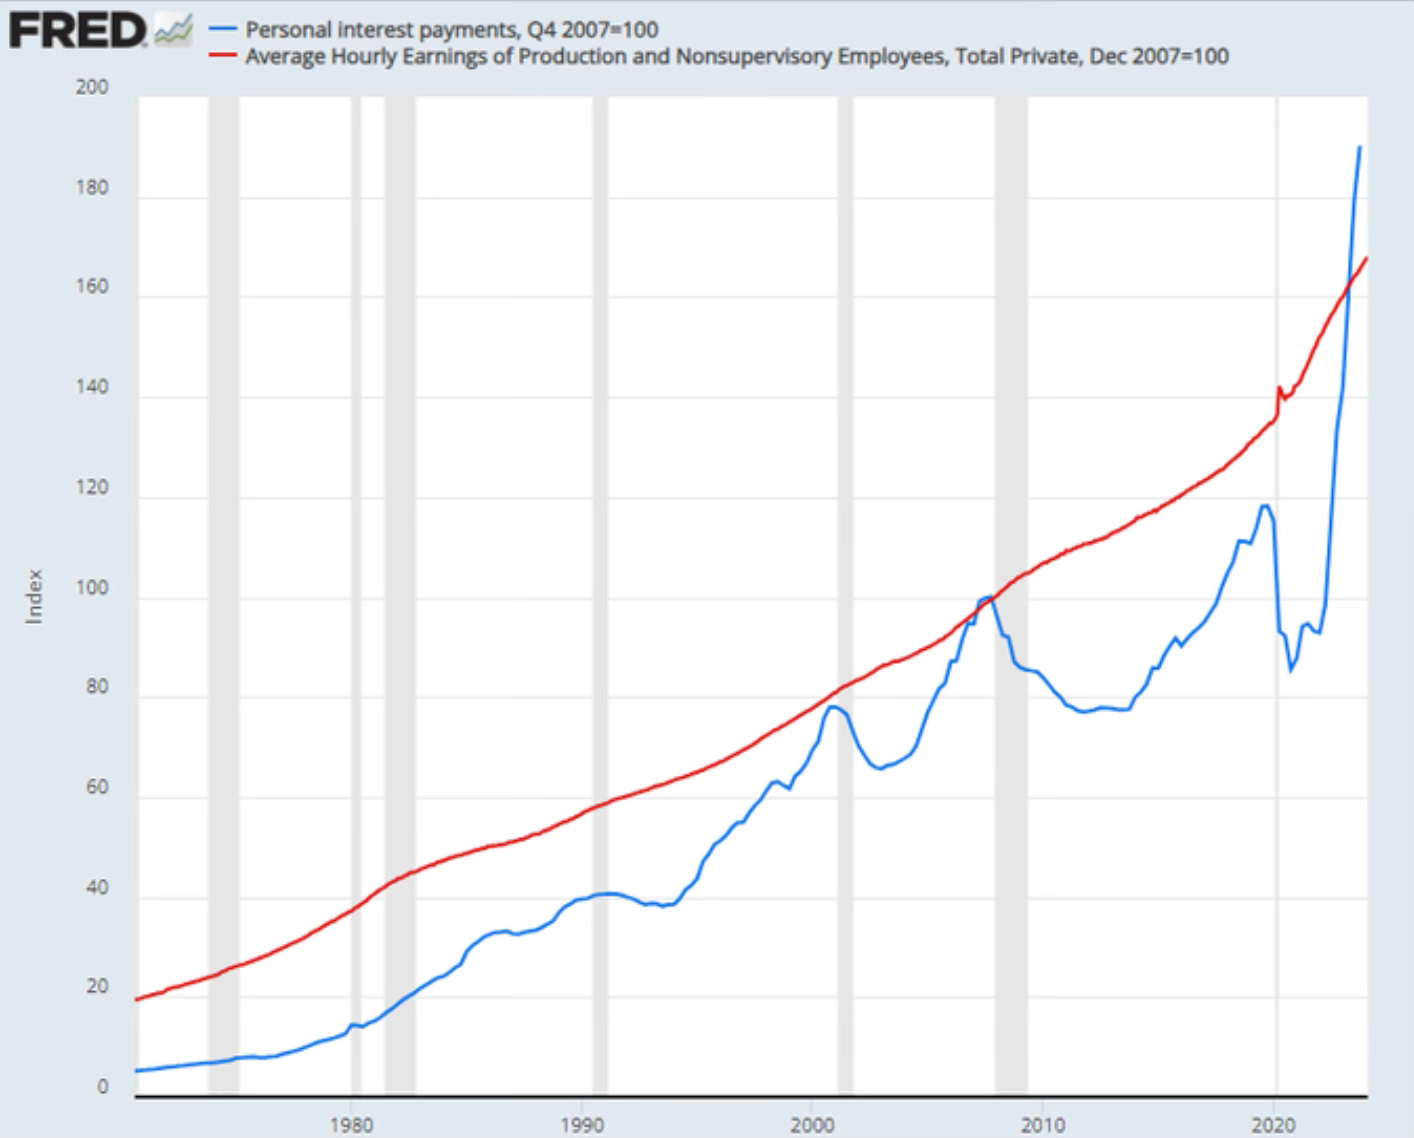
The chart of the week comes from Samantha LaDuc below. This created a lot of controversy as you can see that the personal interest payments in blue has now surpassed wages for the first time. Should this really create worries on the strength of US consumers?
On the flip side there is this from Ben Carlson. Households are growing their assets much faster than their liabilities.
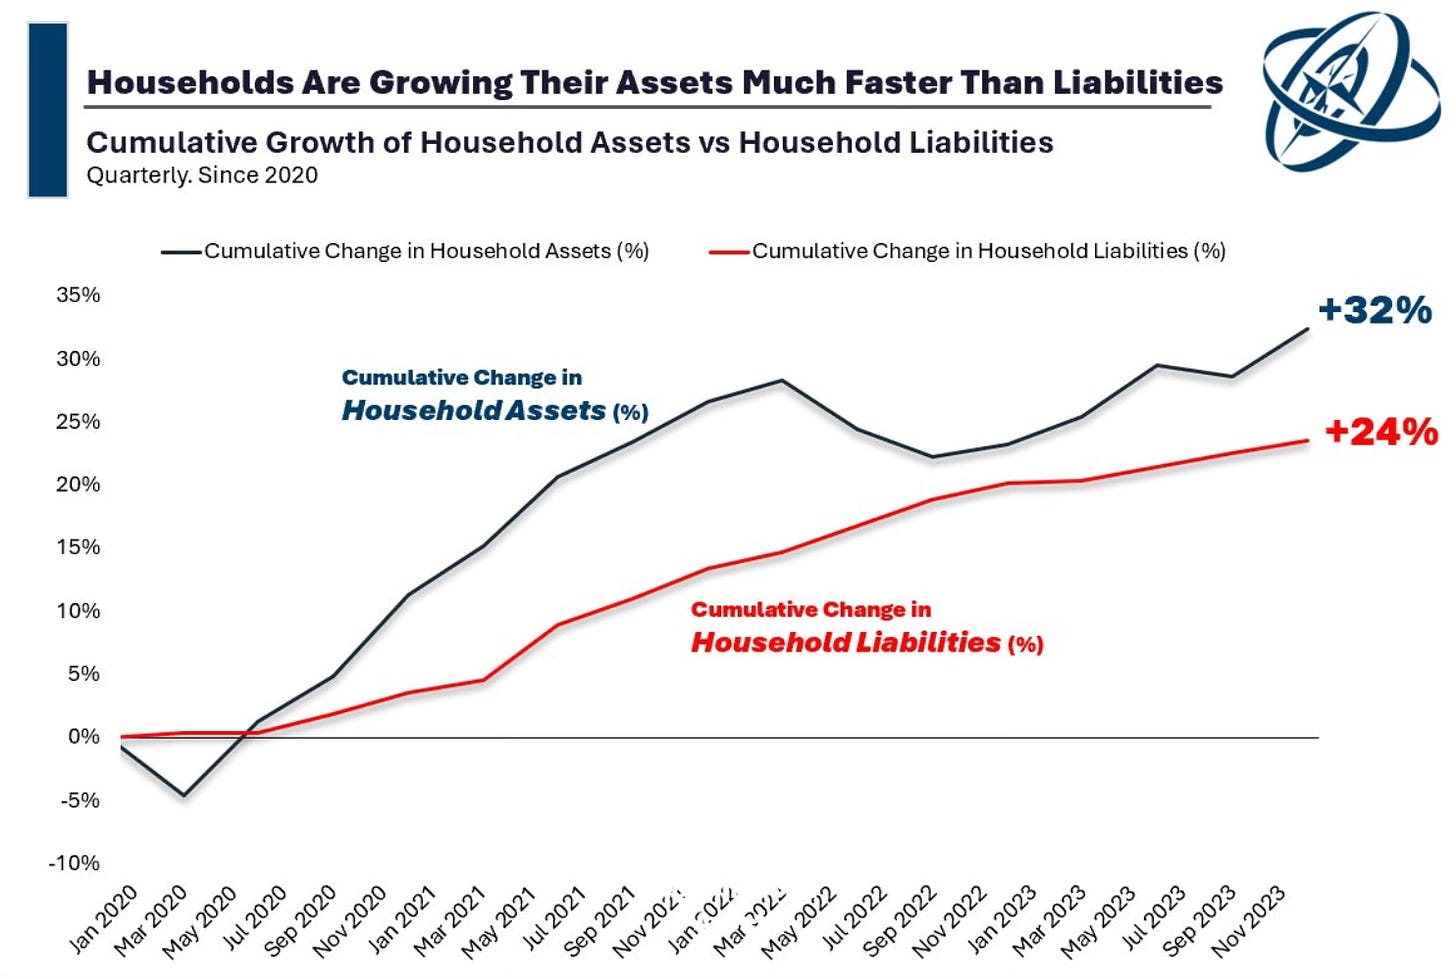
This is the sort of stuff that can debated all day back and forth on both sides. I think the key to these two charts is can people handle and manage the debt correctly. Not all debt is necessarily considered bad either. This makes for an interesting debate that won’t be decided today.
Risk Appetite Highest Since November 2021
When we look for toppy signs, one of those is when everyone is either entirely bullish or bearish. Right now it’s clear everyone is bullish.
The Fund Managers Survey shows that risk appetite is now at the highest level since November 2021. We know what happened the next month in December 2021. That was the top of the previous bull market and the bear market of 2022 followed.
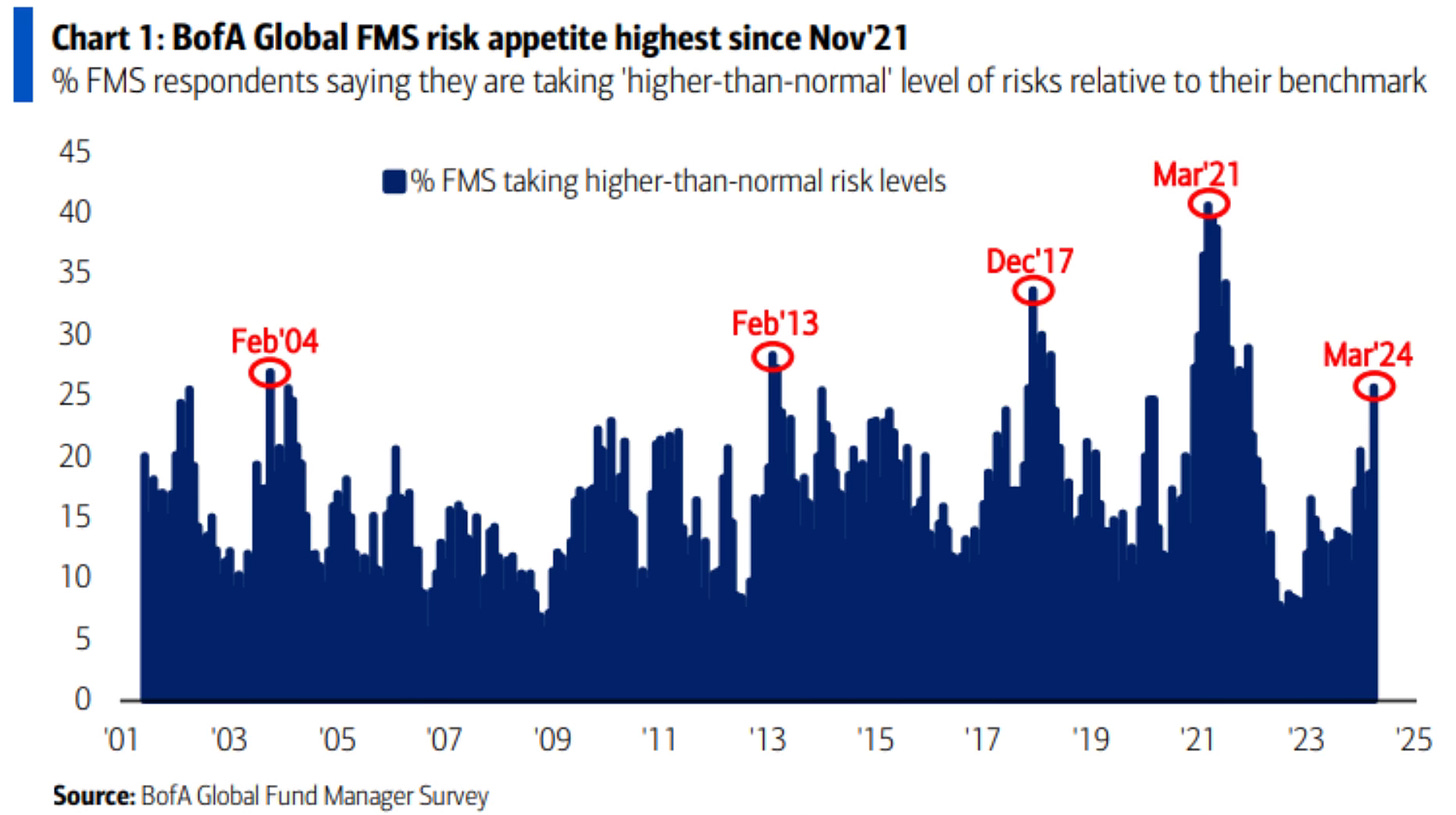
But is this a good reason to sell?
This is such a great chart from Jason Goepfert showing the S&P 500 after extremes in fund manager sentiment. It proves yet again why you can’t try to time the market.
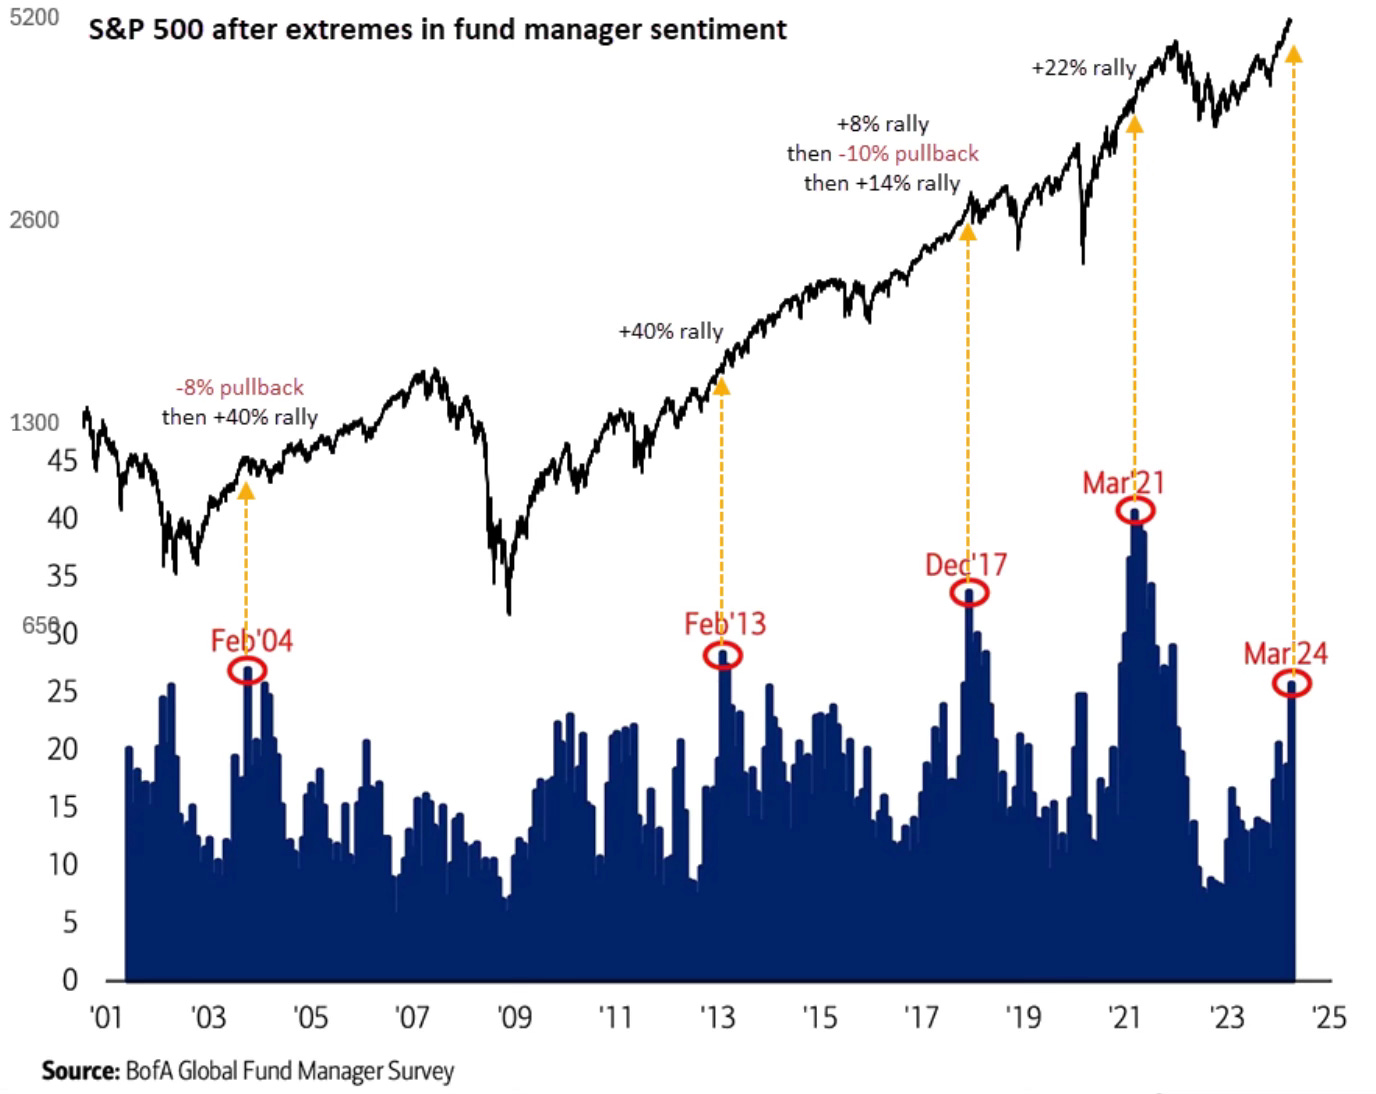
Right now the music is playing. Everyone is bullish and everything is going up. We know this can’t last forever. It never does. The music will eventually stop but nobody knows when that will be. So take a moment and just enjoy it.
Highest Buy & Sell Ratings
I’ve wondered what companies Wall Street analysts are the most bearish and bullish on. I found it interesting from FactSet that there are 11,557 rating on stocks in the S&P 500. In total those ratings reflect there are 53.8% buy ratings, 40.5% hold ratings and 5.7% sell ratings.
These are the highest percentage of stocks in the S&P 500 with sell ratings.
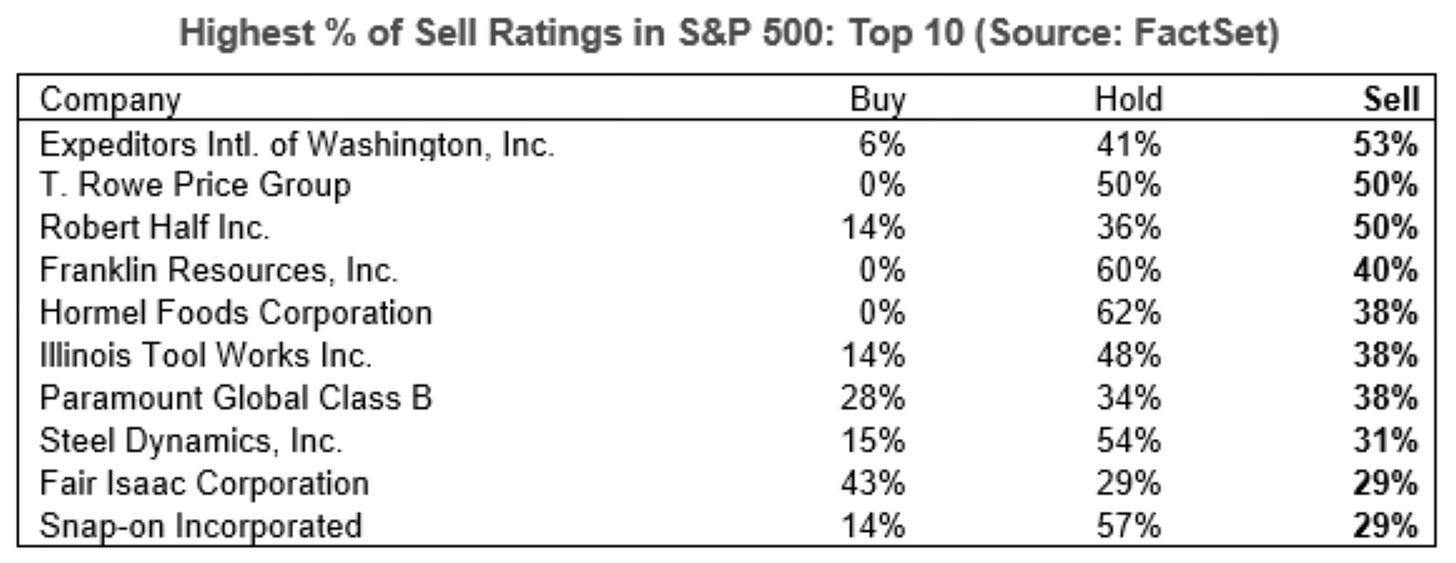
Here are the highest percentage of stocks in the S&P 500 with buy ratings. I was a bit surprised to see Delta leading the way. I’m happy to see three stocks that I own on this list in Amazon, Uber and Nvidia.

Moves I’ve Made
Deere I sold my position in Deere at $400. I’ve been in this name for over a year and it really hasn’t done anything. I still like this company and could get back in at some point but in the foreseeable feature there doesn’t seem to be much upside. As you’ll see below I also sold this as I saw a better opportunity present itself.
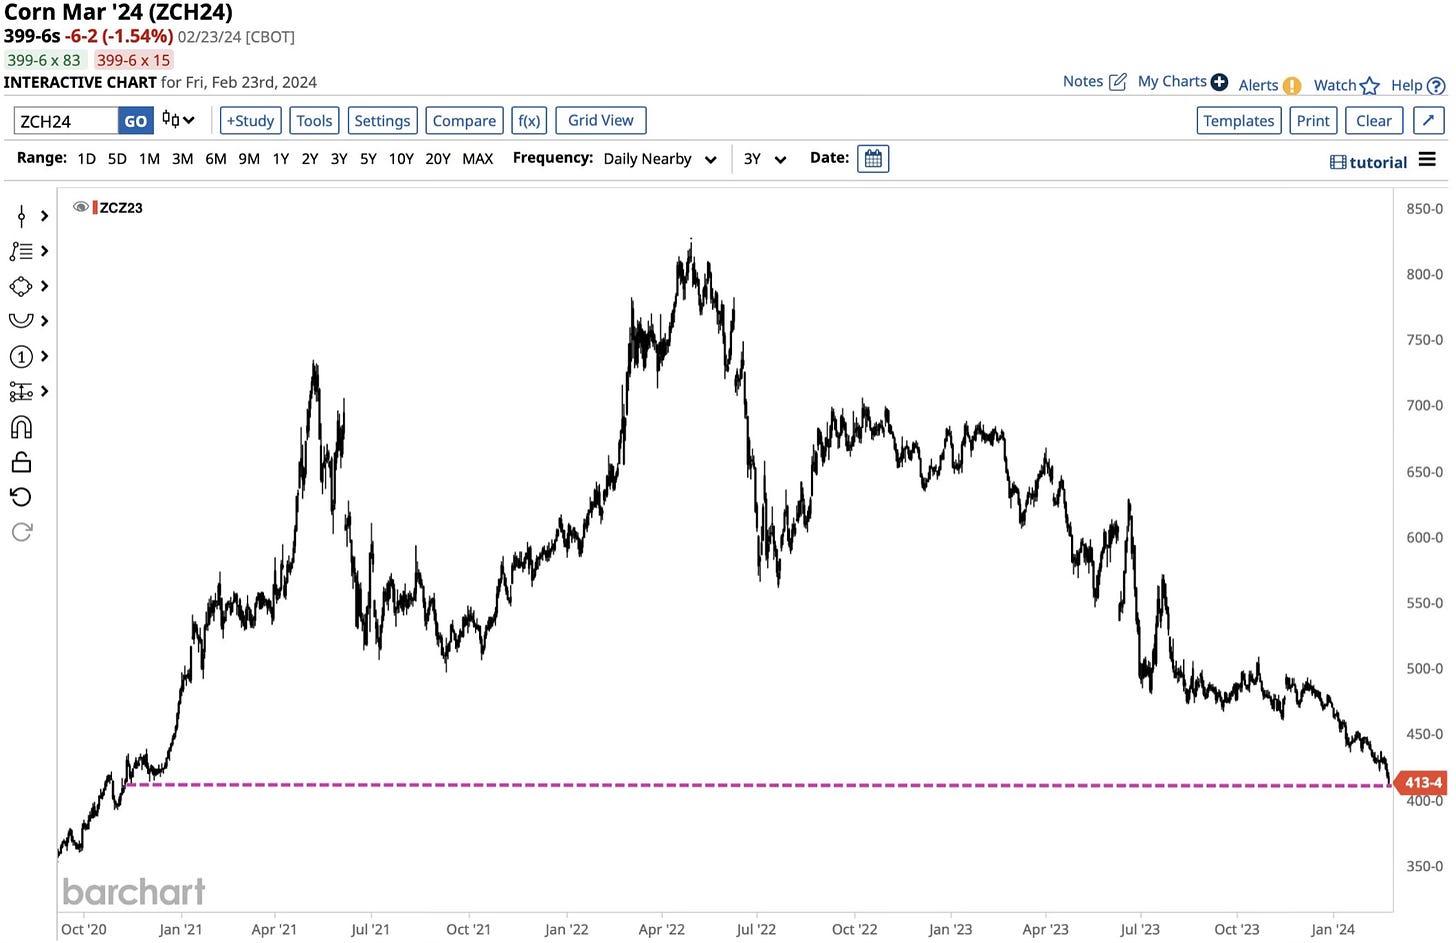
A chart that I keep thinking about relative to Deere and farmers is the price of corn. Corn has now fallen to the lowest price in over 3 years. I can’t see Deere breaking out until this trend reverses.
Lululemon I used my proceeds from selling Deere to increase my position in Lululemon. I bought more shares of Lulu at $399 and have now doubled my position.
My first buy came back in October at $368 a share. Not long after I started my position it shot up to a new high of $516.38. I didn’t think I’d see it again with a 3 in front of it and kept wishing I had bought more when I initiated my position.
Well on Friday I got that chance after it reported earnings on Thursday after the bell. Friday was Lulu’s worst day in more than 3 years.
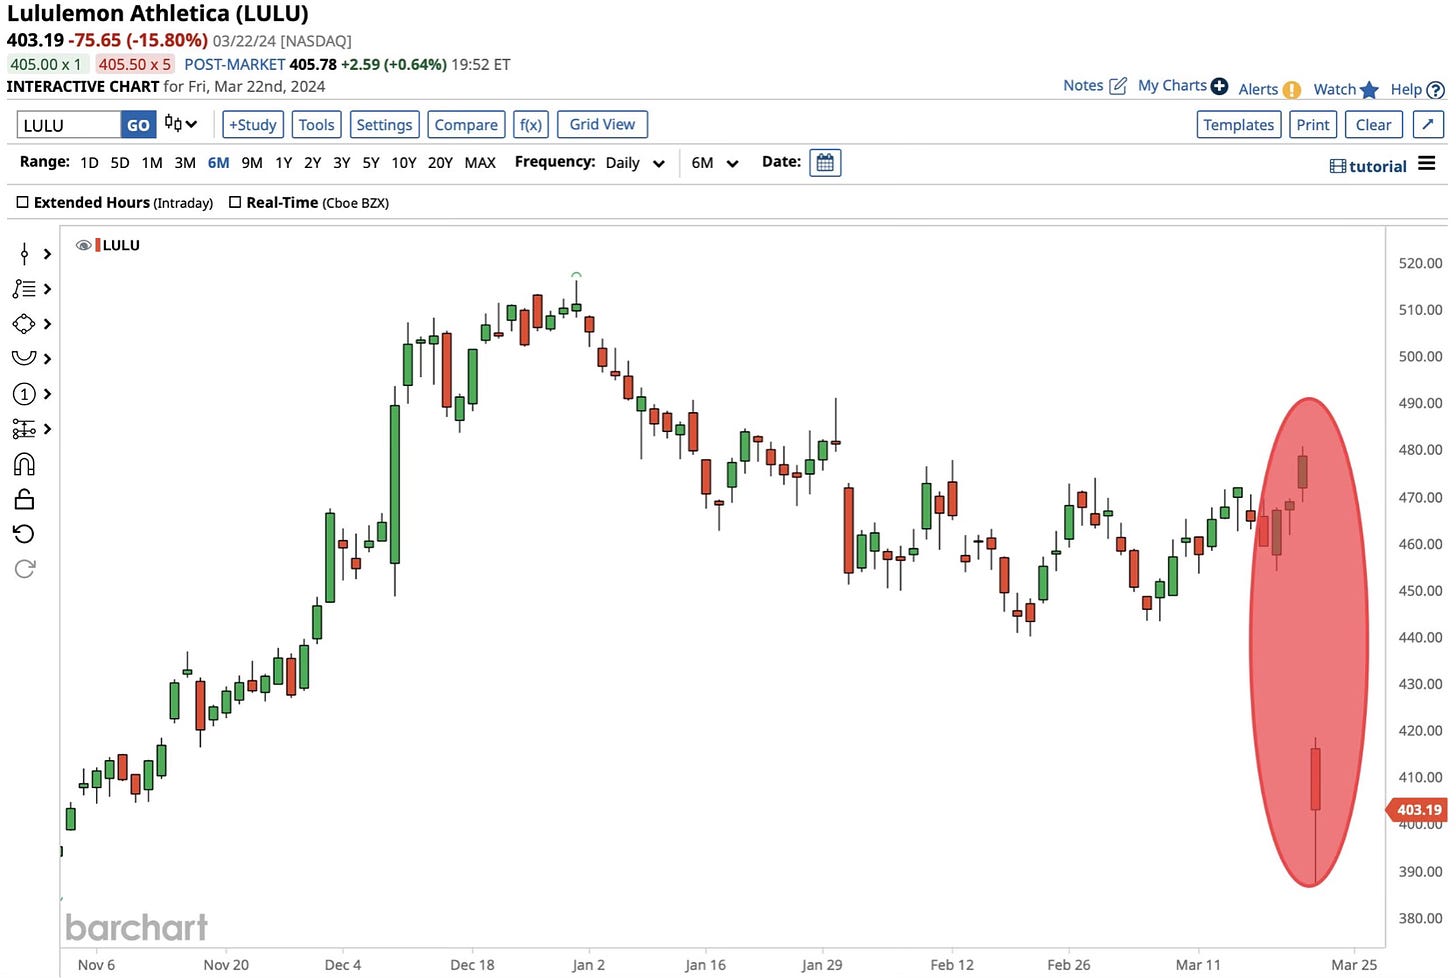
In fact the entire consumer discretionary sector has been setting new 52-week lows relative to the S&P 500. The overall sector has been doing so bad that’s why I didn’t buy Lulu prior to their earnings. I thought about buying at $450. My worry was that the sector has been so beaten up and Lulu has held up quite well, that if Lulu doesn’t have a blowout earnings it could get smoked. And smoked it did.
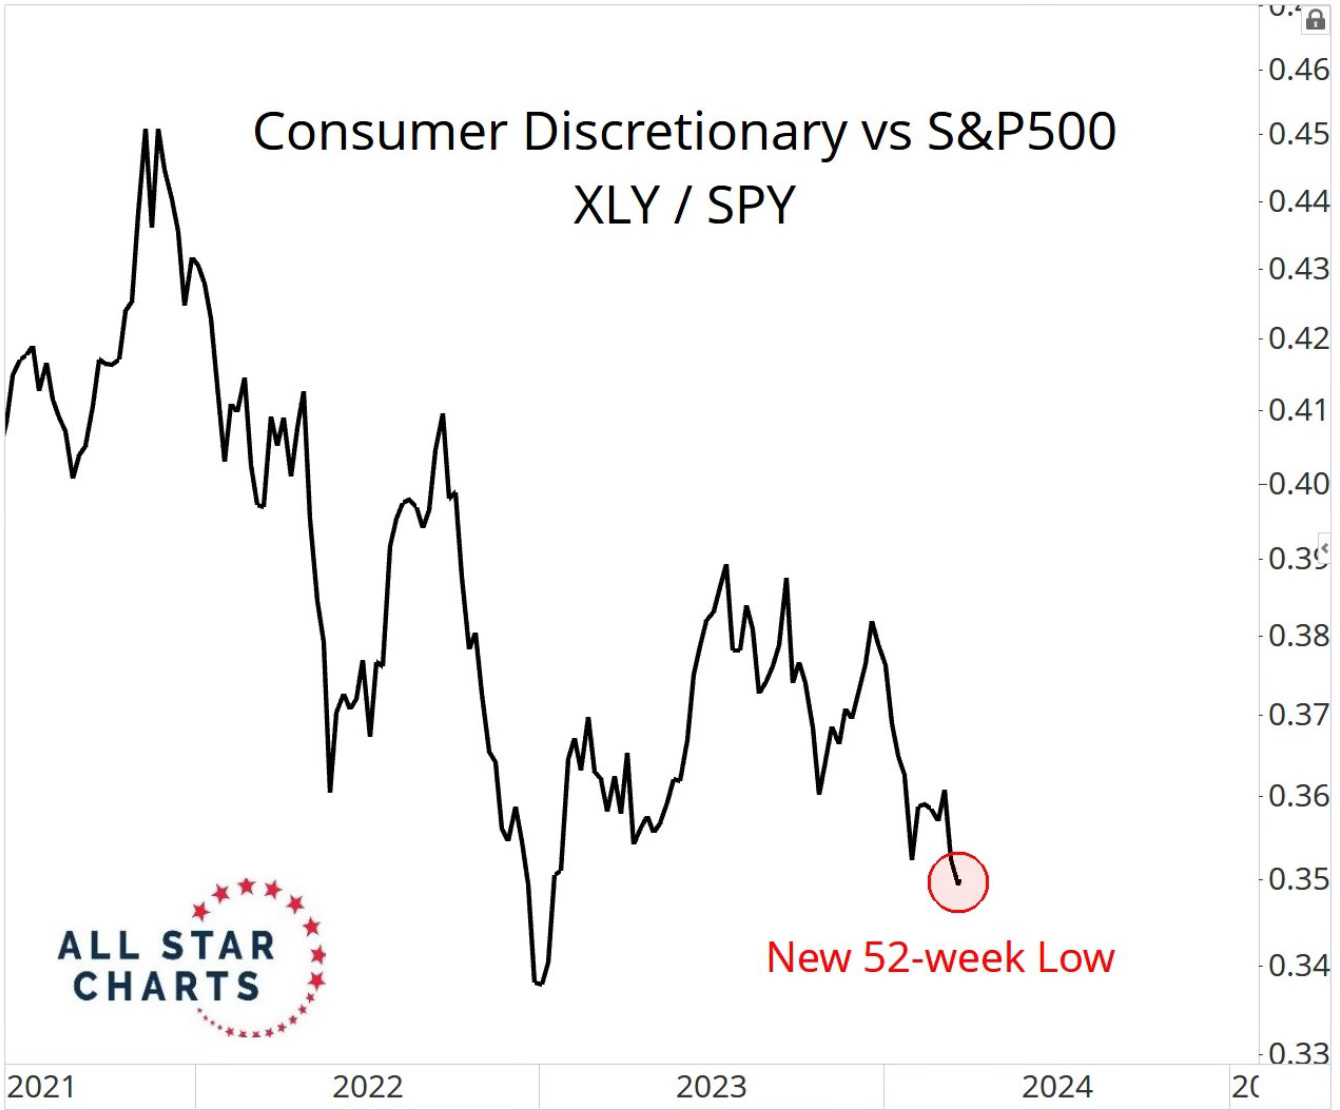
It turned out that I did get to increase my position after an earnings reaction which I feel resulted in it getting oversold. Their results beat but their guidance was light. I still know far too many people of all ages that still buy all their clothes for both work and casual from Lululemon. Still a growth leader in my opinion.

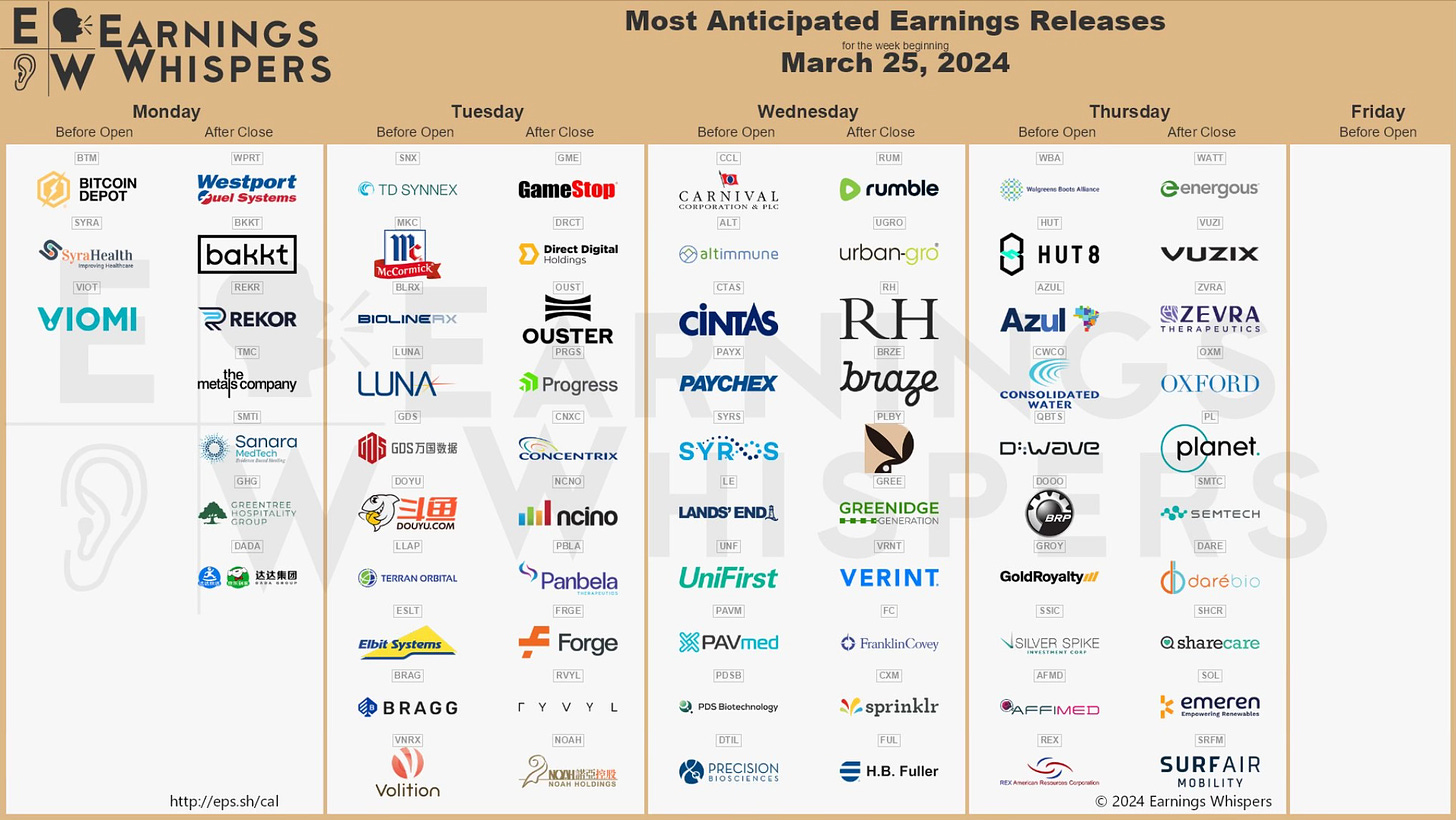
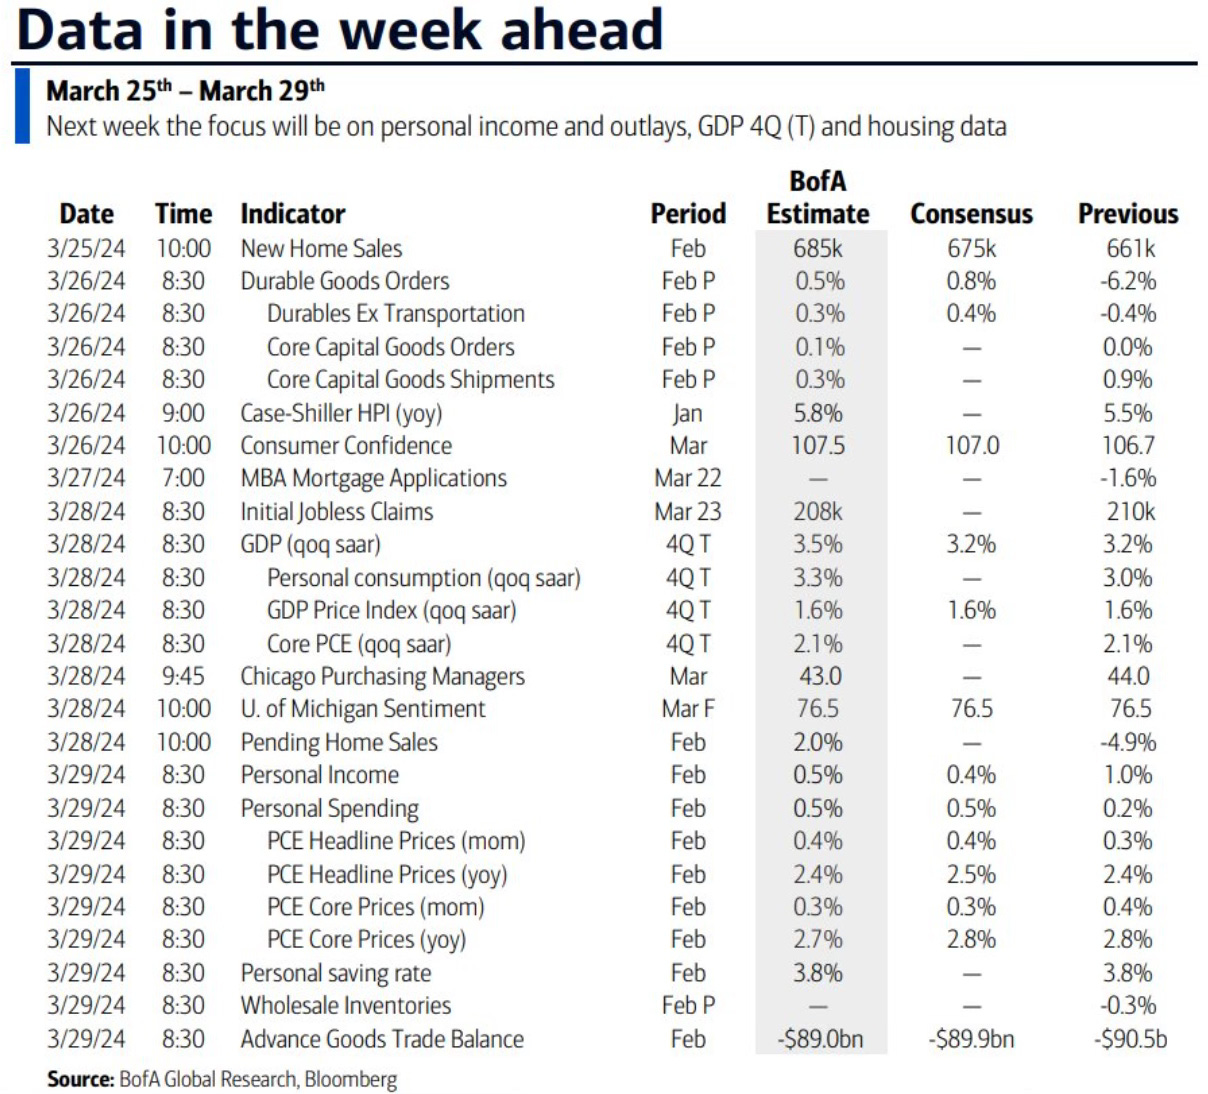
Upcoming Earnings & Data
The Coffee Table ☕
Over the years I’ve seen a lot on opening Roth IRAs for children. Few things I’ve read go this in depth and actually explains it with examples and what you can and can’t do. A very helpful read for people with kids by Meg Bartelt. Did your child earn money last year? You can open a Roth IRA for them.
There has been a lot of conversation recently around if magazine covers signal buy or sell signals. The best piece I read was by Barry Ritholtz, Do Magazine Covers Contain Market Signals? Leave it to Barry to present the question and then close the conversation with a clear answer for us.
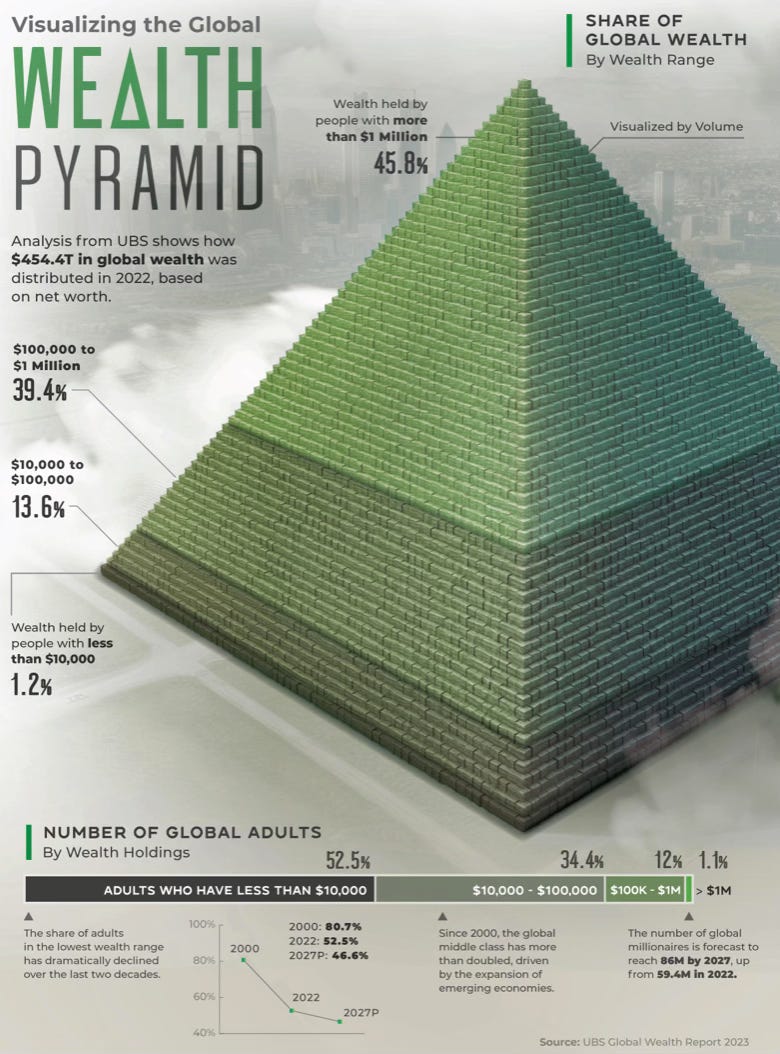
This was such a cool visual that I had to share it. This visualizes the global wealth distribution. I was surprised to see that the global middle class has more than doubled since 2000 and if you have over $1 million it puts you in the top 1.1% globally.
Thank you for reading! If you enjoyed Spilled Coffee, please subscribe.
Spilled Coffee grows through word of mouth. Please consider sharing this post with someone who might appreciate it.
Order my book, Two-Way Street below.


