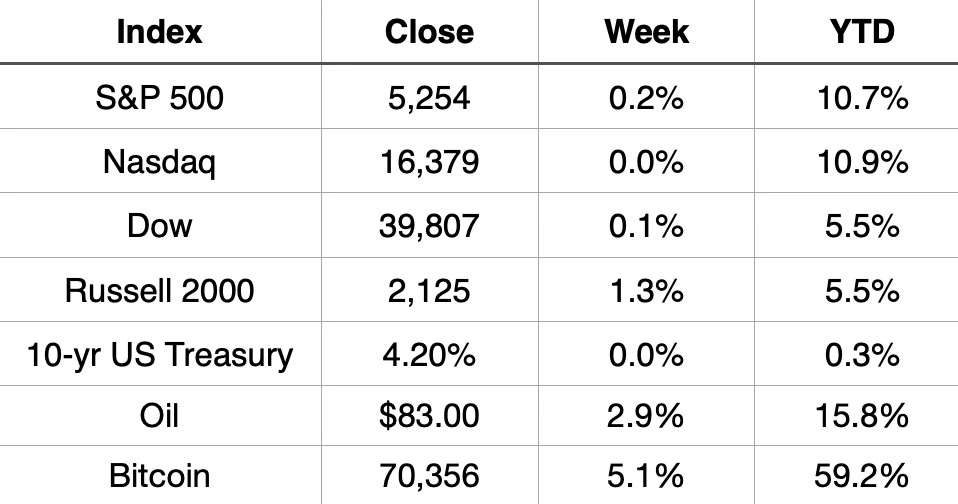
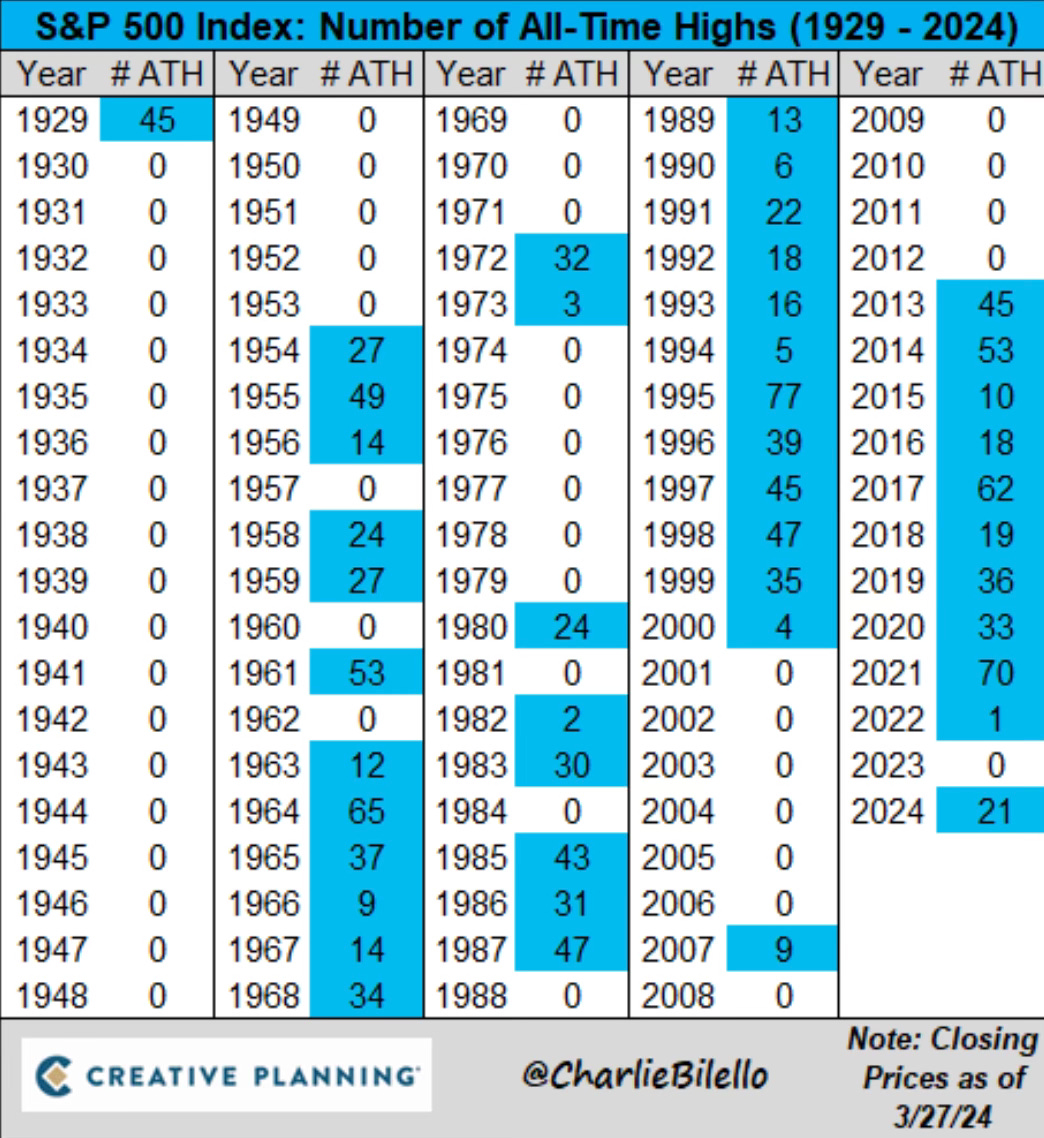
This week ended with the stock market closing at new all-time highs yet again. That makes a new all-time closing high for the S&P 500 in 22 of the 61 trading days so far in 2024. It has closed at a new all-time high on 36% of the days in the first 3 months of 2024. Wow!
Did you have 22 all-time highs in the first quarter of 2024 on your bingo card? (This chart was done before the final trading day of March 28th which made 22)
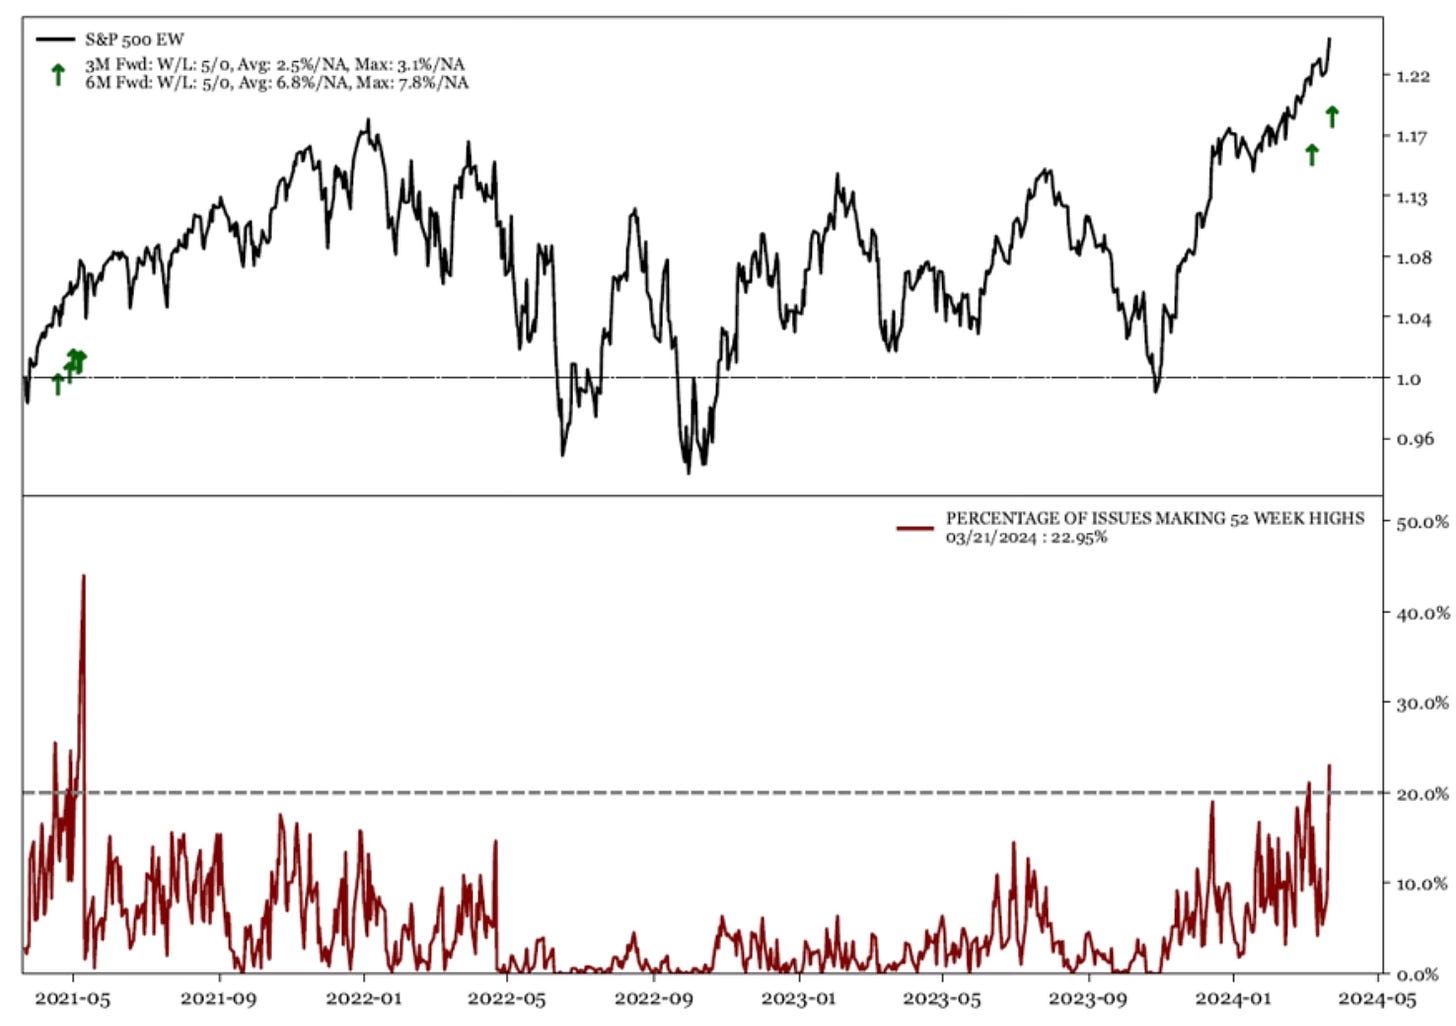
The amount of 52-week highs in the S&P 500 hit 23%. That’s the highest level in 3 years.
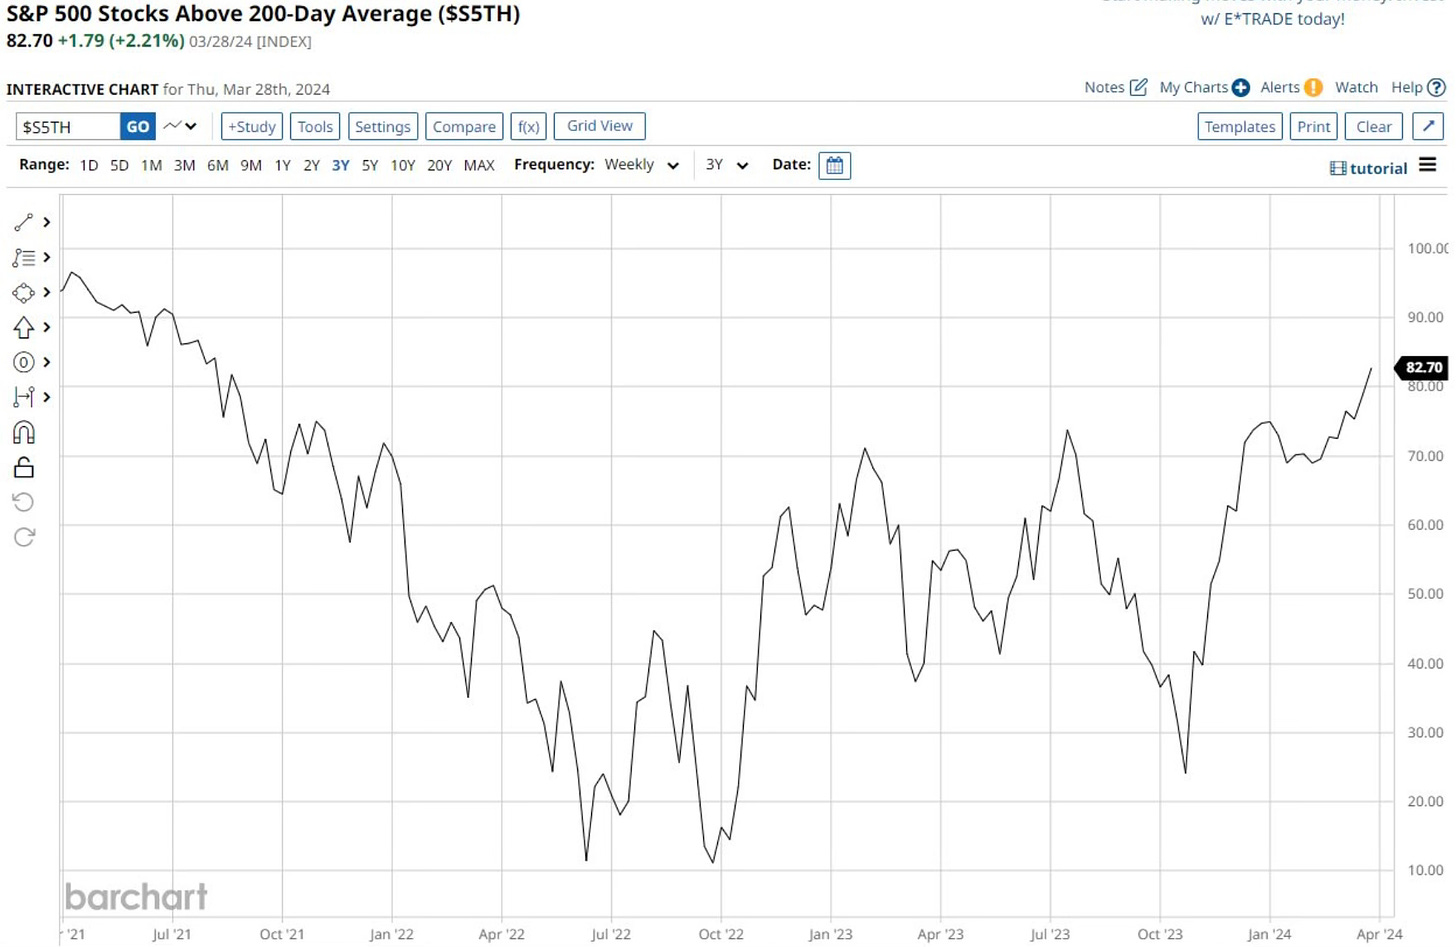
82% of S&P 500 stocks are above their 200-day. That’s the most since August 2021.
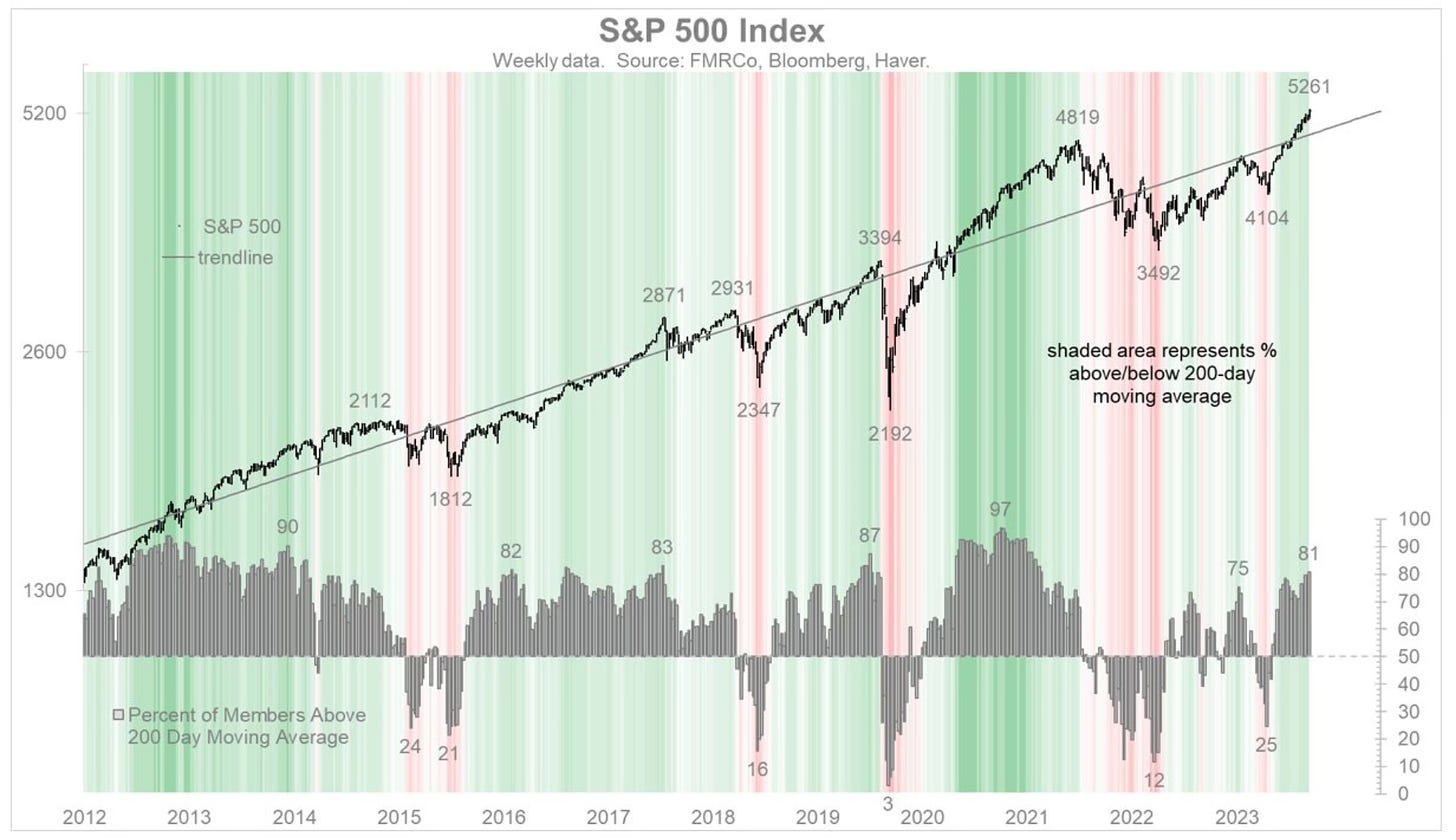
This detailed chart from Jurrien Timmer shows the S&P 500 index and the 200-day moving average trends back to 2012. Is this bull market getting even stronger?
All this strength has basically killed volatility. The VIX average for 2024 is 13.7. The historical average of the VIX is 19.5.

This has led to what seems like seemingly everyone both expecting and wanting a pullback. I wrote about the history and likelihood of a pullback recently, Why A Stock Market Pullback Is Likely.
Has this been too far too fast? Sure, but look at the broadening of this bull market. When everyone wants or is expecting something, we know it doesn’t happen. This strong bull market has now broadened providing further strength. Tech and mainly mega-cap tech led most of the way but now you have other sectors taking over as the new bull market leaders. I discussed this in detail earlier this month in, Investing Update: Is Energy The New Leader?
Through Q1 the S&P 500 is up 10.7% while Apple is down 7.6%. I didn’t have that on my bingo card either.
Market Recap
What Does April Hold?
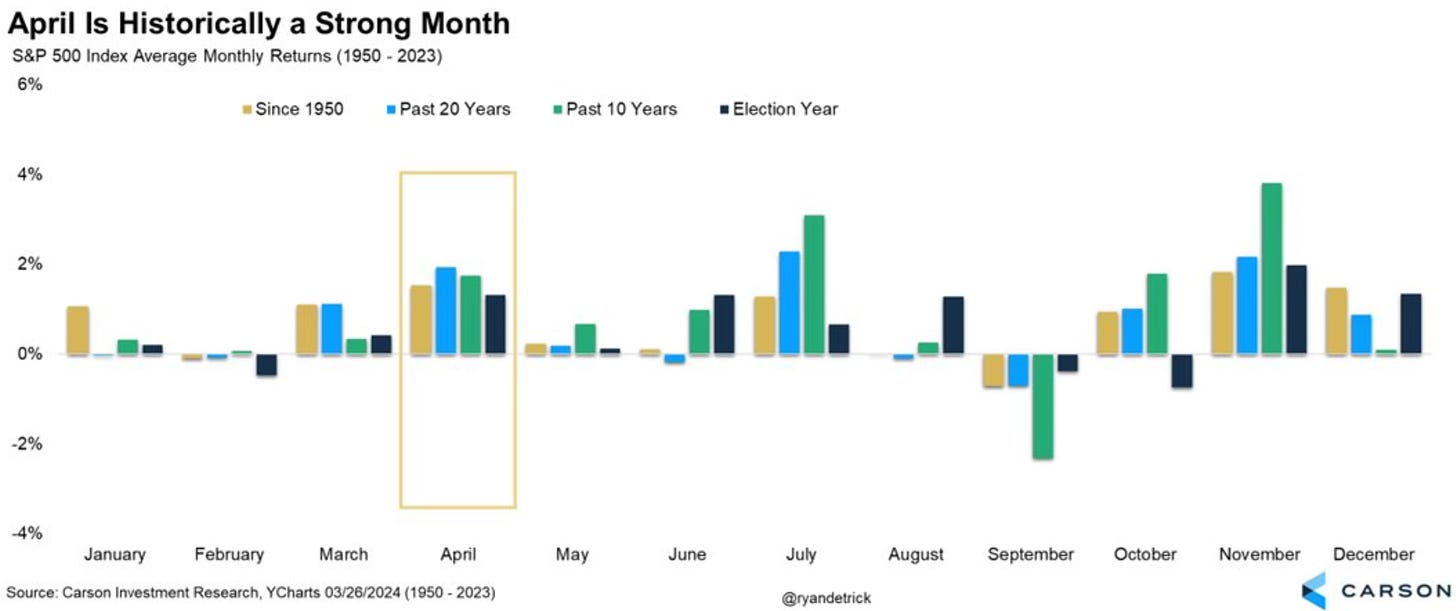
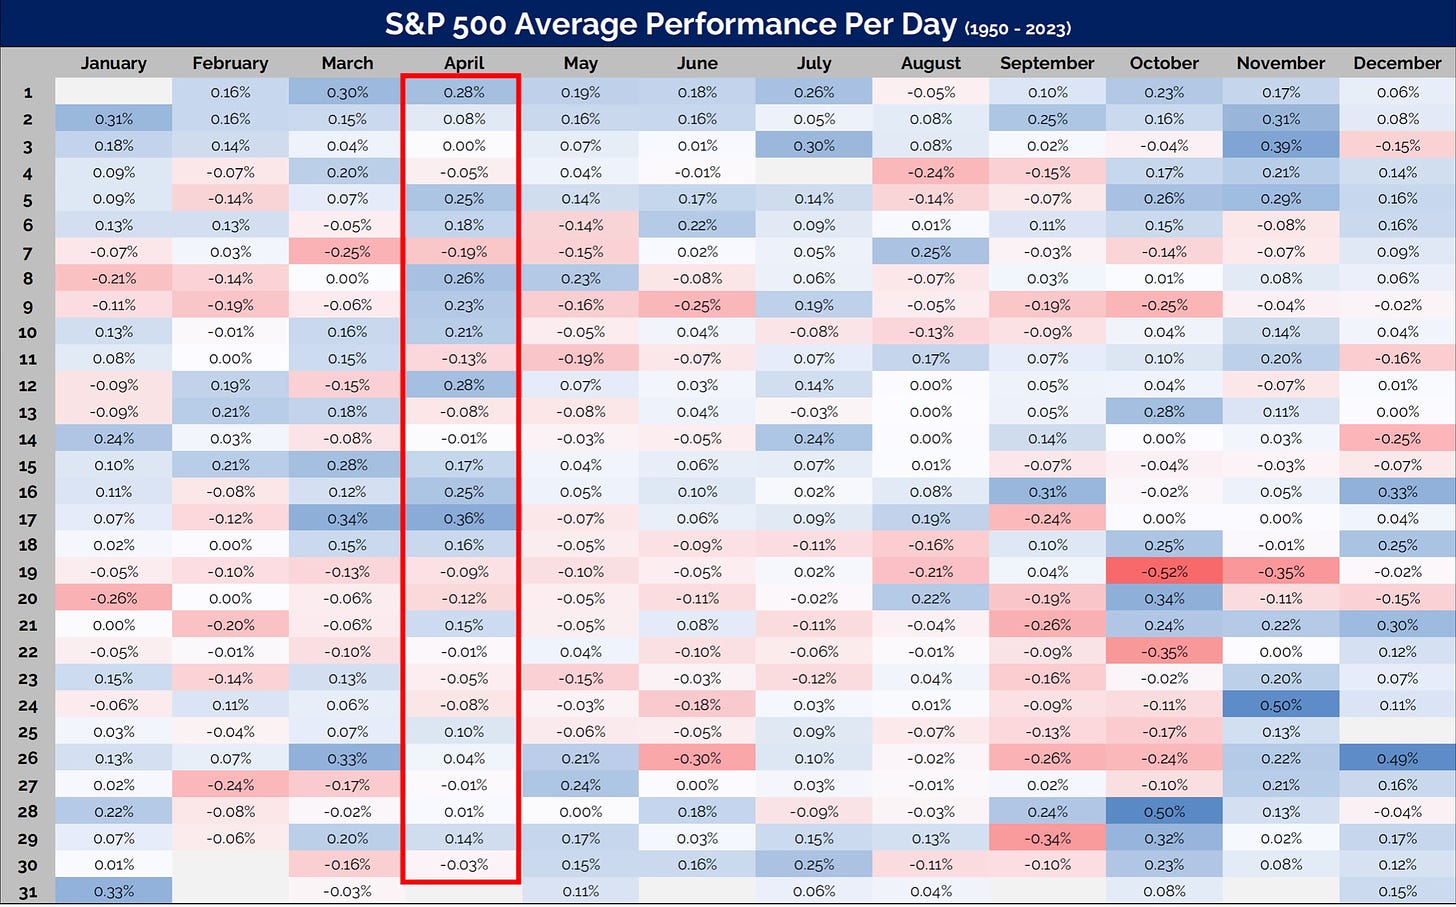
What has April historically done? It’s been one of the best months of the year. Only November is better since 1950. The last 10 years it’s the 4th best month. It’s normally a very solid positive month. We will see if April 2024 continues that trend.
This chart shows the average S&P 500 performance per day. We can see there is a lot of deep blue in the earlier part of April.
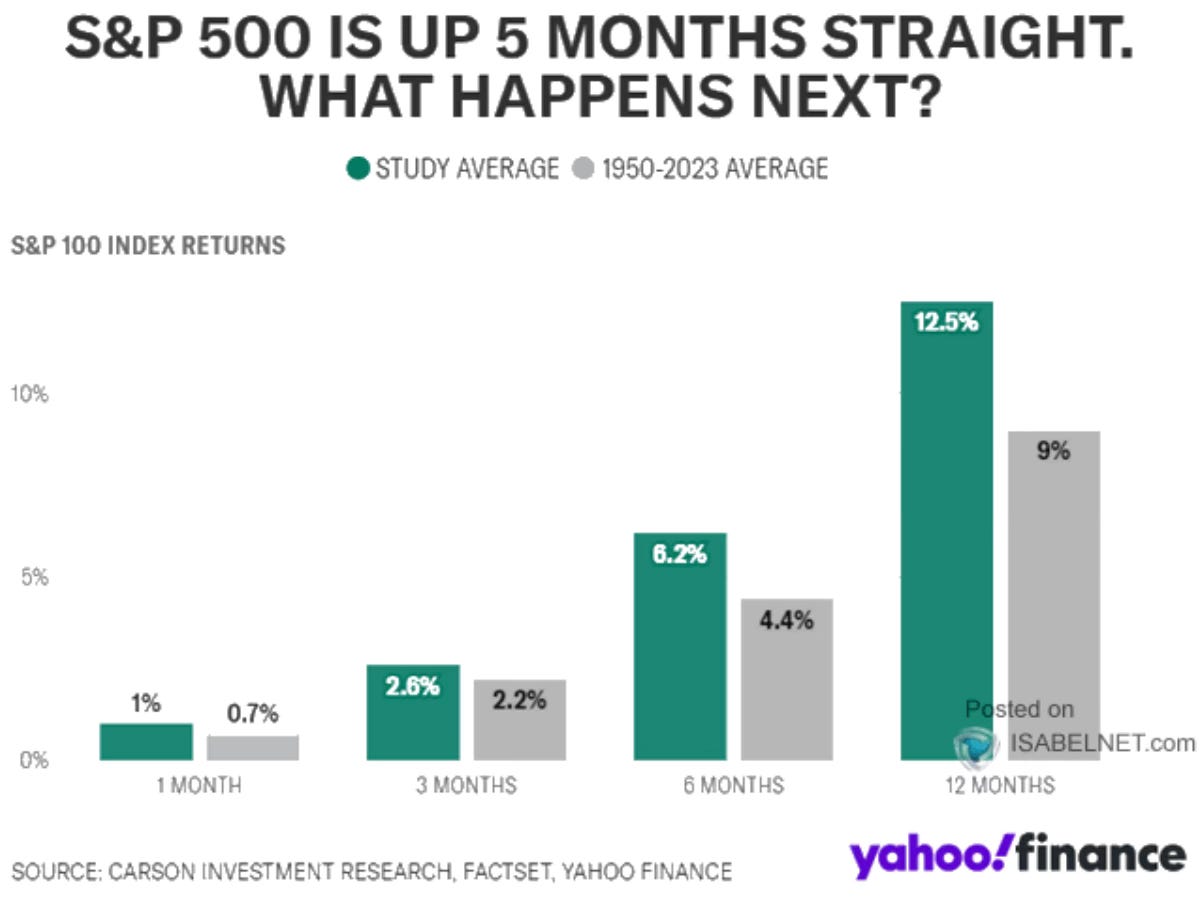
In addition to looking at what April does historically, we can also see what happens next when the S&P 500 is up for 5 straight months. It strengthens and continues higher.
Is The Market Expensive?
The stock market has ran so fast to all-time records that now some say the reason to not buy is it’s too expensive. Yes, certain stocks and areas of the market are overvalued. Some are extremely overvalued. This is a similar story though in every bull market.
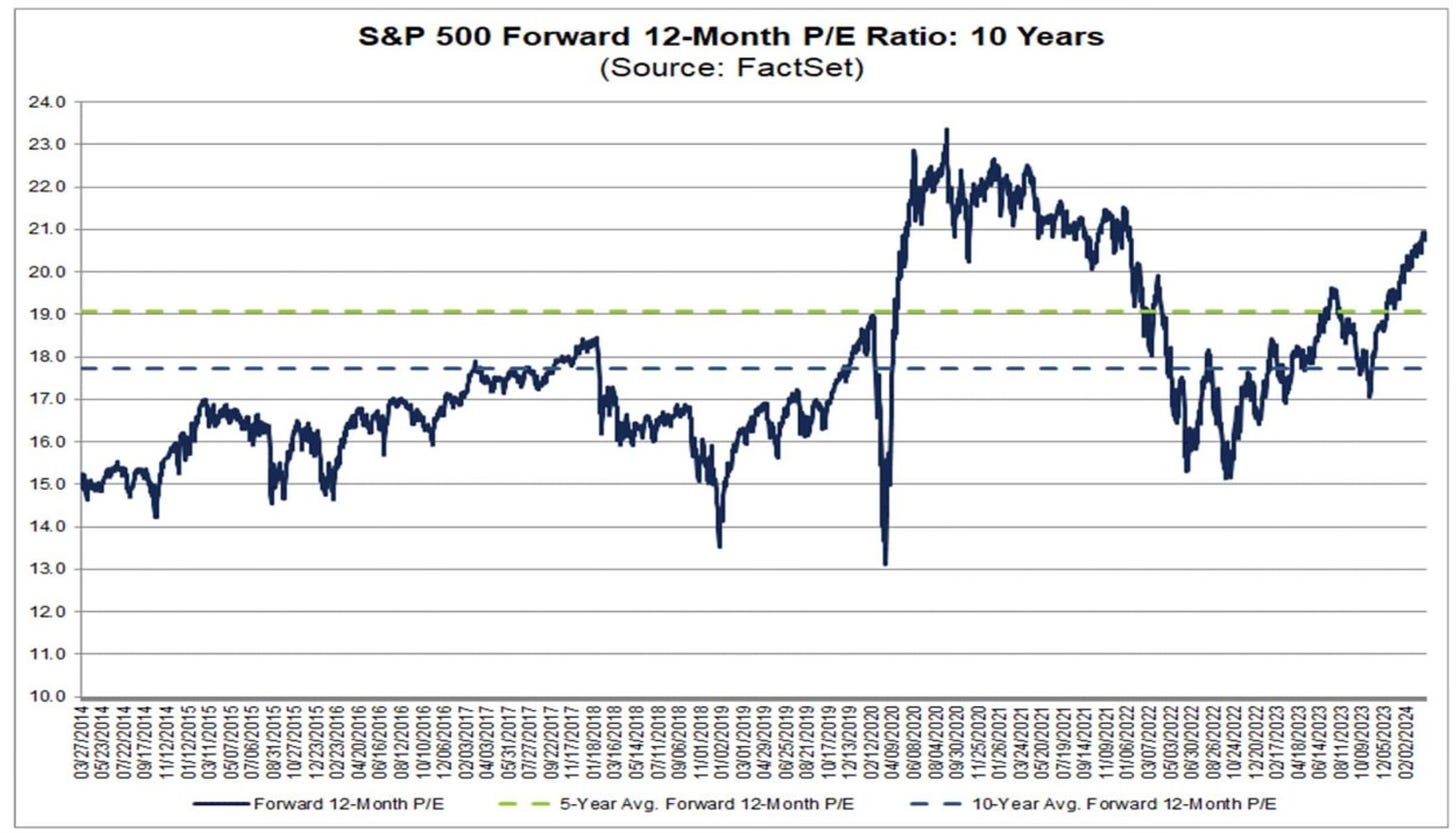
This graph below shows the forward price-to-earnings ratio for the S&P 500 and the Equal Weighted S&P 500. The S&P 500 is elevated and expensive mainly due to the mega-cap tech stocks weightings. The Equal Weighted S&P 500 Index is more in line relative to history for the average stock.

From a forward 12-month P/E perspective, the S&P 500 is at 20.9. It’s above the 5-year average of 19.1 and the 10-year average of 17.7.
If we look deeper into the S&P 500 valuations, it does show things are expensive relative to history. Of the 20 metrics below, 19 are indicating that they’re statistically expensive.
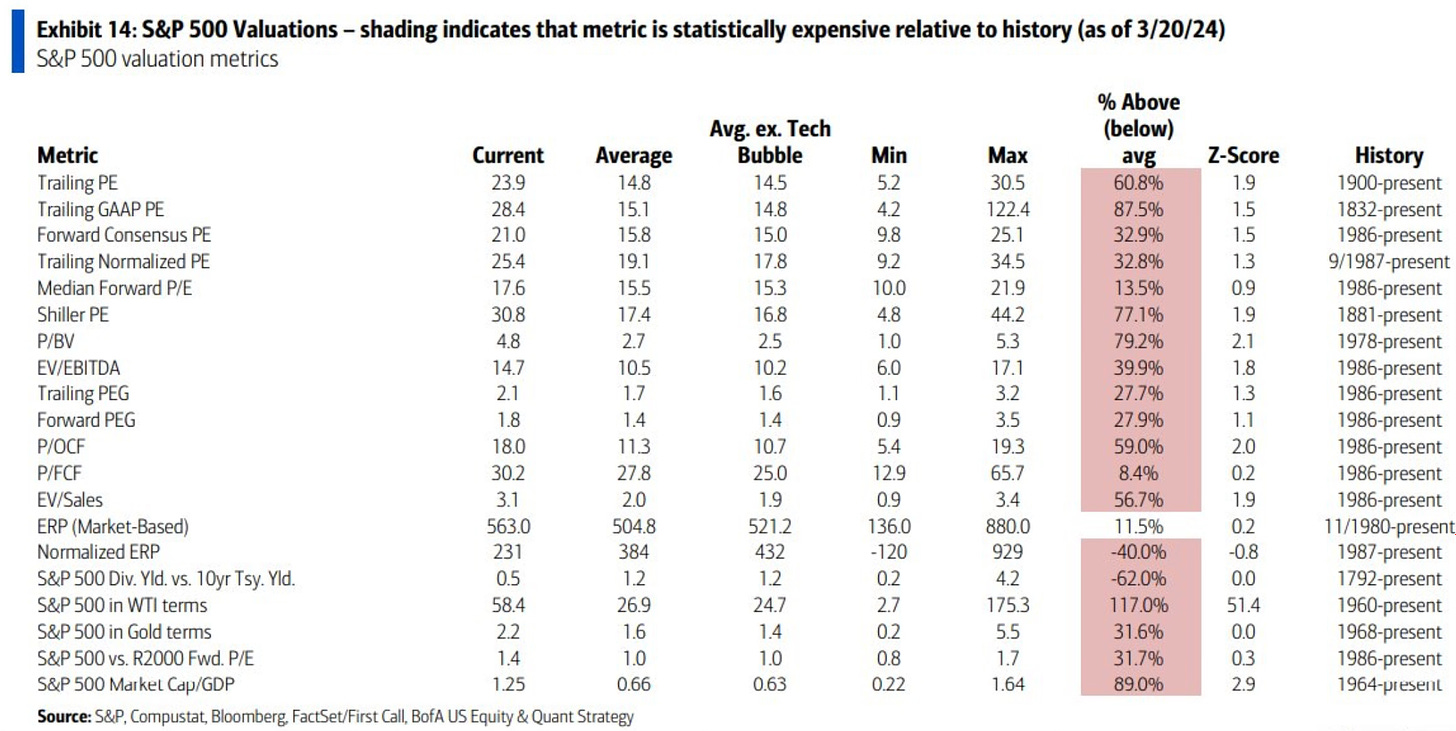
This doesn’t mean that the stock market can’t continue to go higher. It just shows that looking back historically, these current valuation levels are considered expensive.
Record Corporate Profits
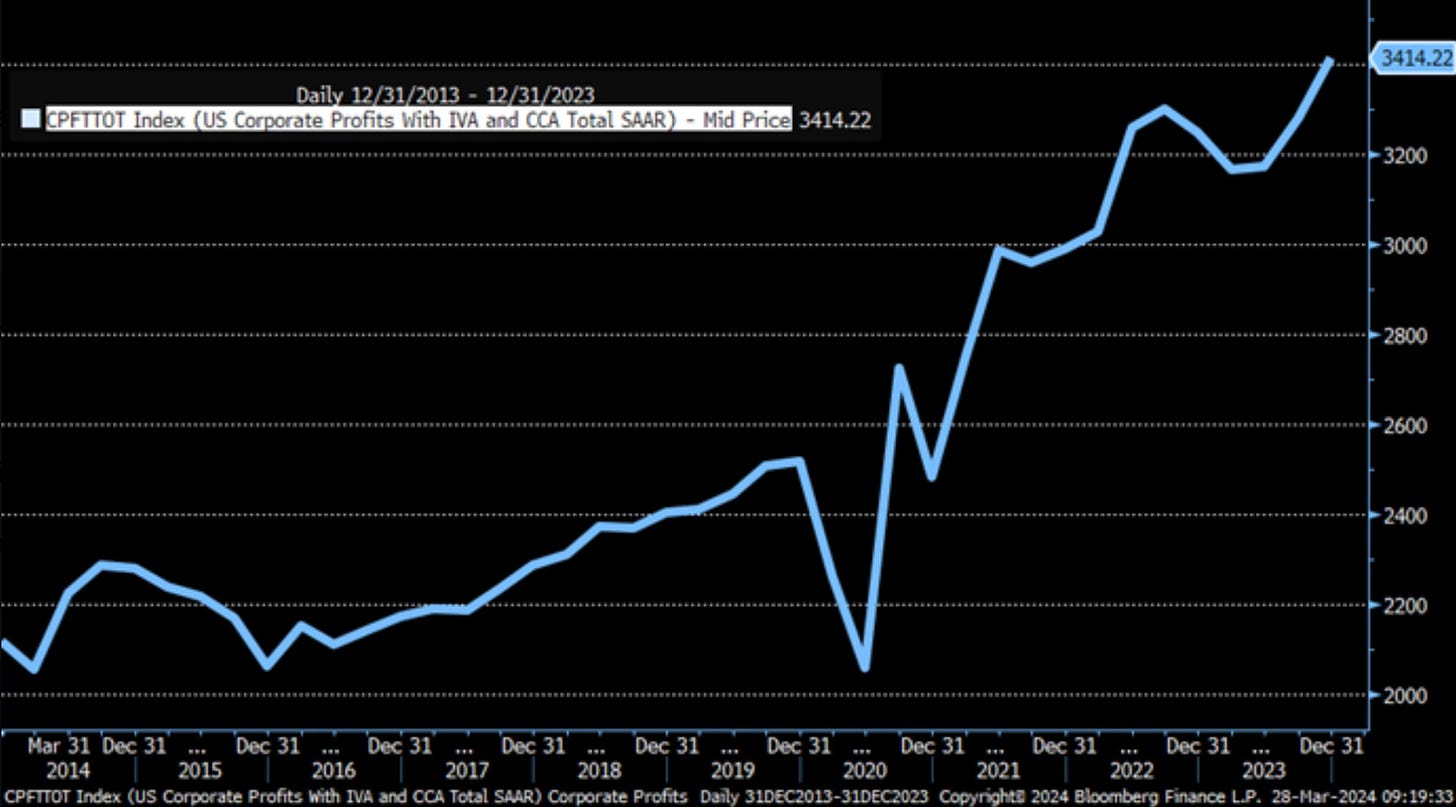
With earnings now in, we’ve seen corporate profits rise to a new all time high in Q4 2023. If earnings and corporate profits continue to grow, it’s hard to see any stopping this bull market from going even higher.
Insider Selling Highest Level In 3 Years
A ratio indicator that I like to watch is insider selling. You learn valuable lessons in bear markets and if you recall in late 2021 the richest people in world were selling. Jeff Bezos, Elon Musk, Mark Zuckerberg, the Walton Family, Larry Page and so on. Many articles were written on this in December 2021. I recall thinking to myself, is this a top? It turned out it was.
At that time, it was a new insider selling record high. You can see it in this chart. Now the insider selling ratio in tech stocks has reached the highest level in 3 years. Almost reaching that late 2021 peak.
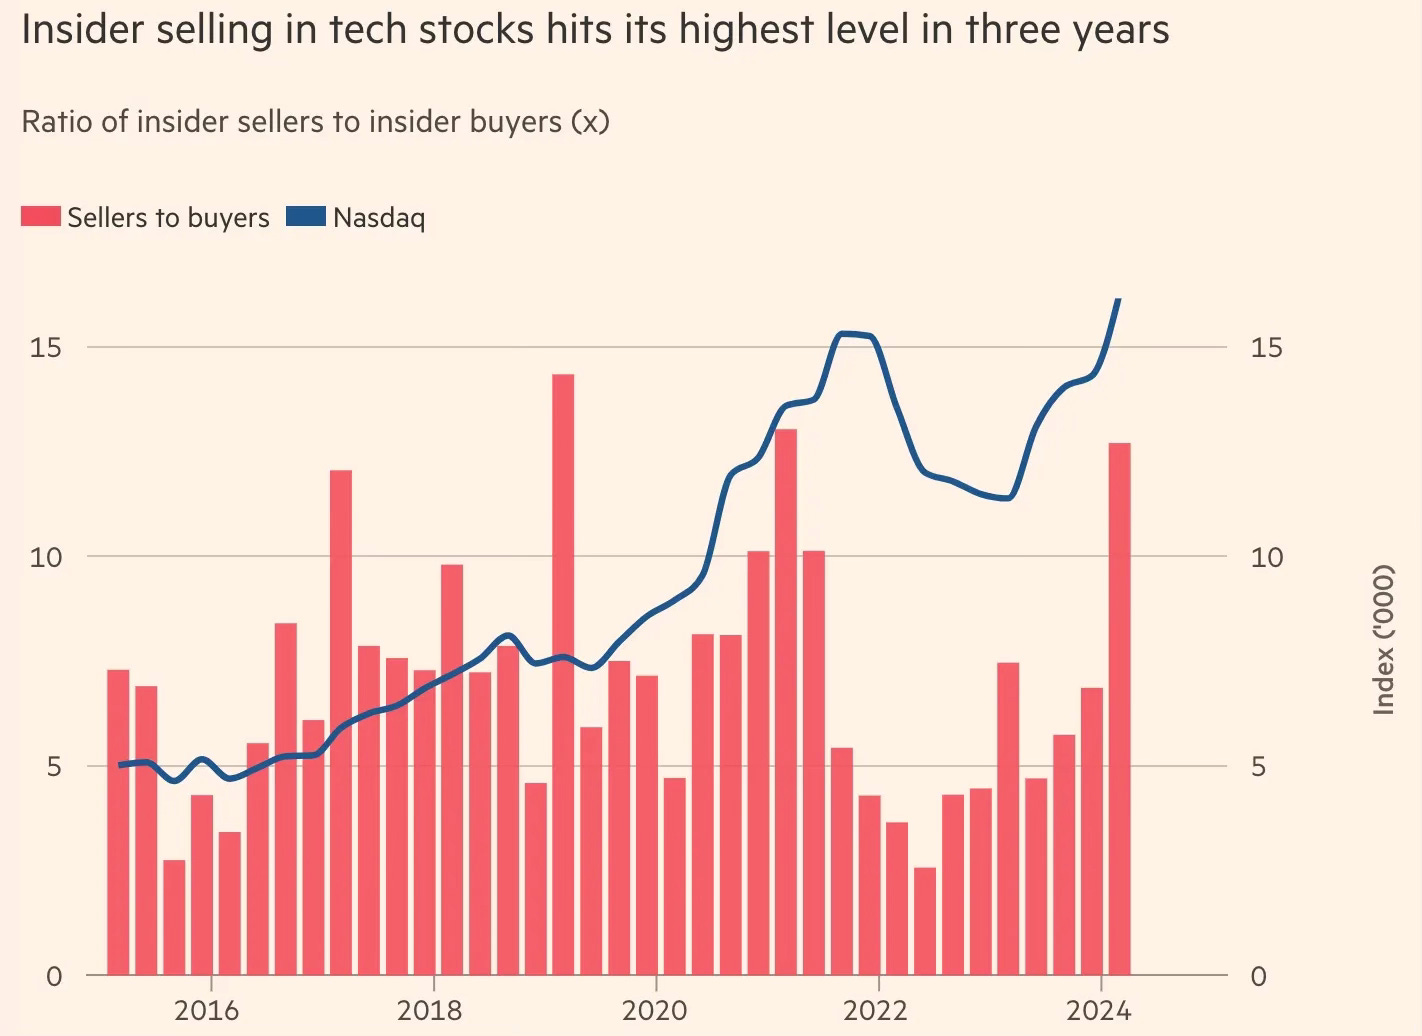
Chart of the Week
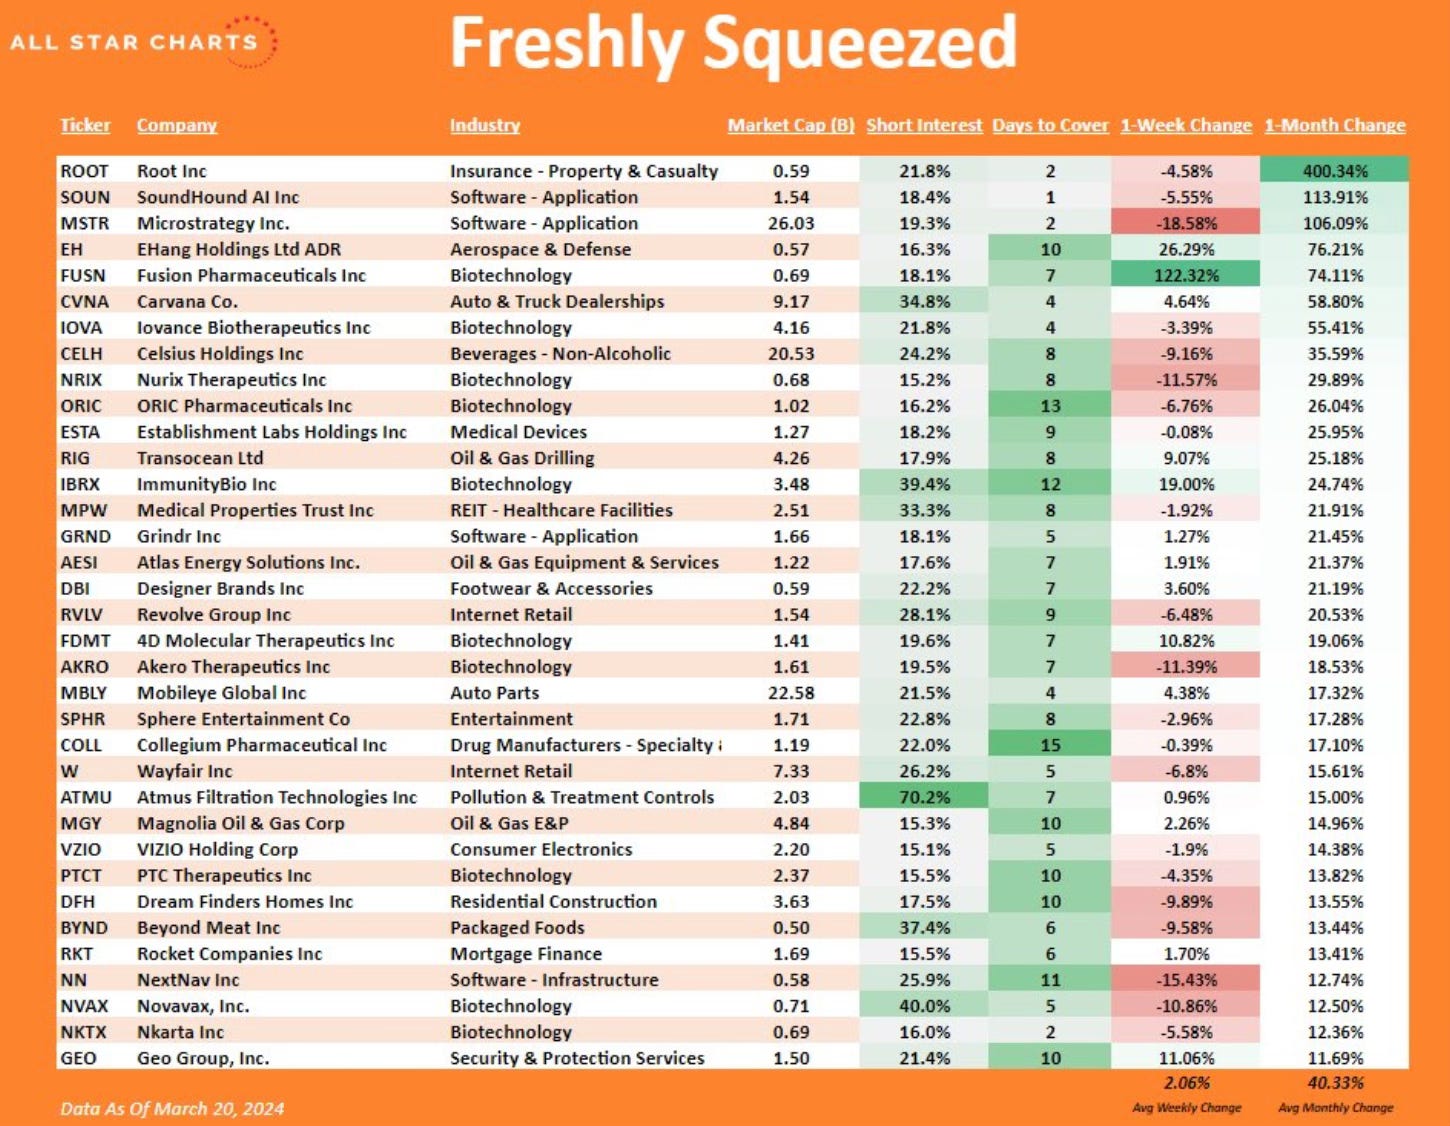
My favorite chart of the week is from JC Parets at All Star Charts. He broke out the stocks with the highest short interest that are making new highs. This chart indicates which stocks could be setup for a possible short squeeze. I wasn’t aware that some of these companies had such high levels of short interest.
Moves I’ve Made
S&P 500 Index This week I added to my S&P 500 index position.
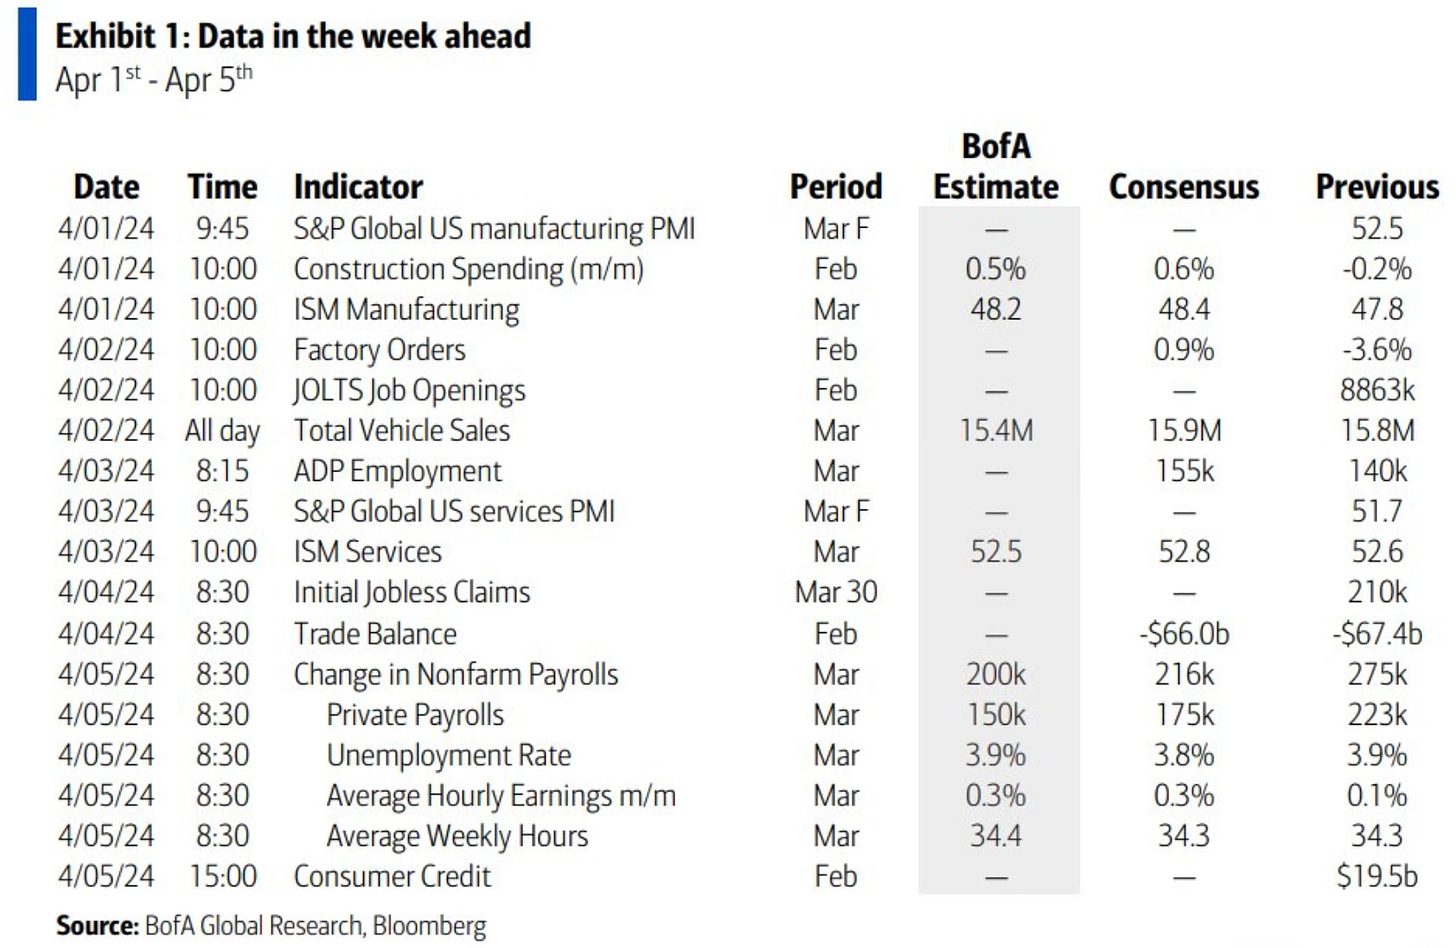
Upcoming Data
The Coffee Table ☕
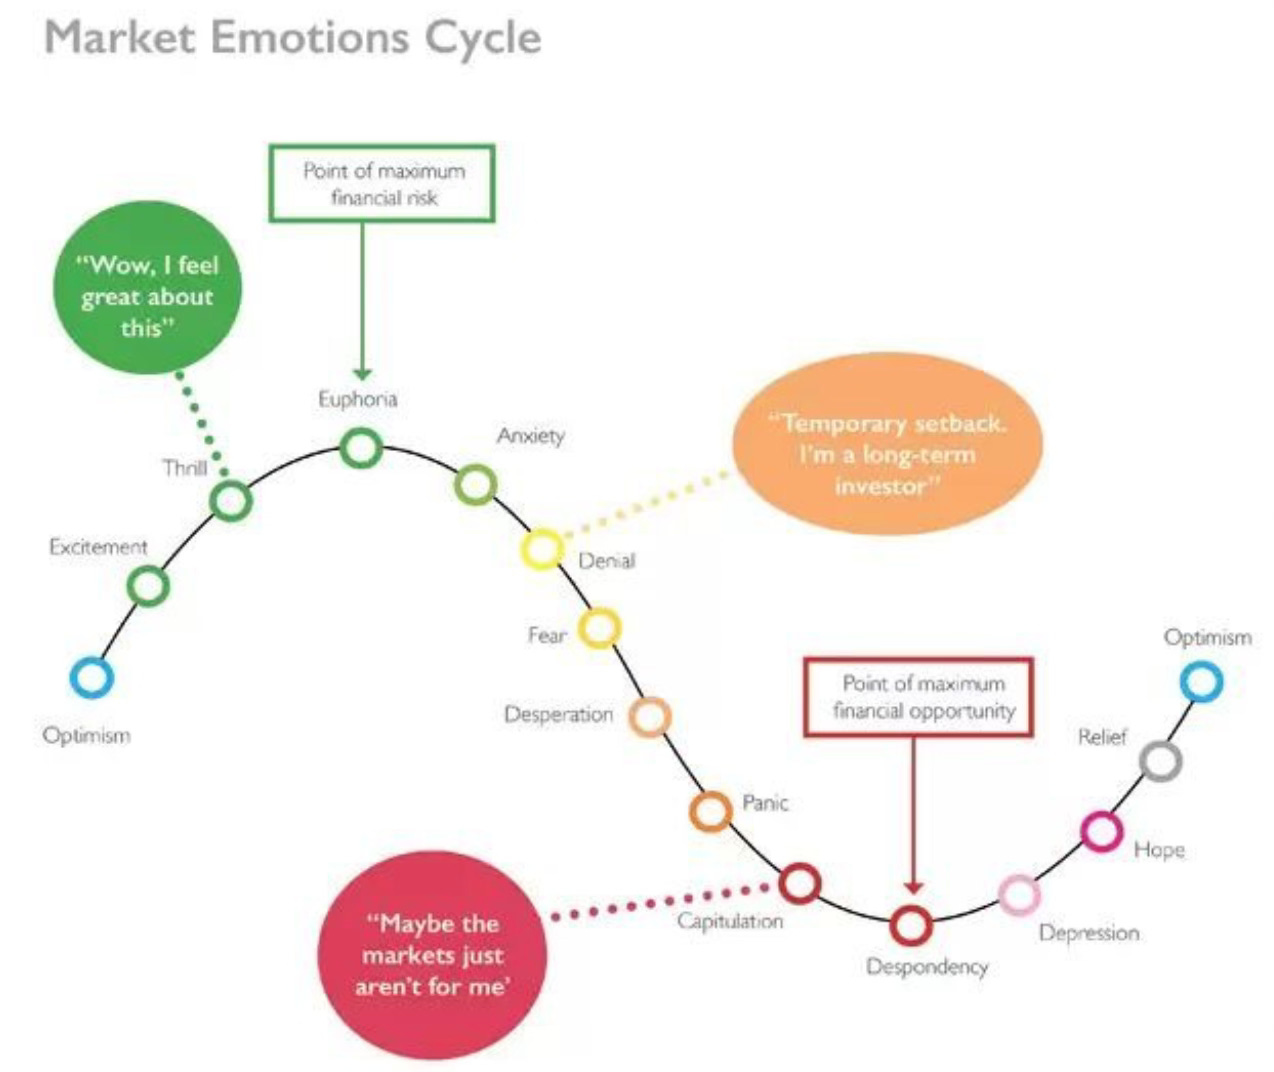
Tony Isola wrote an excellent piece called The Only Thing We Have To Fear Is The Fear Of Missing Out. Tony’s start summarizes things perfectly, “Sometimes we do stupid shit, and everything works out. On most occasions, it doesn’t.” Such a good reminder is that we’re never as smart as we think. This was a great visual from the post and one worth hanging onto and remembering.
My wife and I have started watching Curb Your Enthusiasm. We’re a few season sin and it’s like a modern day Seinfeld. It’s so funny. Larry David who created Seinfeld, is the creator and stars as the fictional version of himself. Like Seinfeld the show centers around life’s annoyances. The half hour episodes are the perfect thing to watch before bed with no shortage of laugh out loud moments.
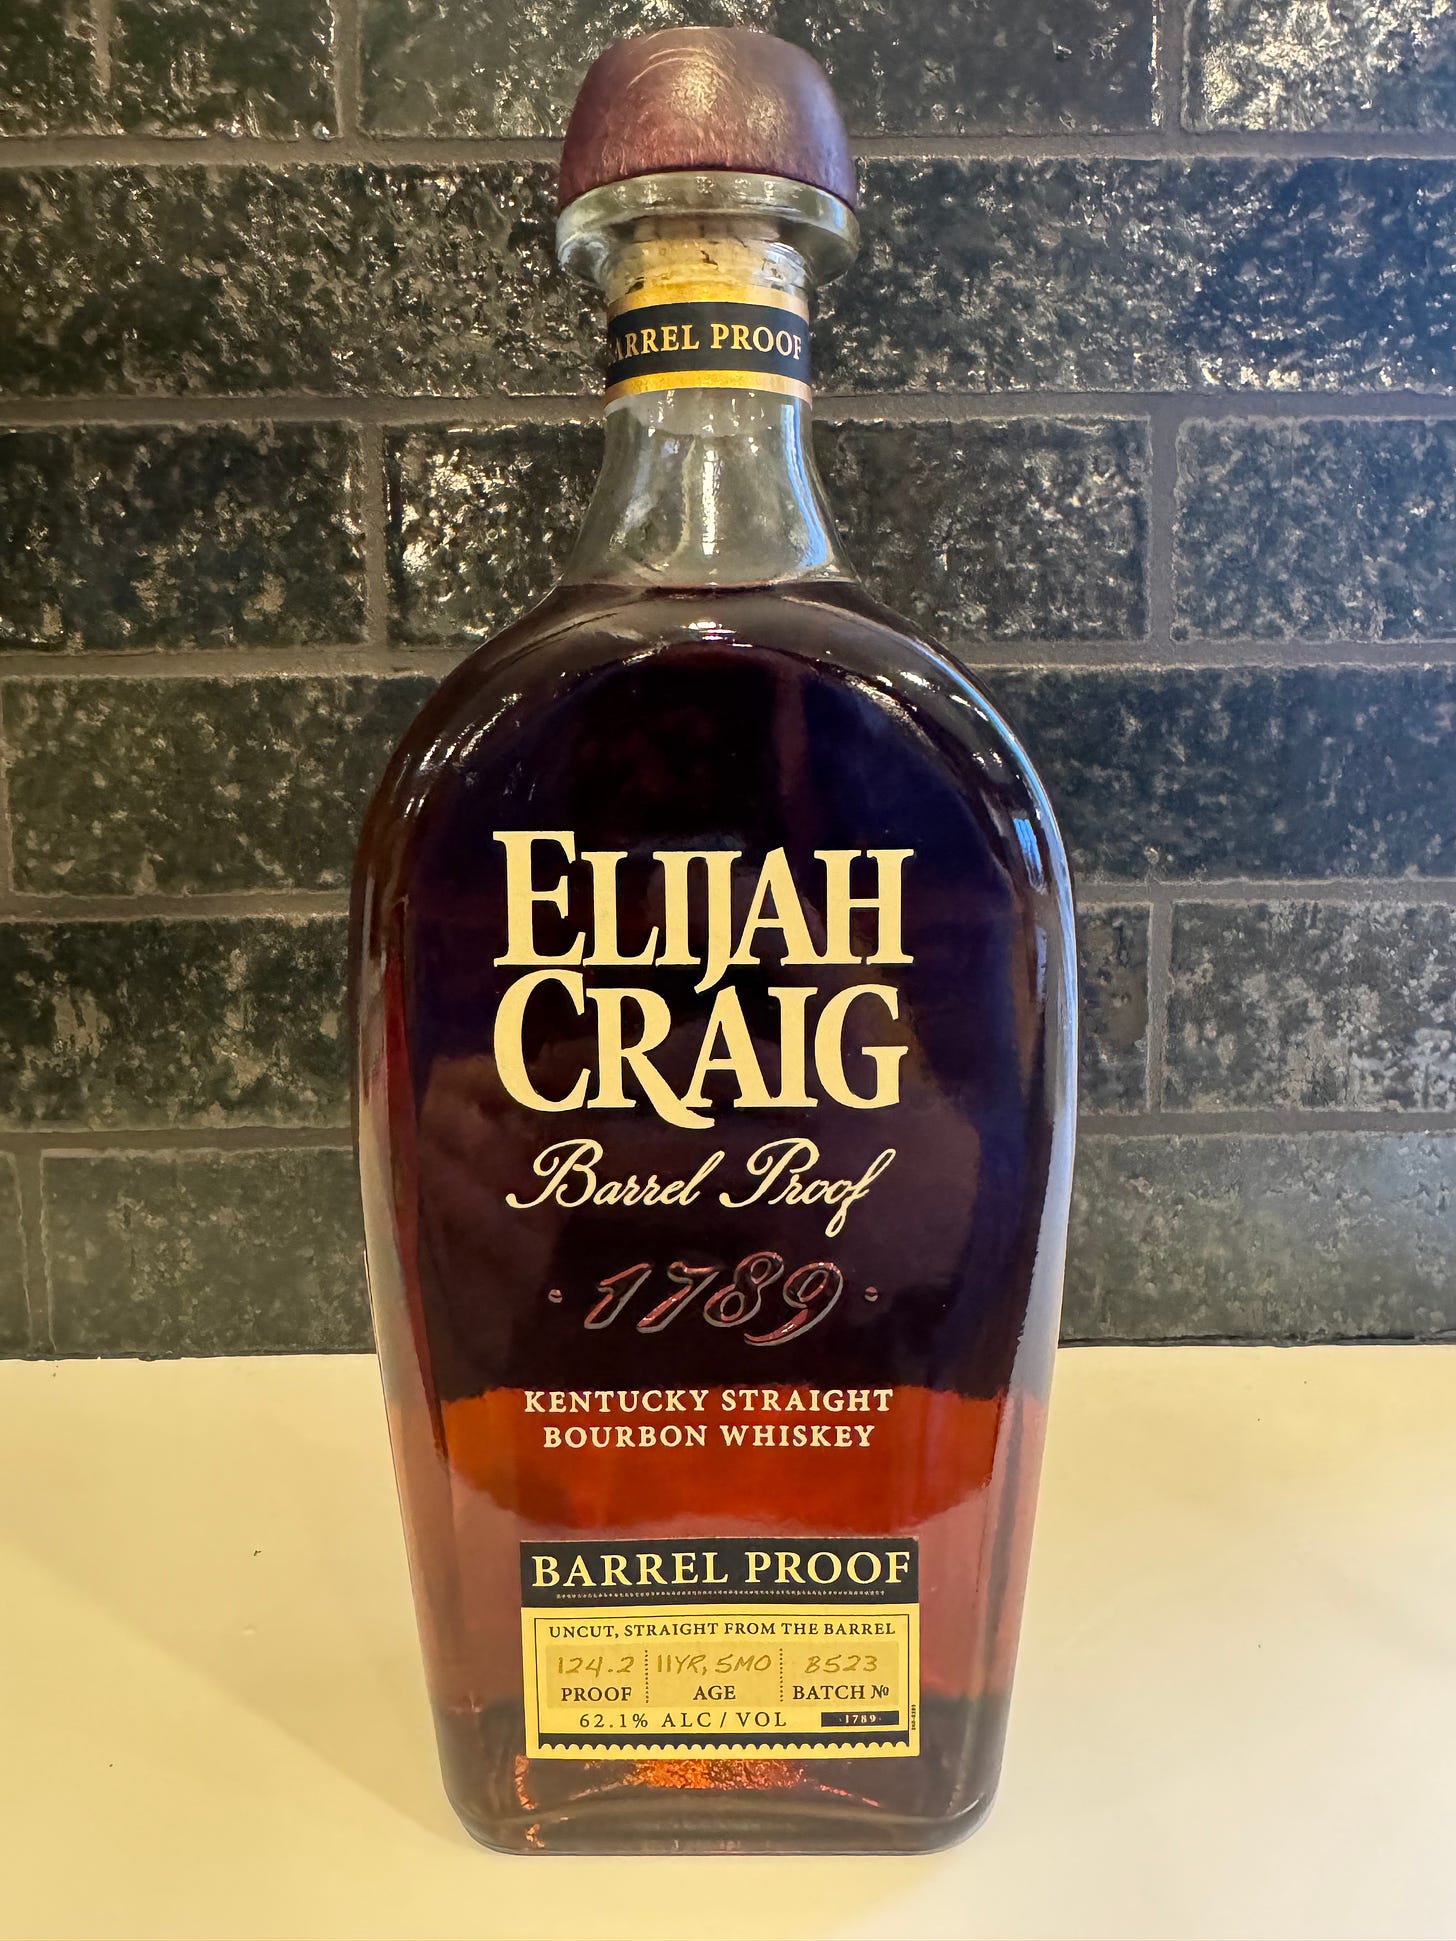
I recently tried Elijah Craig Barrel Proof. Uncut and straight from the barrel at 124.2 proof, the B batch came across quite nicely. The notes are very fruity, blended with graham cracker and vanilla. To taste a lot of the same shined through along with some toasted nuts and cinnamon. There is a little heat but nowhere near the level I expected. This was a very good bourbon. I now see why this is a loved bourbon among bourbon lovers. This will have a place on my shelf.
Thank you for reading! If you enjoyed Spilled Coffee, please subscribe.
Spilled Coffee grows through word of mouth. Please consider sharing this post with someone who might appreciate it.
Order my book, Two-Way Street below.


