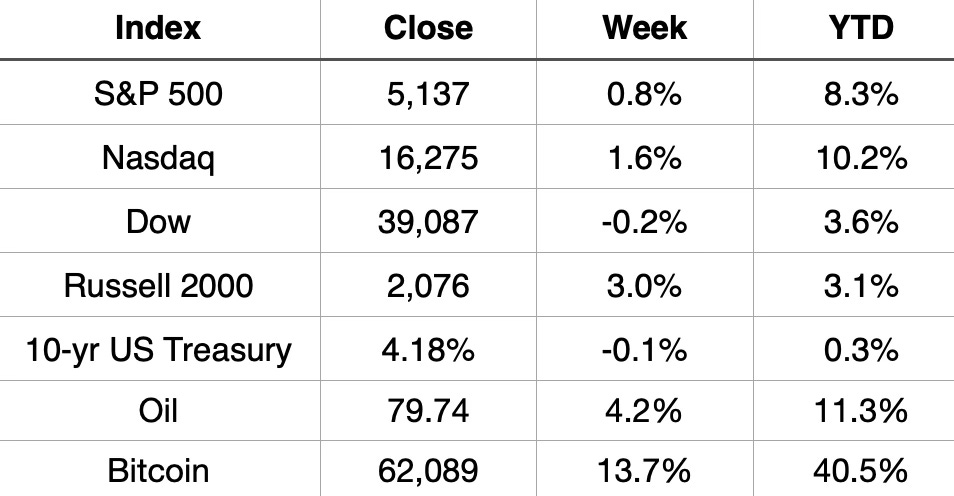
Make it another week of new all-time highs. The S&P 500 and Nasdaq both ended the week at fresh new all-time highs.
The Nasdaq took out the previous high from November 2021 to hit the highest level in history. It finished February up 6.1%.
The S&P 500 just continues to break new records which seems like every week of late. It’s has been positive for 4 straight months. It finished February which is historically one of the weakest months of the year up 5.2%. That’s the 5th strongest February since 1980. The best finish to a February since 2015.
In addition, we continued to see the expansion in new highs in other areas. Gold hit a record high. Small-caps have hit a 52-week high. Mid-caps hit a new all-time high. Bitcoin has surged over 62,000.
A lot is currently working. Investors are very happy. But will so much continue to work?
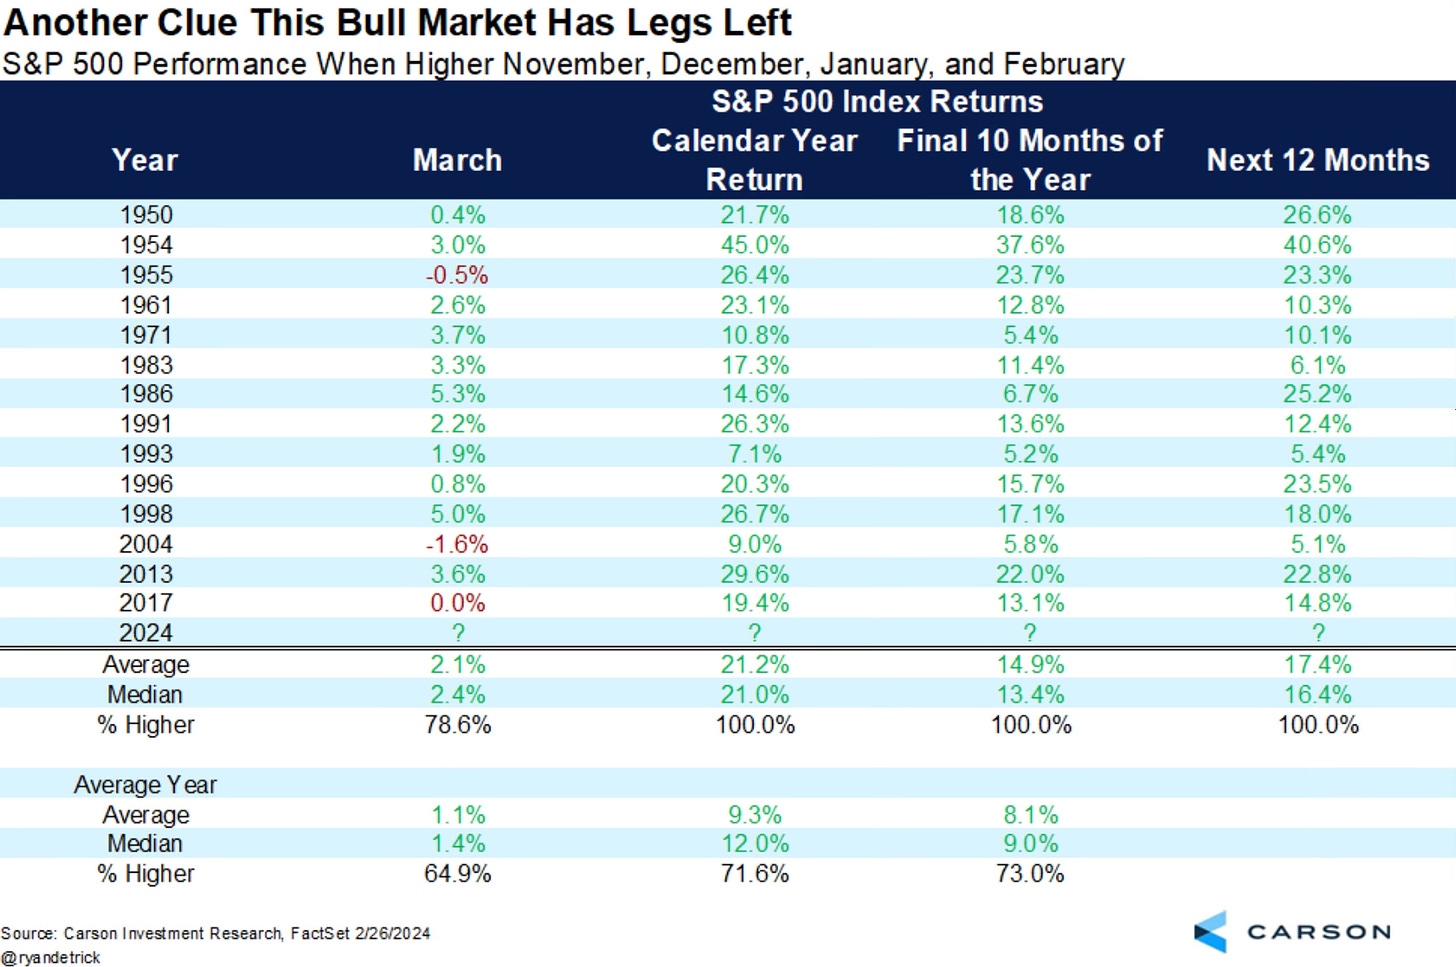
If we look historically, there have been 14 times when November, December, January and February have been positive. In all of those 14 instances the calendar year return has been positive with a return of 21.2% on average. What will the 15th time do?
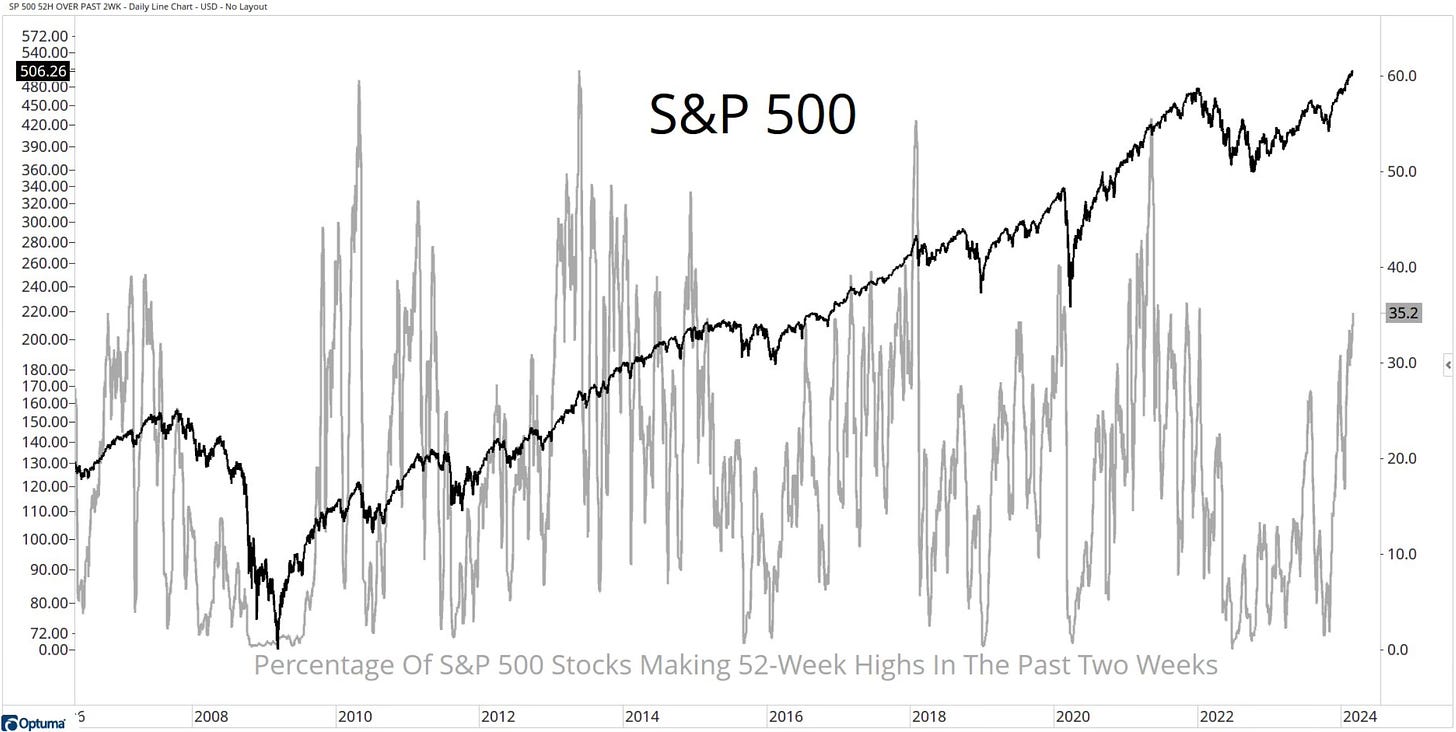
The chart below shows the continued strength under the surface with the S&P 500 stocks seeing more new highs than new lows for now 77 straight days.
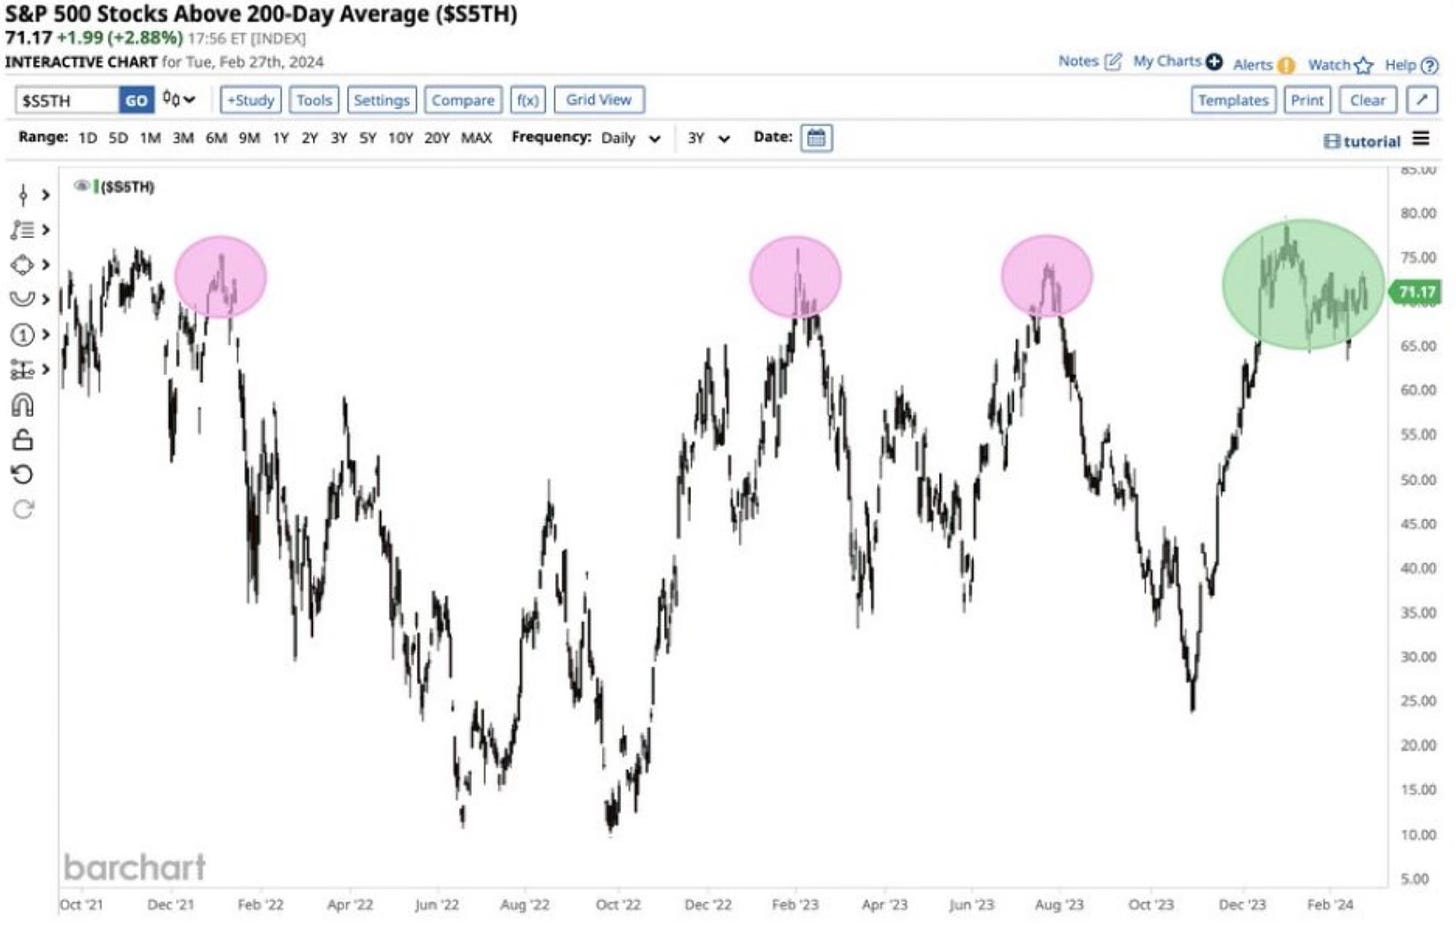
71% of S&P 500 stocks are now above their 200-day moving average.
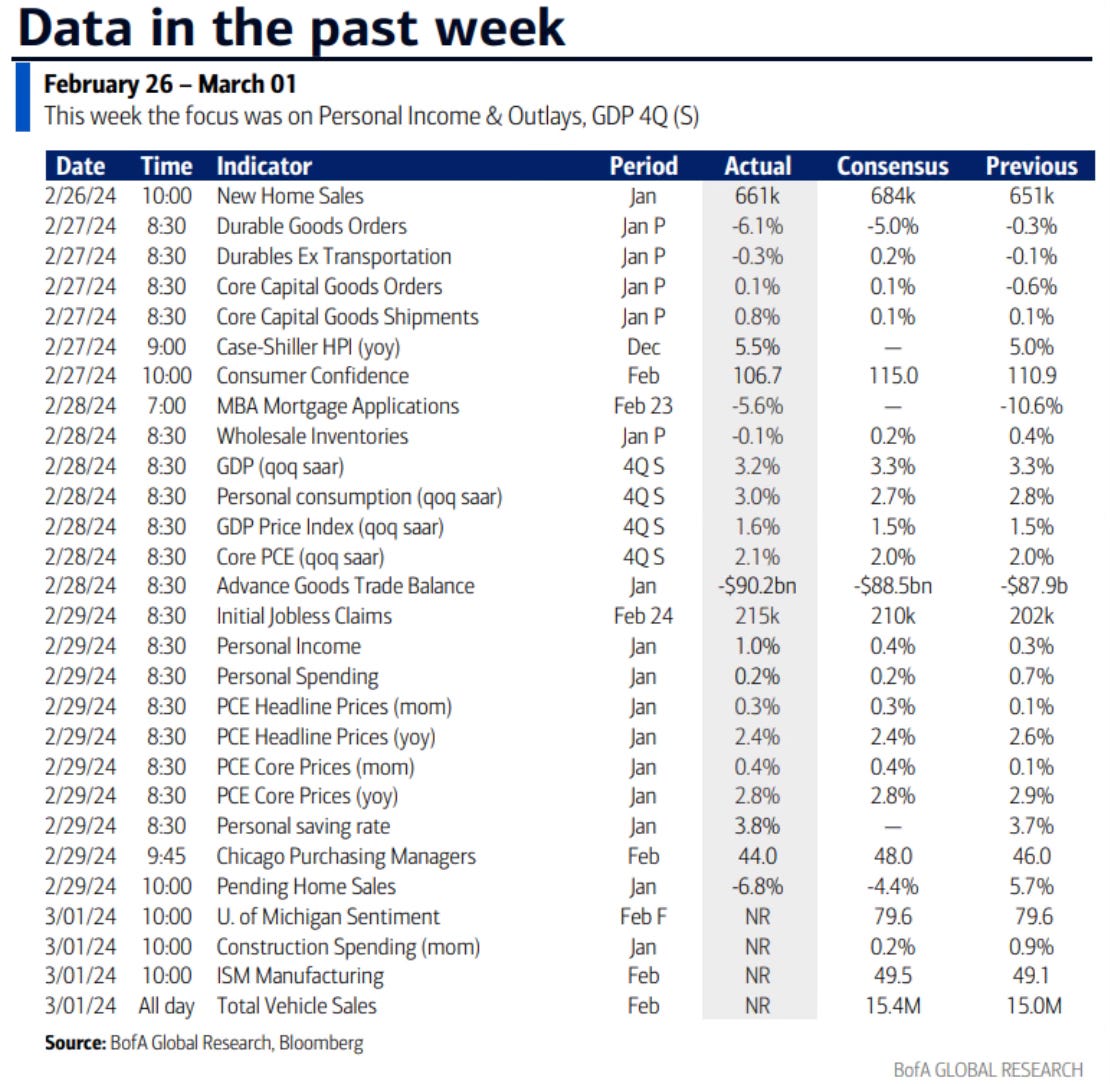
Market Recap
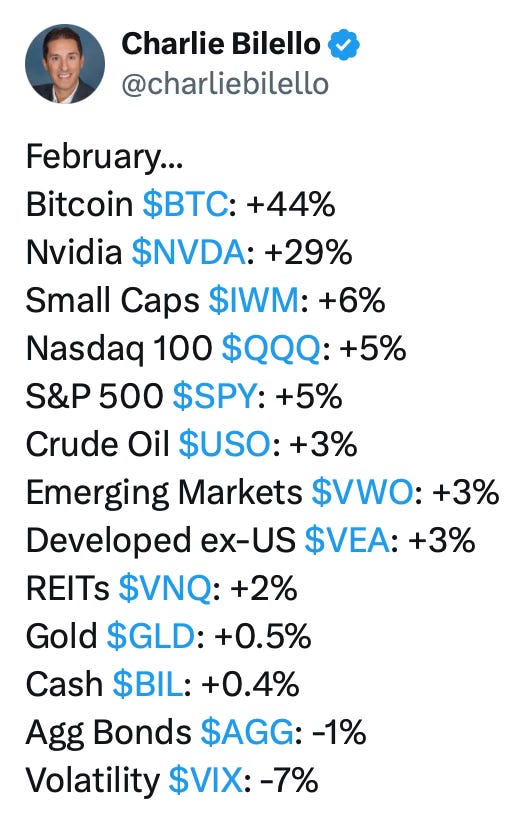
Recapping February
Here are some highlights from February. It’s interesting to see what various things returned.
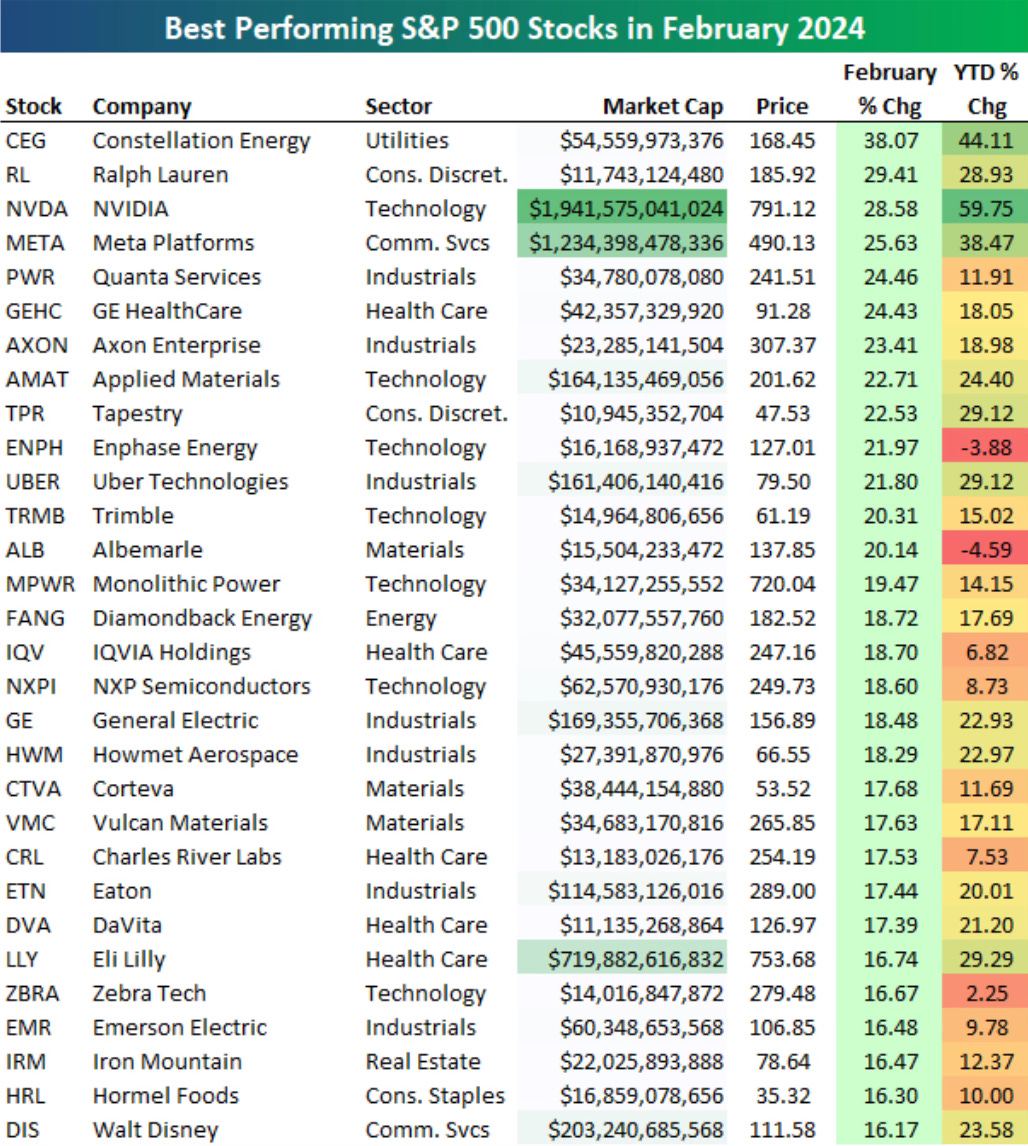
These are the best performing stocks in the S&P 500 in February.
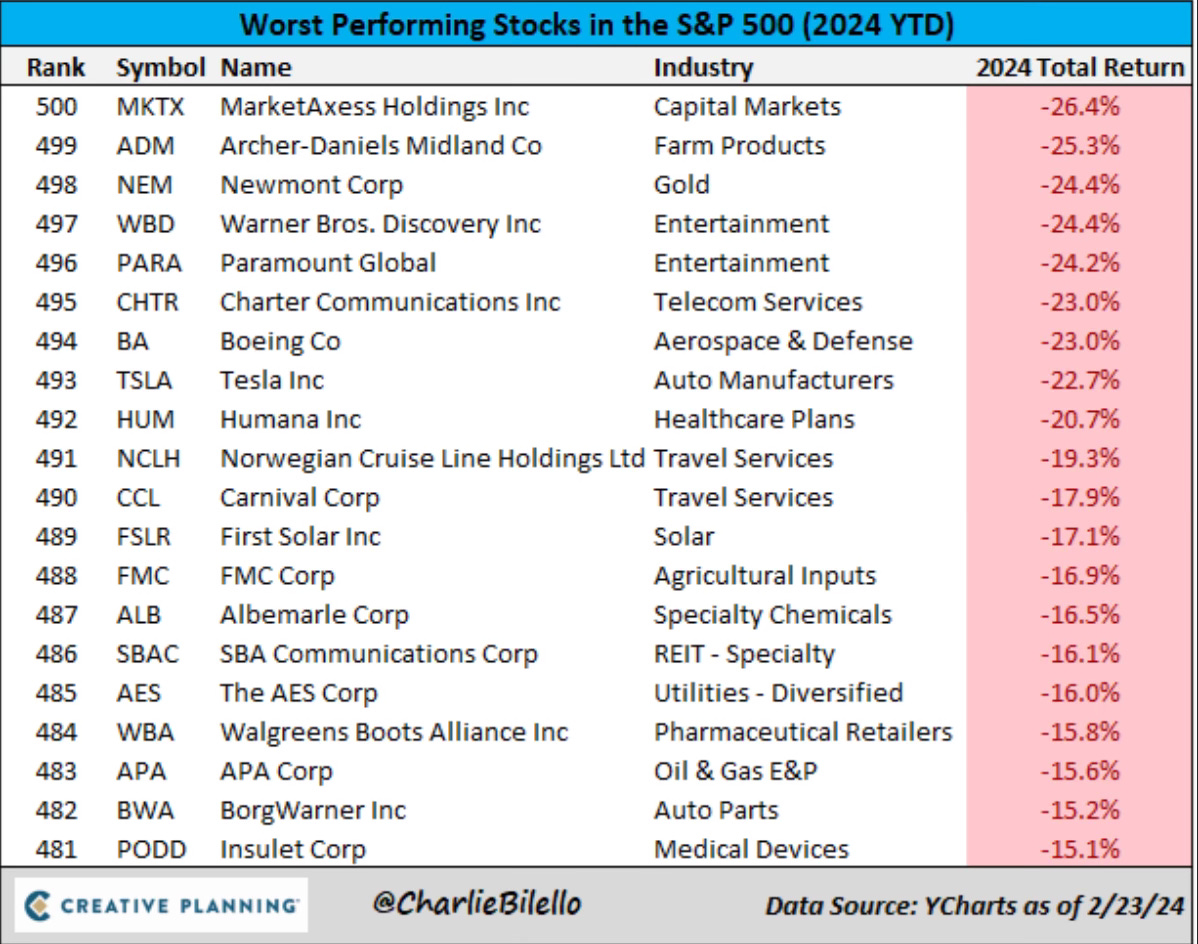
Then we have the worst performers so far in 2024. Through the first two months of the year Tesla has really been struggling. They’re currently the 8th worst performer of the 500 companies.
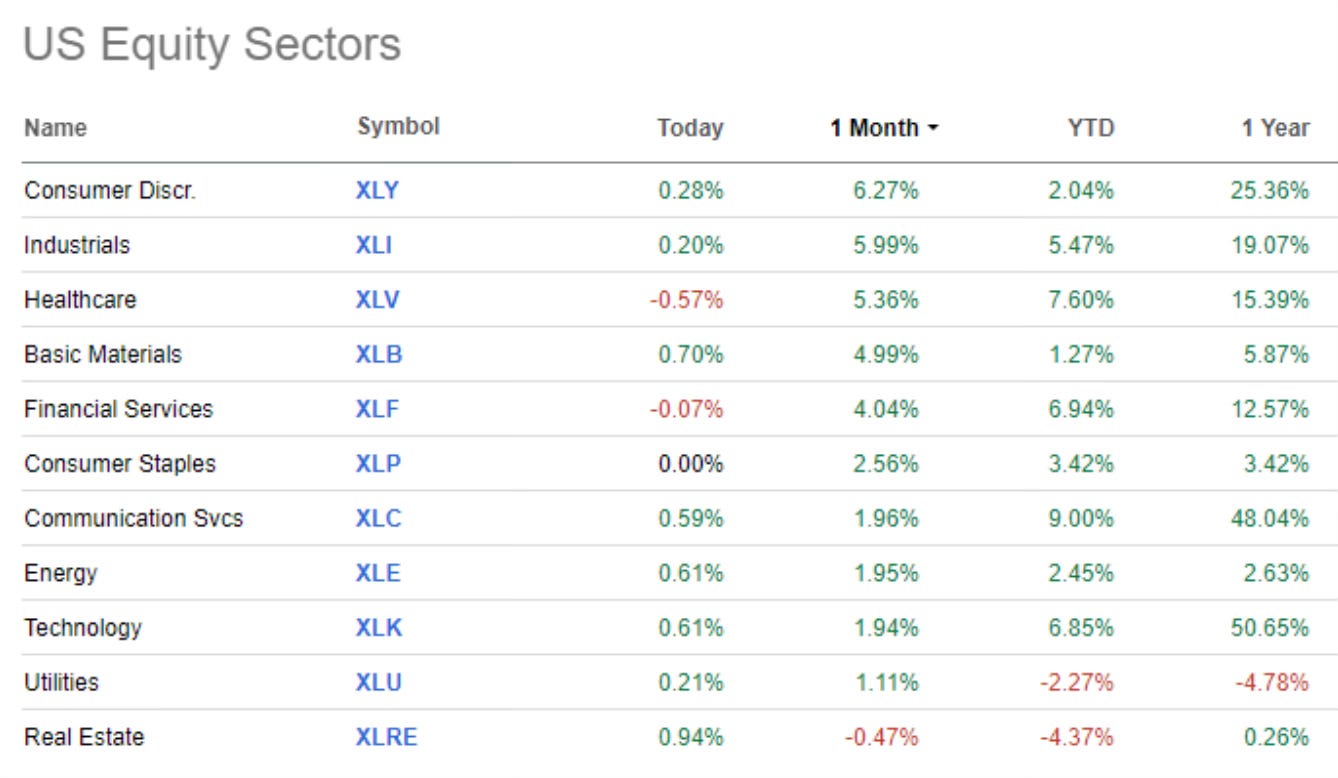
As we look at the sector returns, I was surprise by the fact that energy outperformed technology in February.
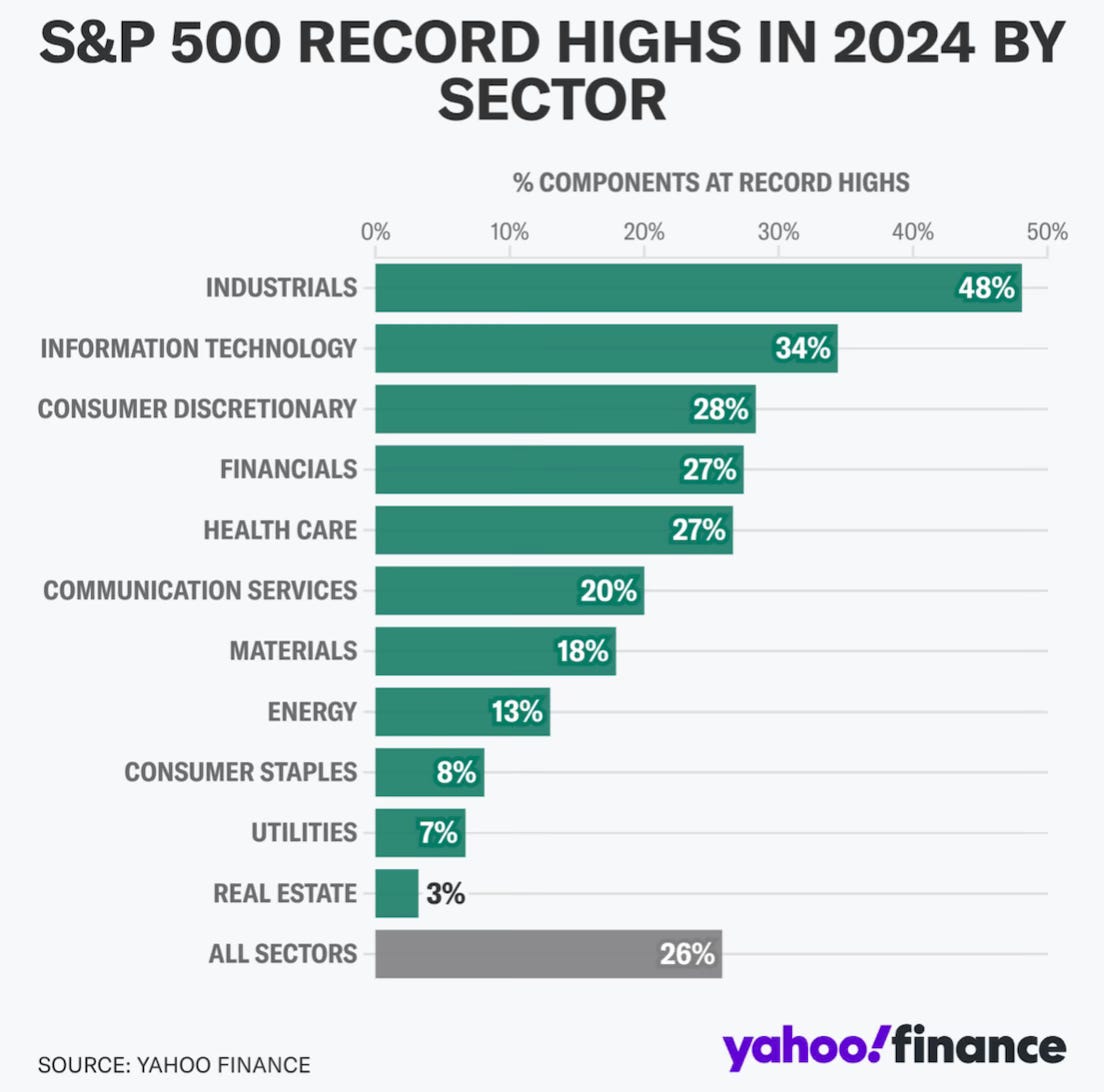
Then there is this interesting chart that shows the percentage of components within each sector that are at record highs. Another surprise is that industrials lead the way by a wide margin.
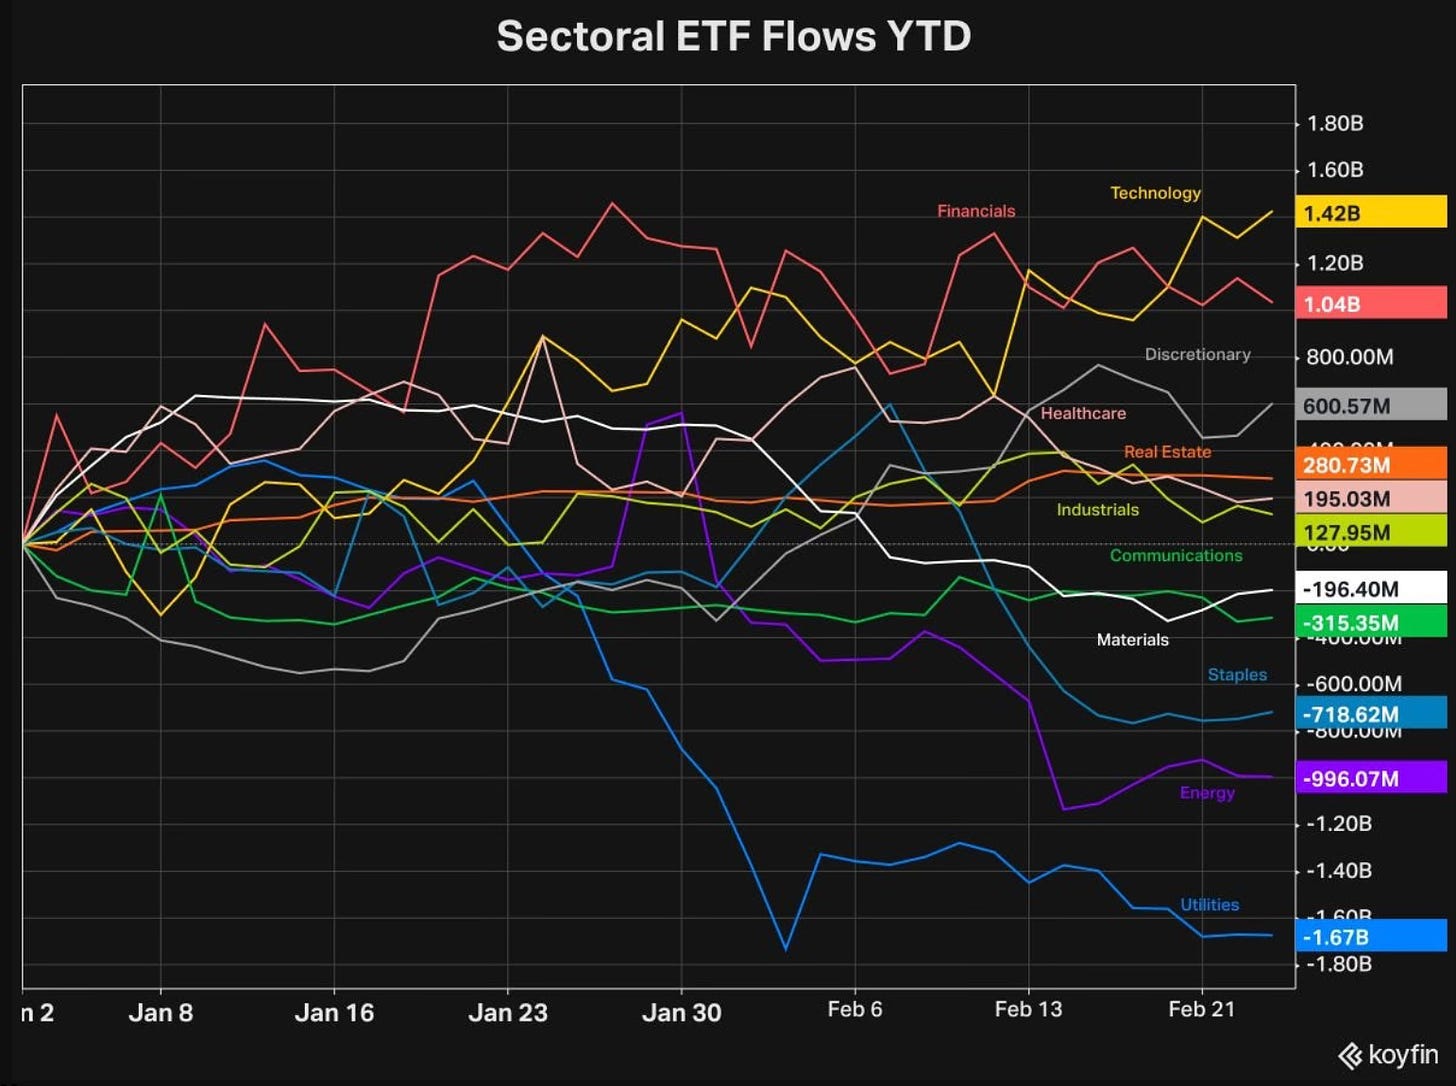
This chart shows where the flows have been coming from for each sector. Technology is still seeing massive inflows.Health care is seeing a big uptrend.
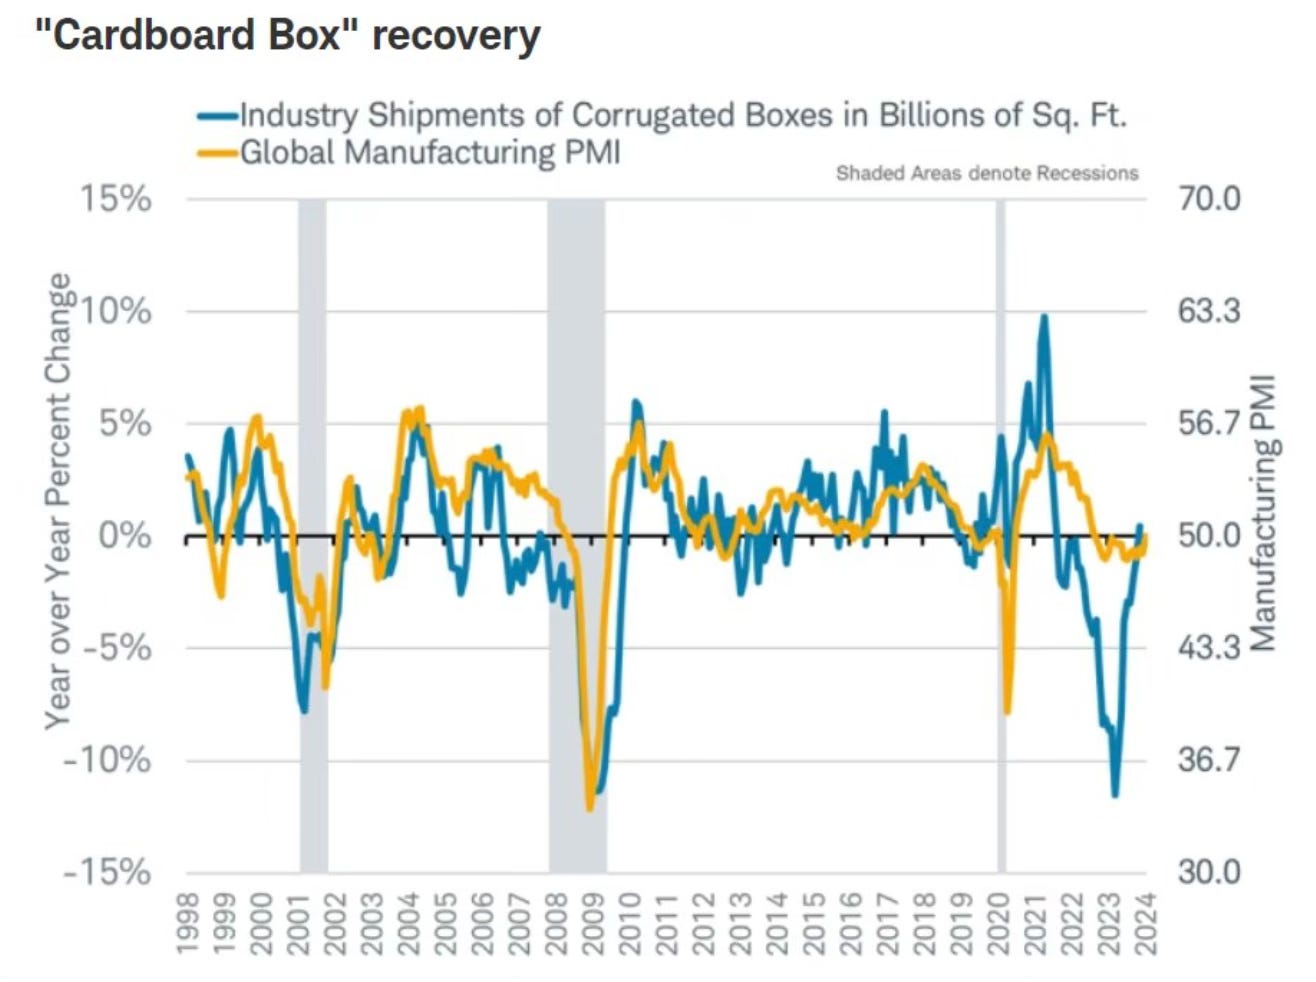
The Cardboard Box Recession Ends
One measure that has been of interest is what the cardboard box production has been. It’s simply the measure of demand for cardboard boxes. If it’s lower that indicates a slowing demand for consumer goods.
We’ve now seen a cardboard box recession swing to a cardboard box recovery.
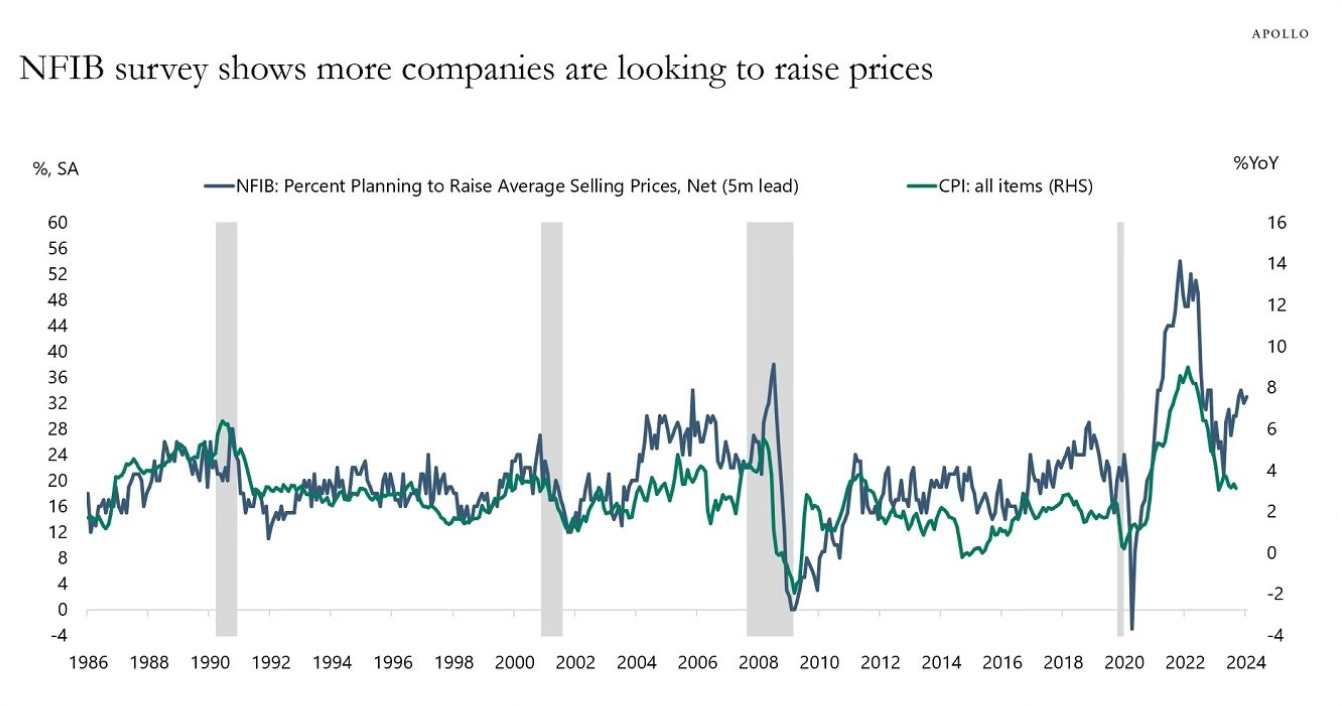
We’re also seeing that small businesses are looking to raise prices. It could affect inflation but on the positive side is that there is still strong demand from consumers for products and services.
“The NFIB survey of small businesses asks 10,000 firms if they plan to increase selling prices over the next three months. The recent acceleration in the share of firms saying yes suggests that CPI inflation could increase over the coming months.” -Torsten Sløk
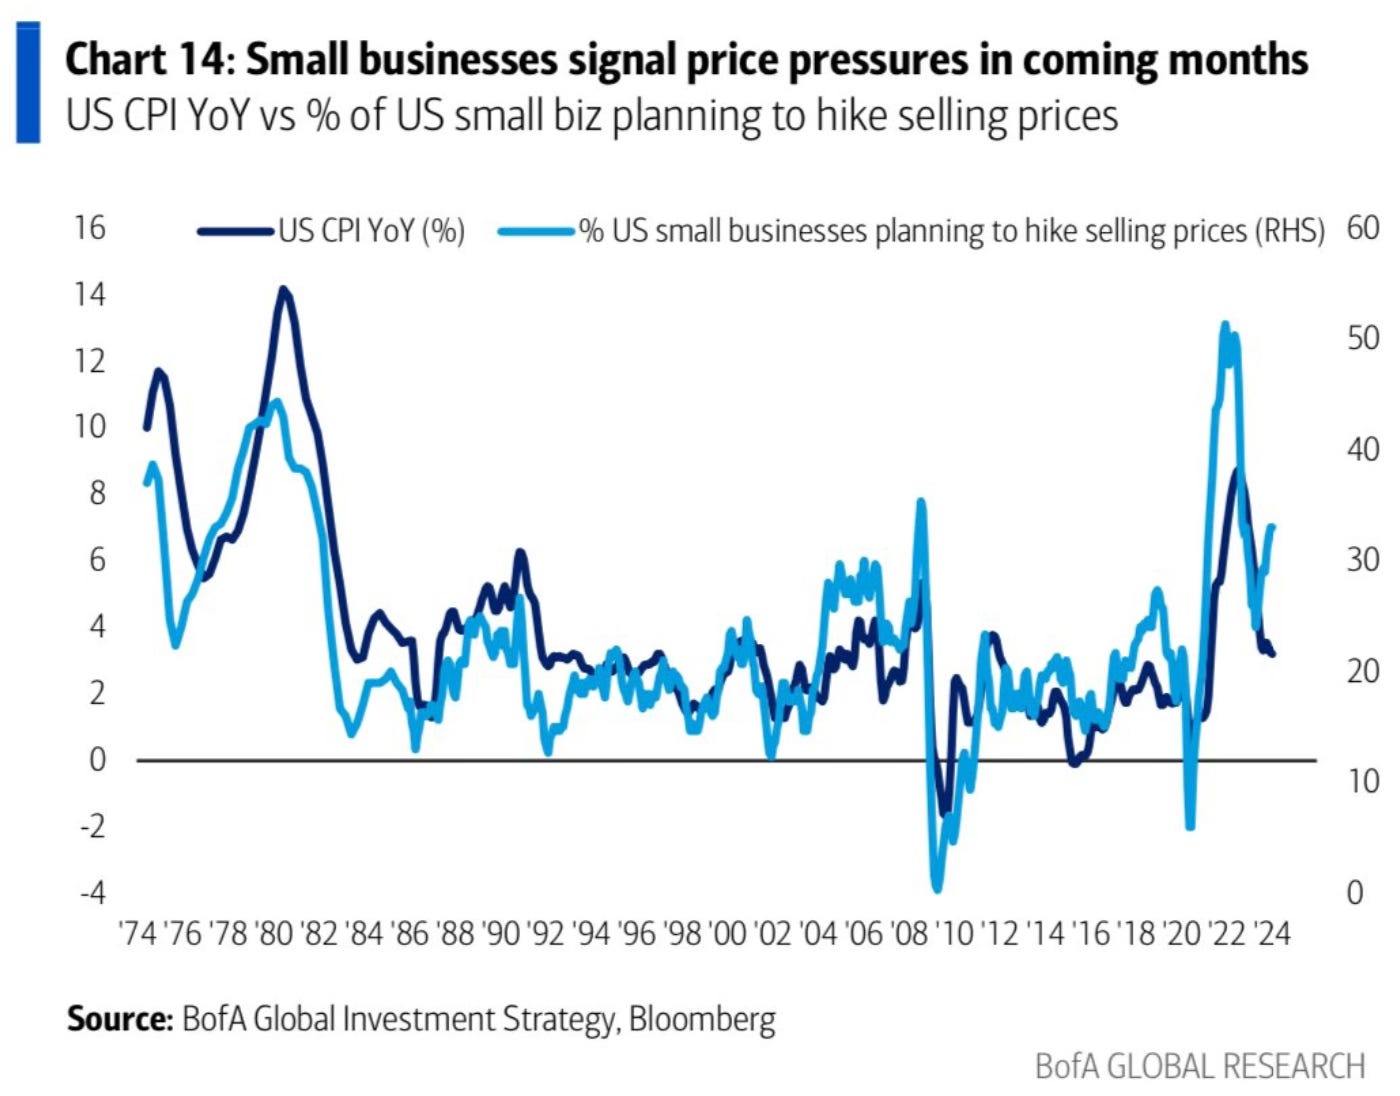
Here is a look to see how the raising of prices correlates with CPI. A great chart that shows the possibility that a reignition of inflation could come.
Hold The Bubble Talk
We’ve started to hear a lot of talk about bubbles. This is a bubble and that is bubble. It’s interesting to hear from so many that were saying that this bull market was just a bear market rally go right to say this is a bubble.
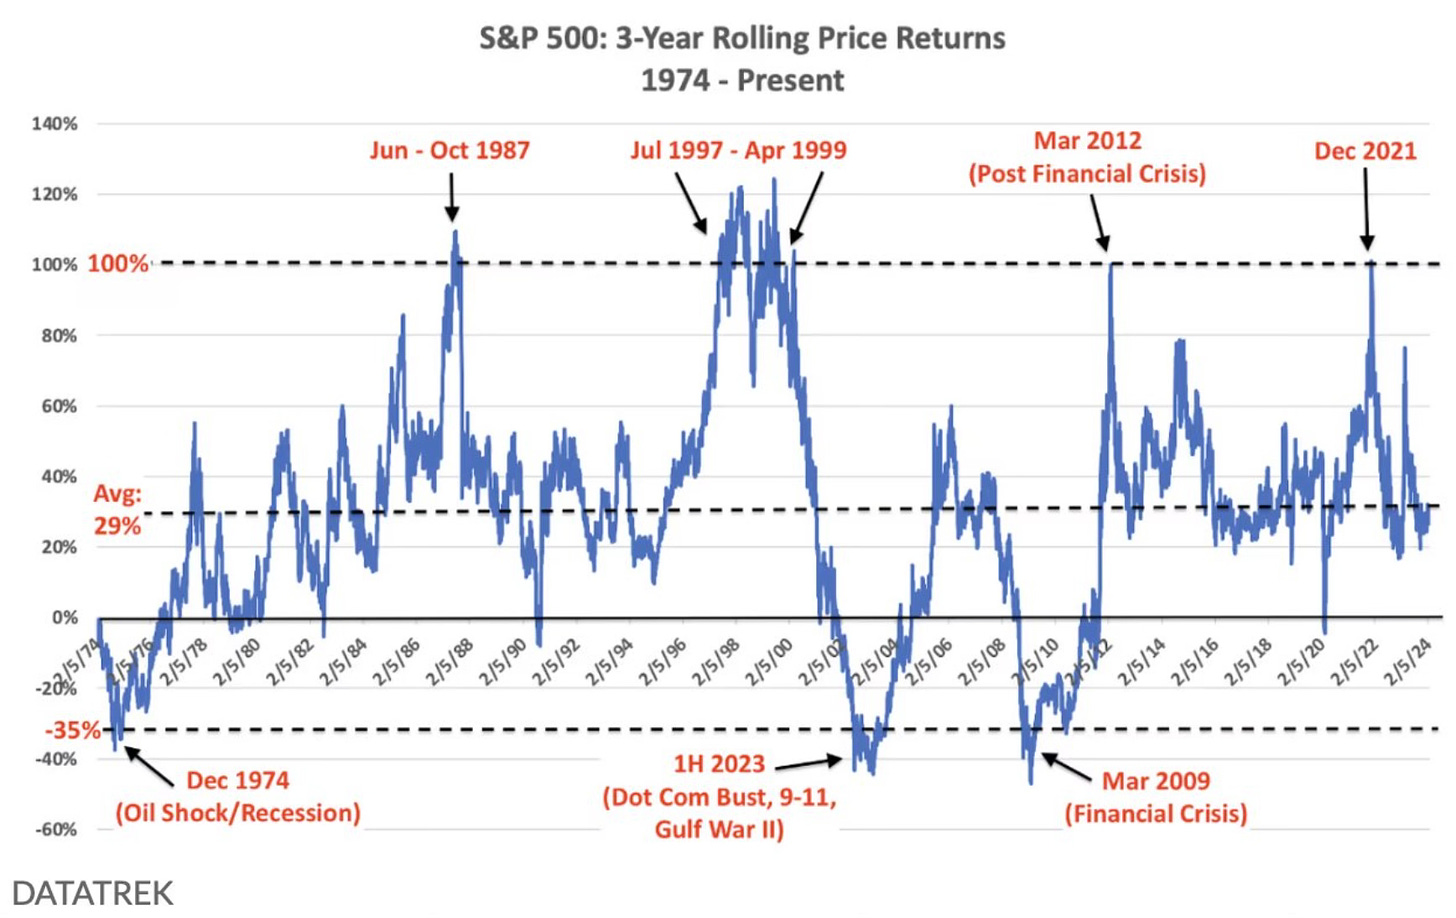
Bubble talk right now is premature. I think many forget what a bubble really means. It doesn’t mean a pullback, it means a complete collapse. There technically have been very few bubbles. This was a great chart done by Barchart that shows just that.
“Since 1974, the S&P 500 generated returns of at least 100% during the 3 years prior to every bubble peak. Over the last 3 years, the $SPX is only up about 31% which is basically right at the average rolling 3-year return. In other words, data shows this likely isn't a bubble.”
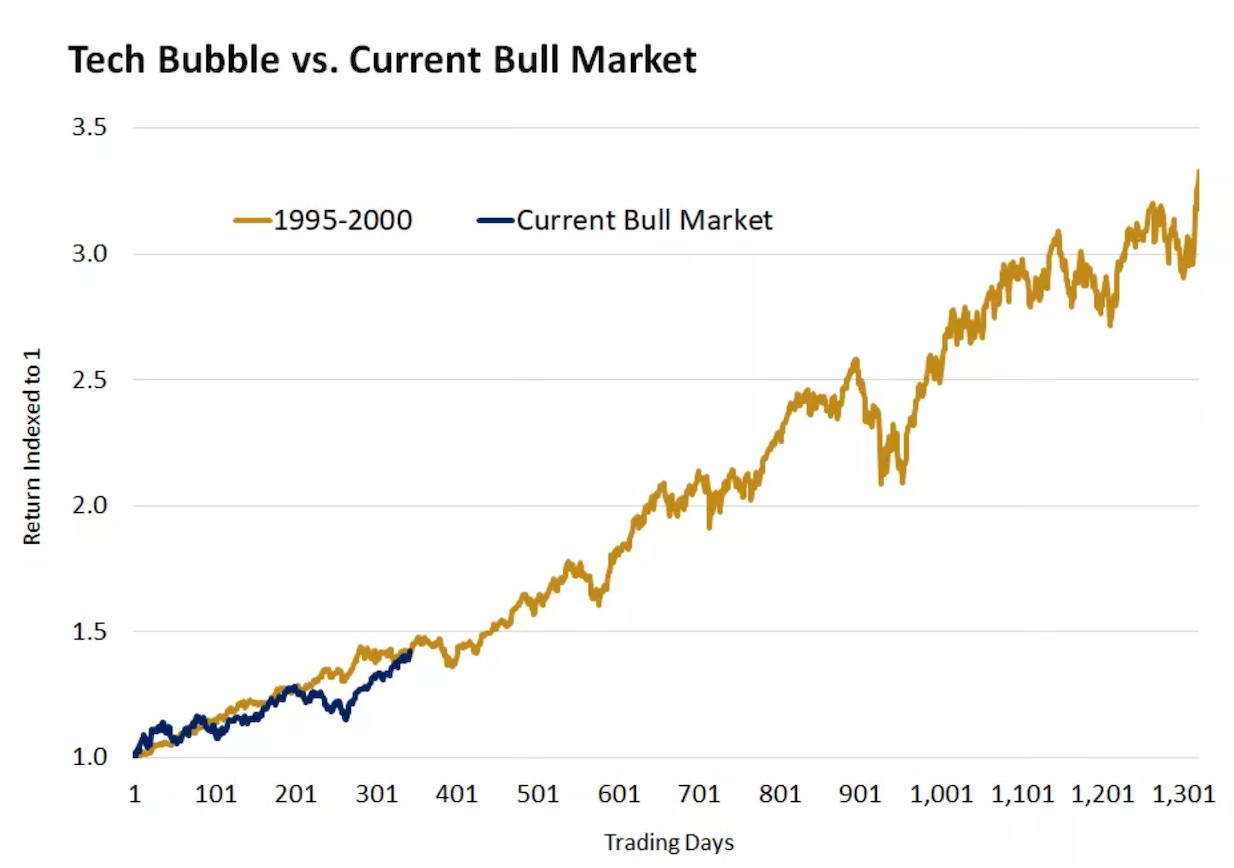
If you compare the tech bubble which is what most refer to or think of when they talk bubbles to this current bull market, you can see it has a long way to go. The trajectory is in line but it’s very early and just look at the number of days to reach what happened in the dot-com bubble.
A Risk-On Market
There has been a trend reversal happening of late. We’re seeing the risk-on market return. These were sold off the hardest during the last bear market. Now they’re starting to rip again.
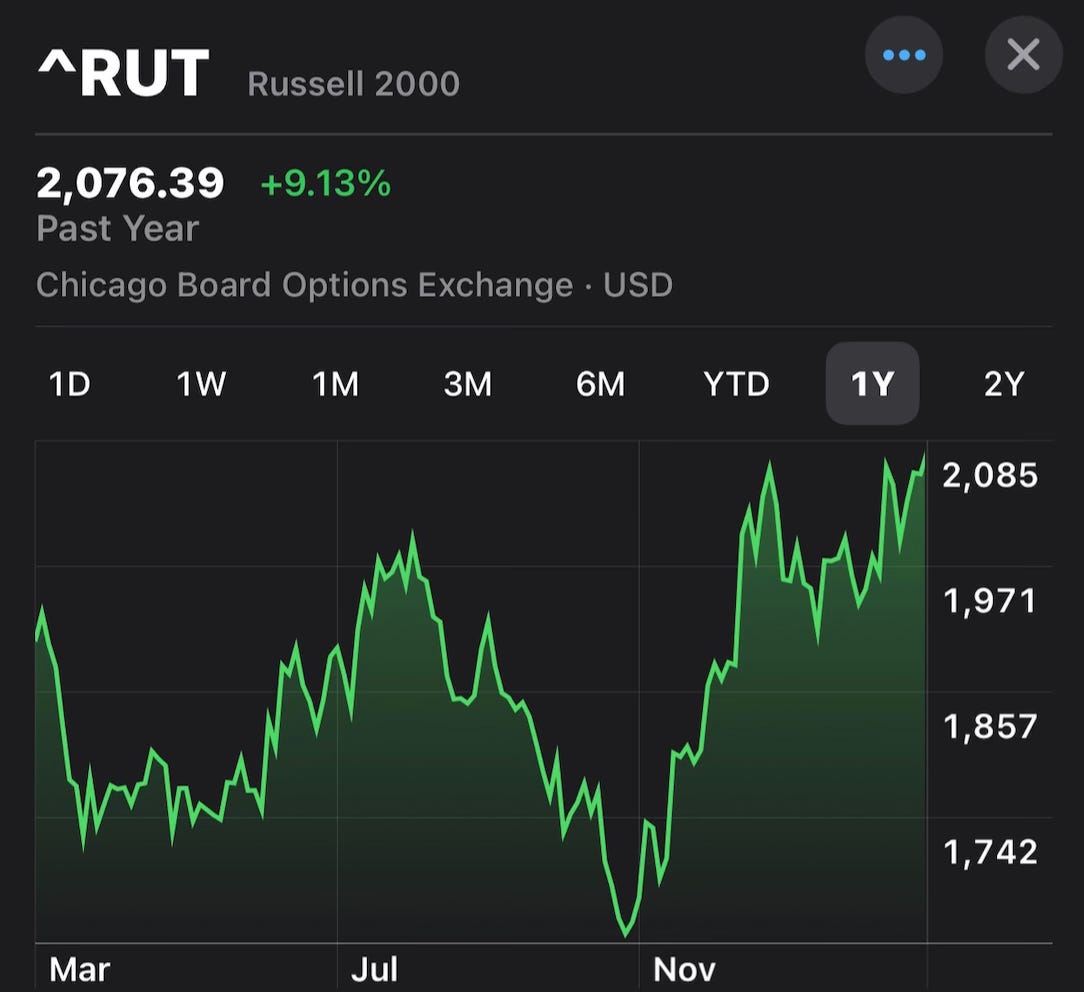
Small caps are now at a 52-week high. They’re at the highest level since March 2022
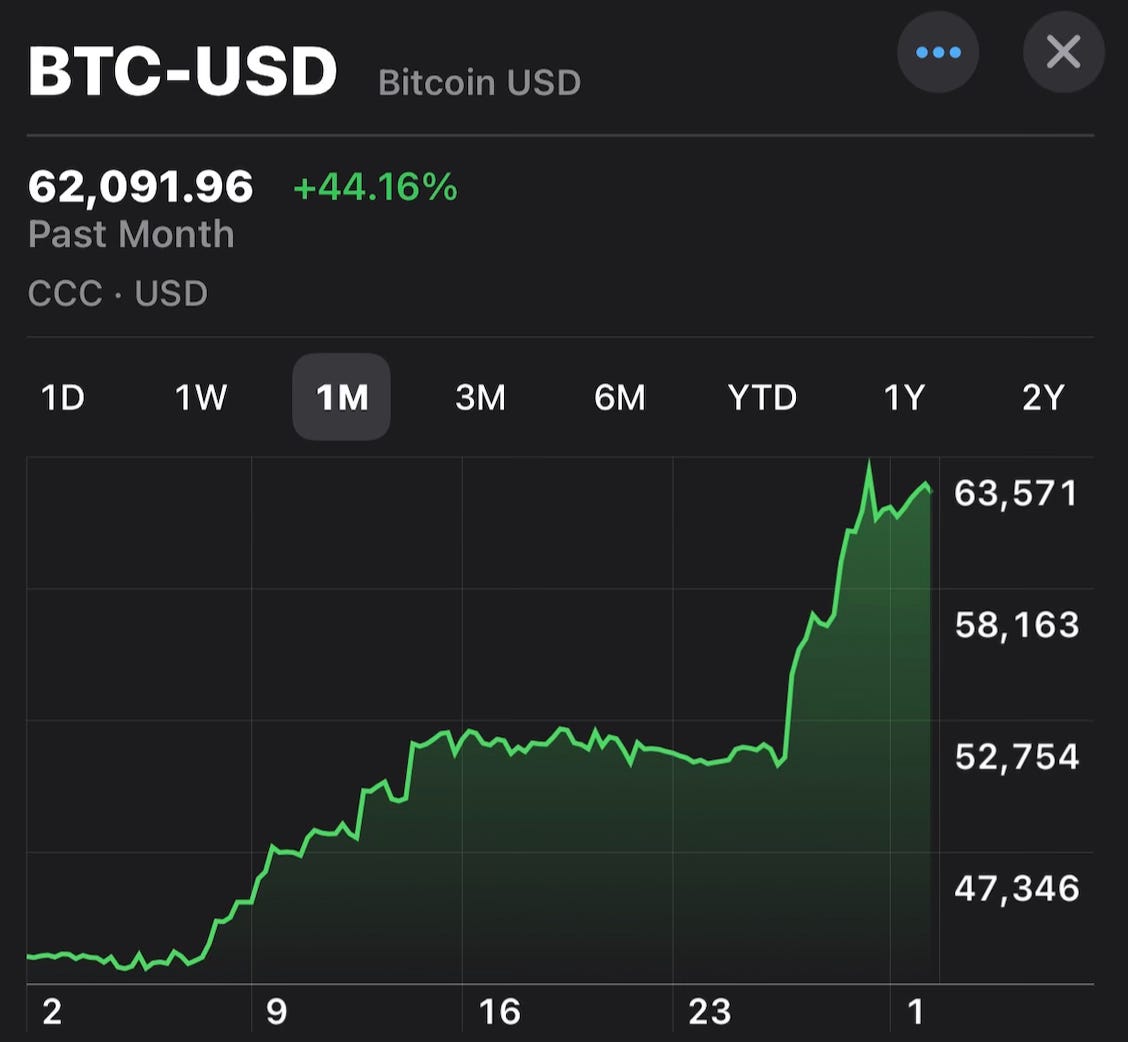
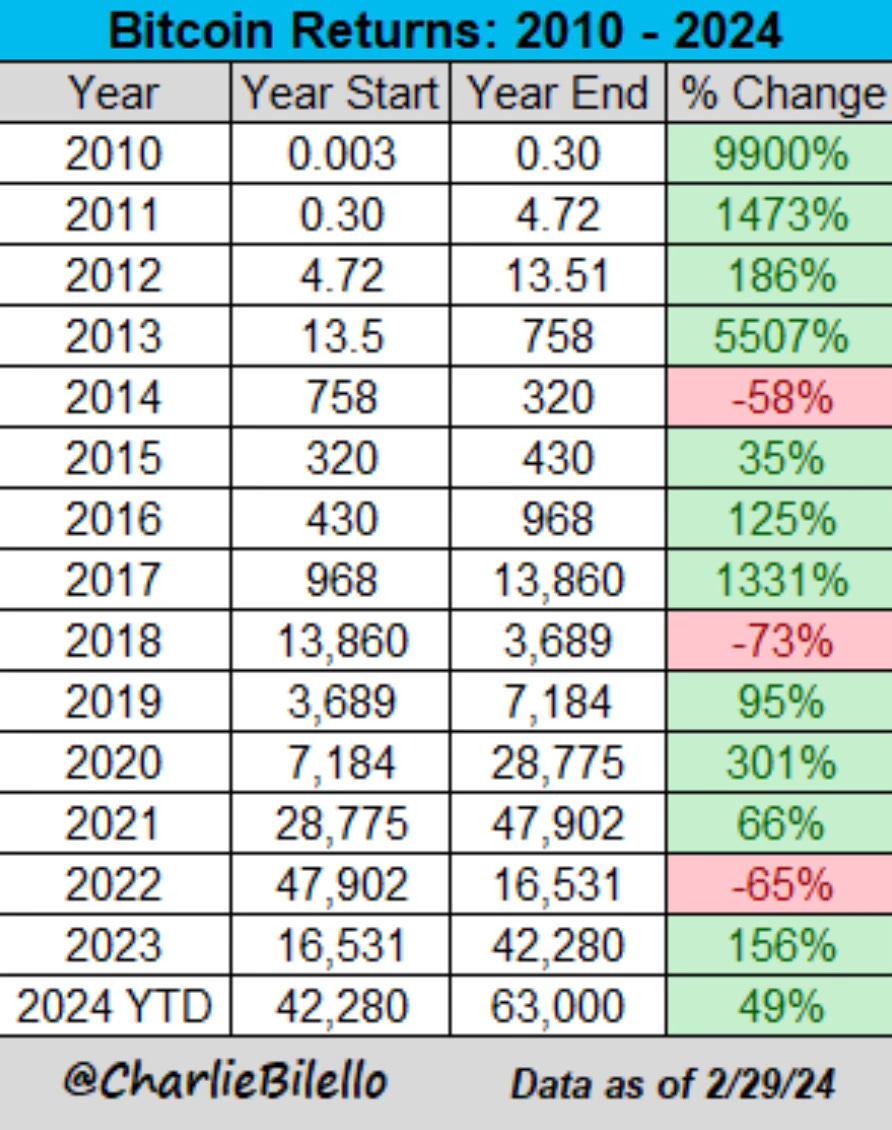
This week saw a blowoff top in Bitcoin. It went over 60,000 for the first time since November 2021. February was its best month since December 2020 up 44.16%.
These are the yearly returns for Bitcoin since 2010. When you talk high risk and high reward, Bitcoin is one of the first things you think of.
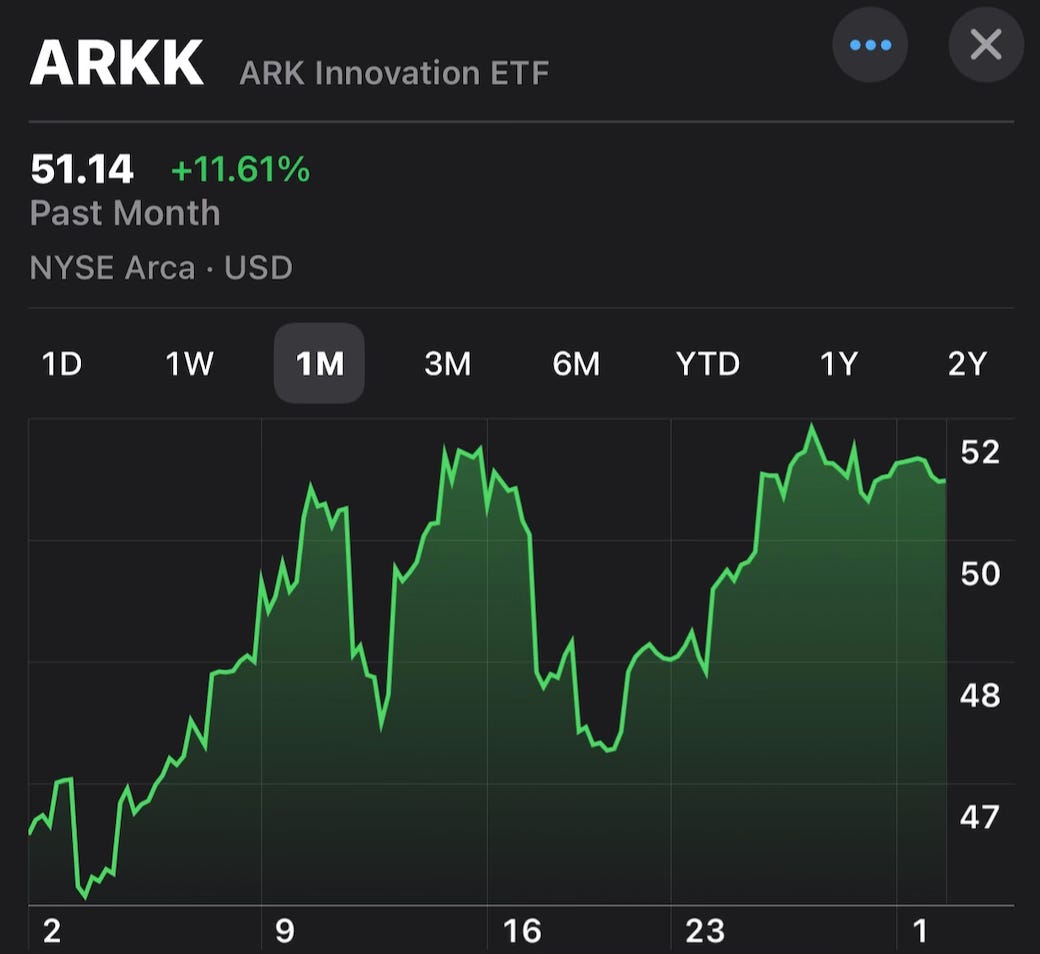
We’ve also seen the popular high risk ARKK ETF start to head higher.
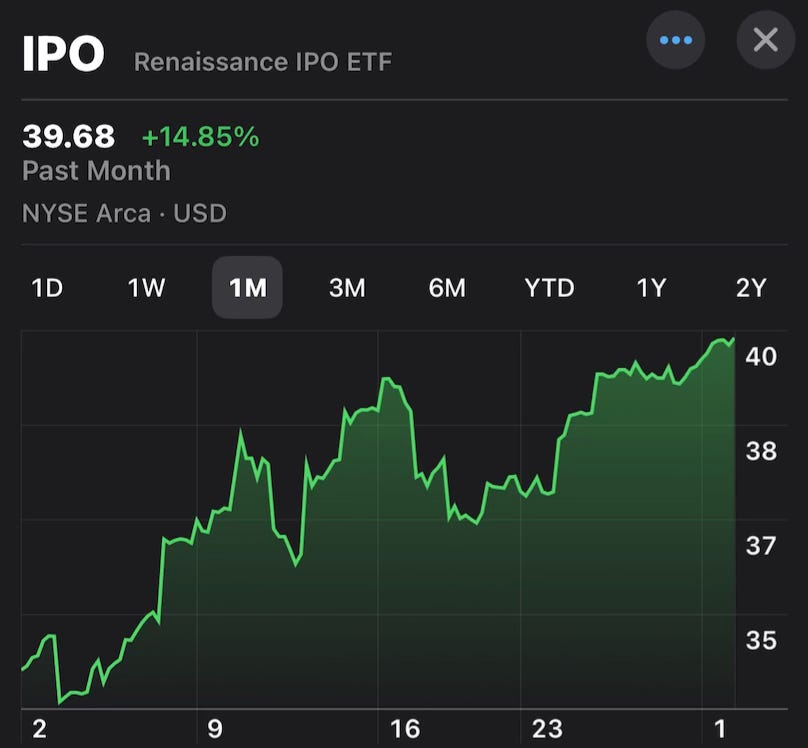
The Renaissance IPO ETF which is an index of companies that have recently completed an initial public offering (IPO) and are listed on a US exchange. It has also ripped in February.
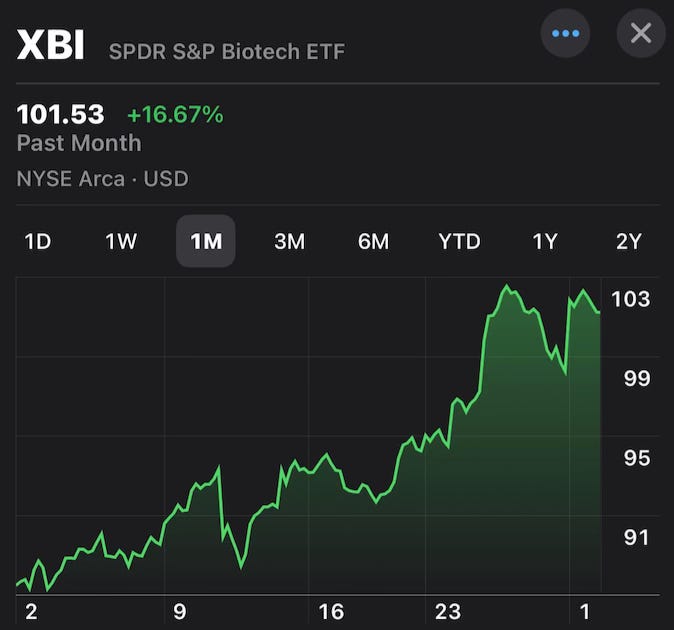
The XBI Biotech ETF has also took off.
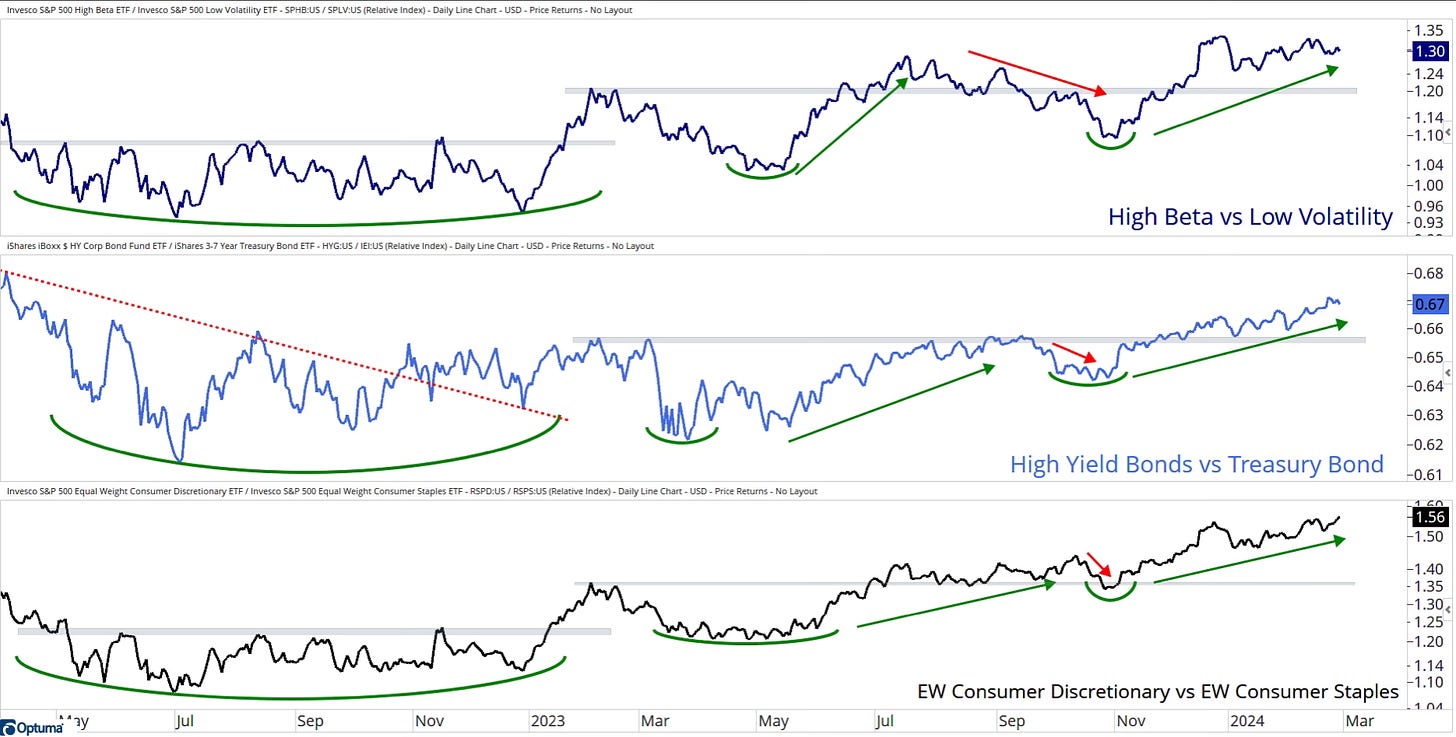
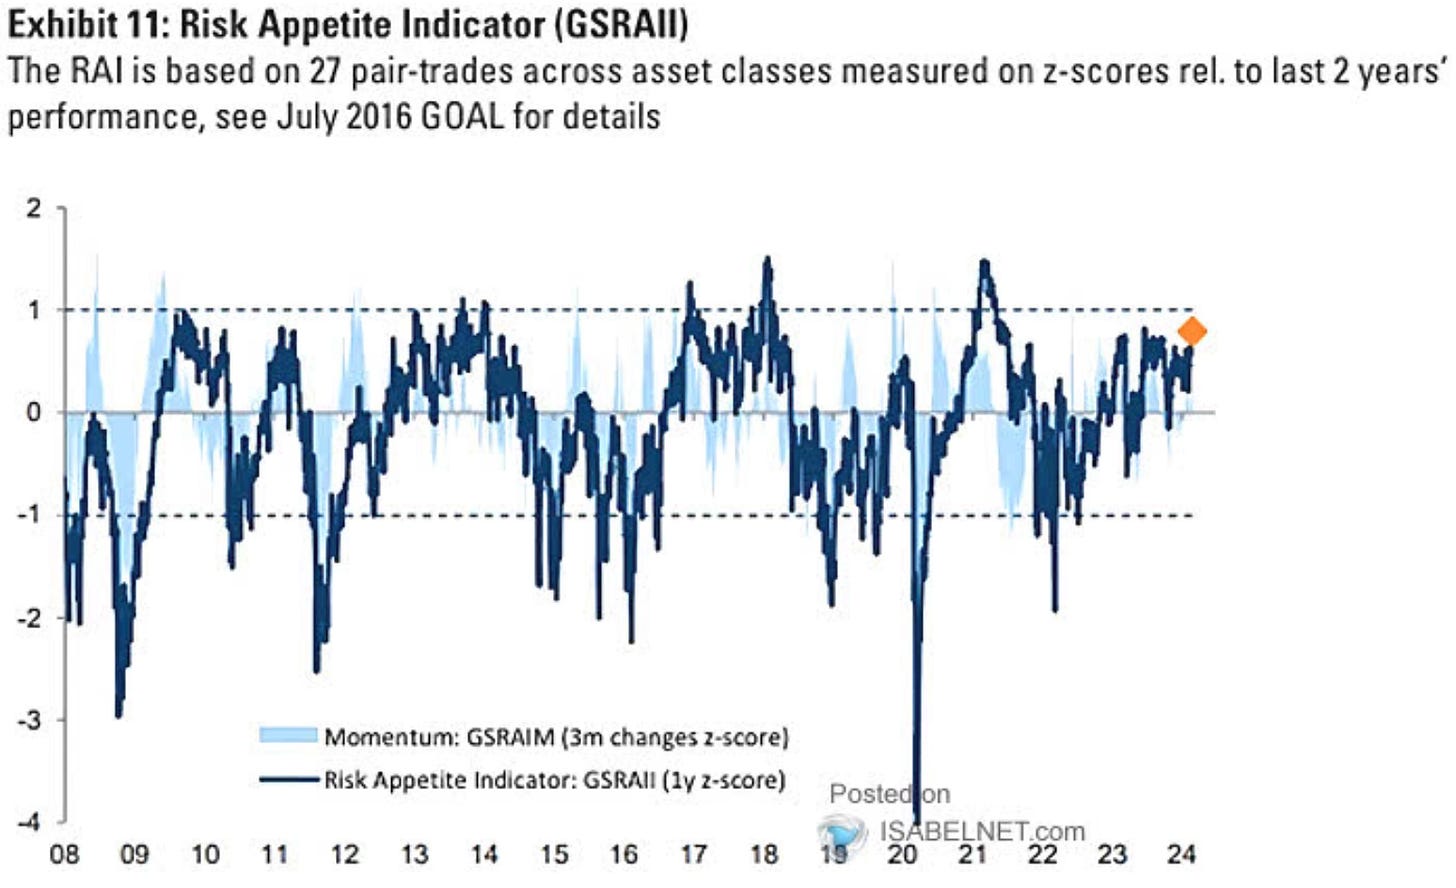
The Risk ratios and risk appetite has continued to increase. It’s sure looking like a lot of investors are chasing. Here is what some additional indicators are showing to prove that we’re seeing is a return to risk-on.
Is Apple Losing Its Taste?
For all the positives that we’re seeing going at the moment, I think the biggest story of the year so far after Nvidia, is what’s happening with Apple.
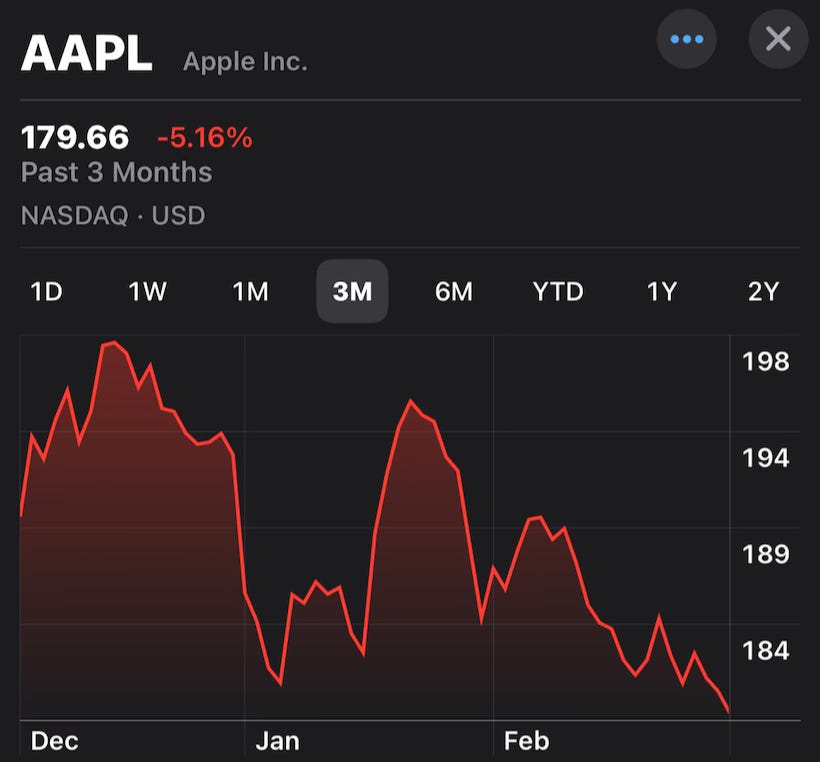
If you had told me that Apple would underperform the S&P 500 and we’d be at new all-time highs I would have said no way. Over the past 3 months Apple is down 5.16% while the S&P 500 is up 8.31%. It hasn’t participated in this rally at all.
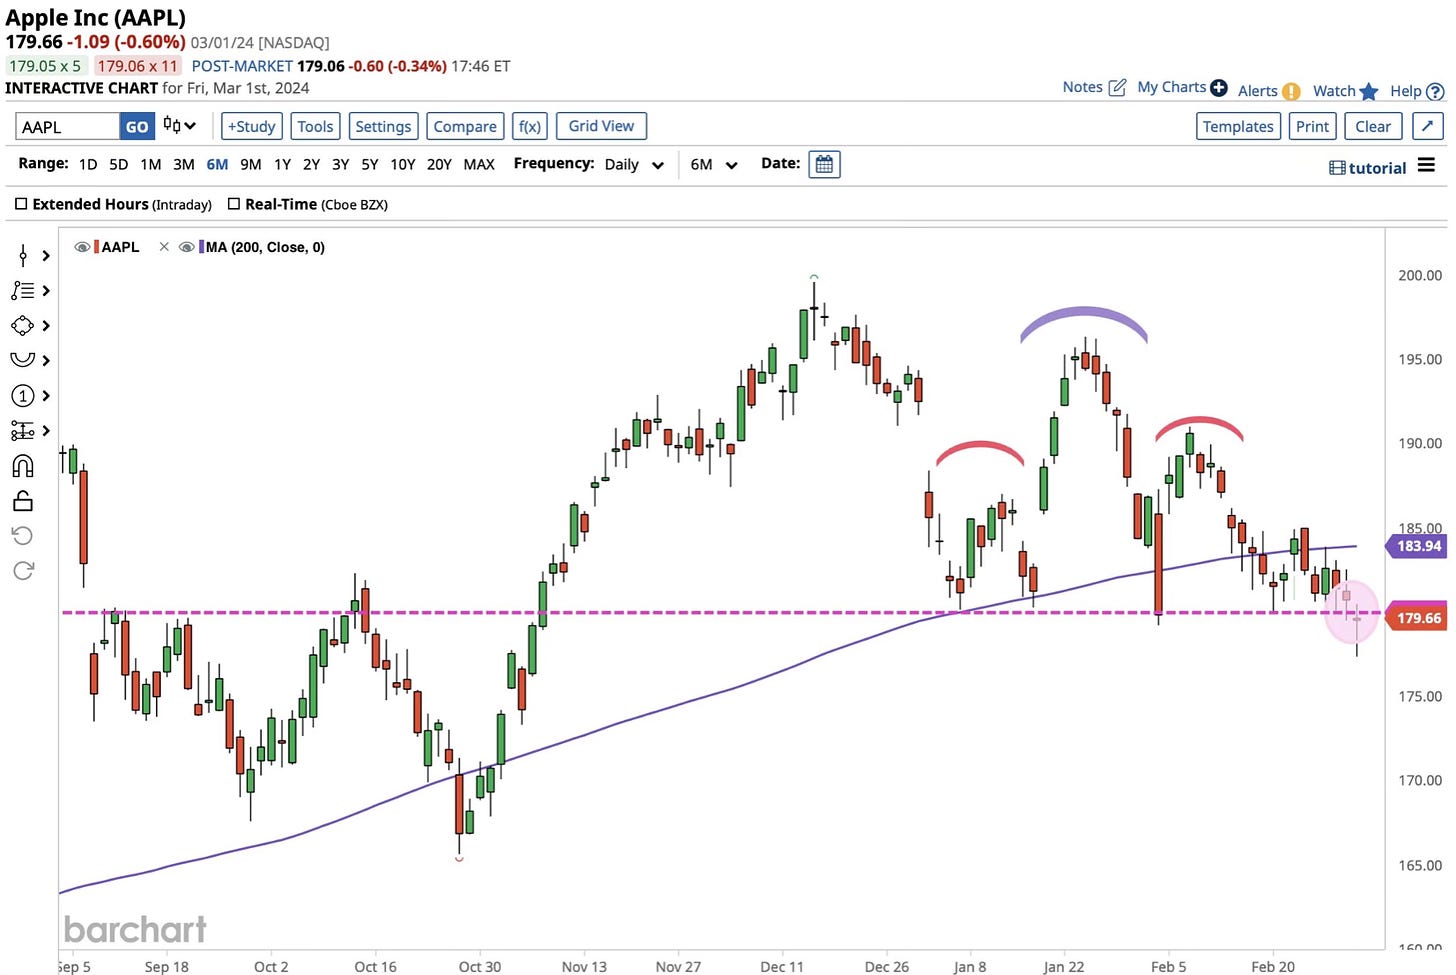
Goldman removed Apple from their conviction buy list on Friday. For Apple stock this is clearly bearish in the short term. The technicals and indicators all point to further weakness.
It has sliced through the 200-day moving average and has been below it now for three weeks. This week it closed at its lowest level since early November. Again, while both the S&P 500 and Nasdaq closed the week at new all-time highs.
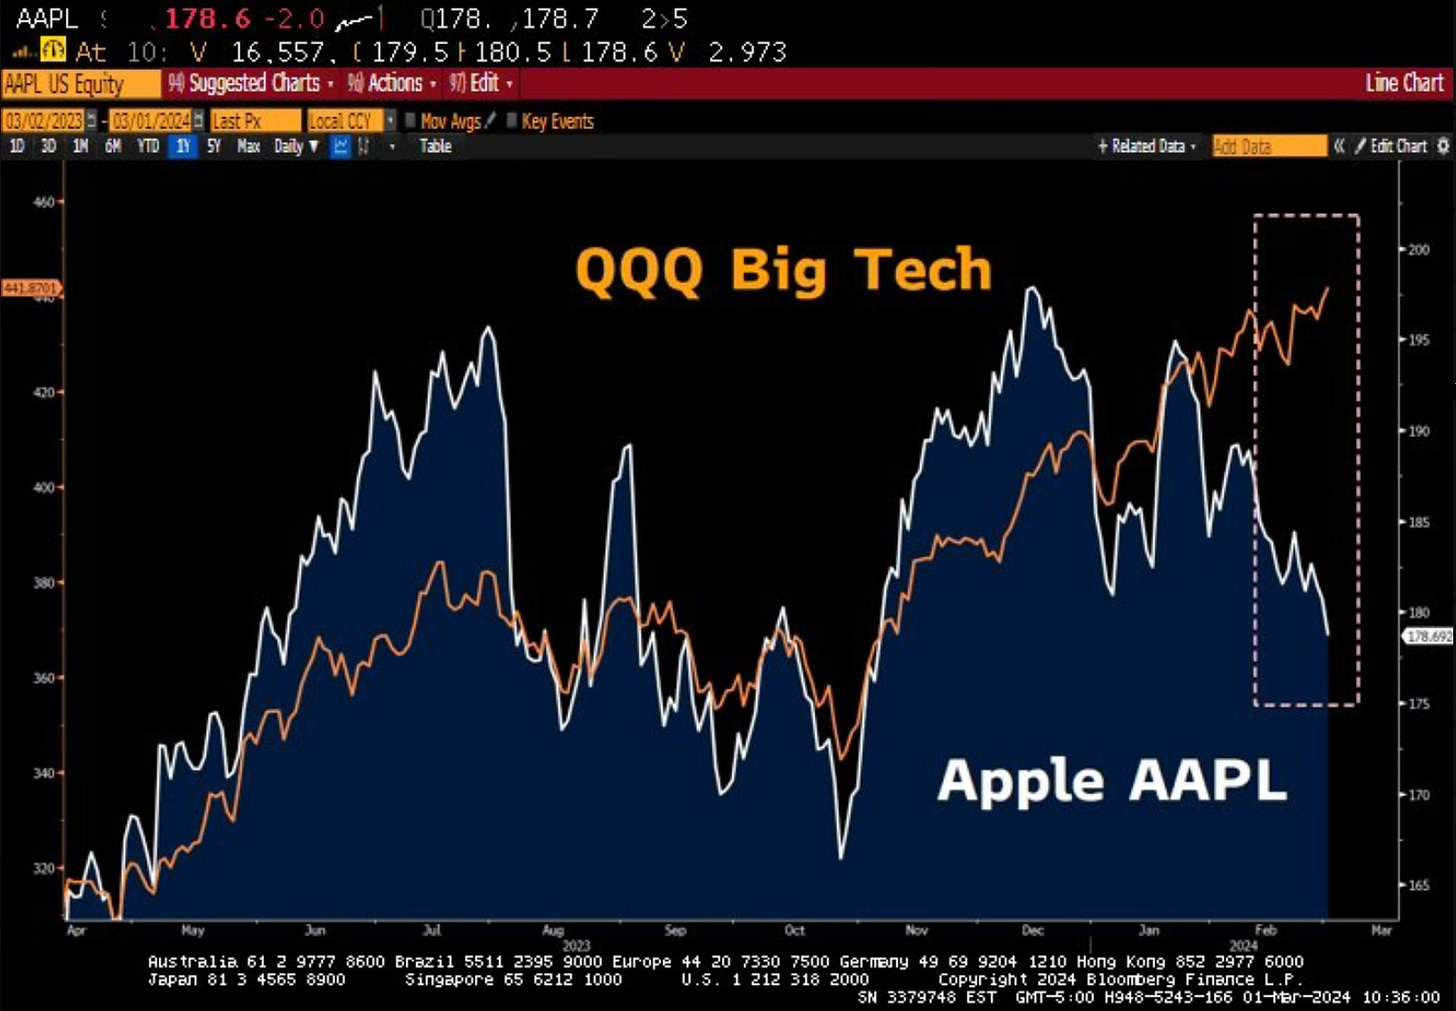
A surprising chart was what it’s doing versus QQQ , which tracks the Nasdaq 100 index. Apple has a 8% weighting in this and look at the difference. There has been some heavy selling and they’re heading in opposite directions.
But what does it mean for the overall market? Is this a bearish or bullish signal?
For a long time we’ve heard how this bull market is only mega-cap tech stocks or the Mag 7. Well now you have the largest company in the world not participating in this rally to new all-time highs. What if it does start to participate?
It could be telling us something bigger about the overall market or it could just be in a rough patch. You could ask the same questions bout two of the other Mag 7 stocks, Google and Tesla. They’re both also drastically underperforming the S&P 500 this year as well. It’s showing that with underperformance and less concentration on the Mag 7 stocks isn’t taking this market down. I think that’s the biggest takeaway.
In the past these dips in Apple have always proved to be great buying opportunities. If it continues to fall much further I may even consider adding to my current position.
Not long ago Apple was the key to the market and the most watched earnings call. It’s unloved at the moment. Right now I think this is just highlighting the strength in the rest of the market which is why the Apple underperformance isn’t a bigger story.
Moves I’ve Made
S&P 500 Index This week I added to my S&P 500 index position.
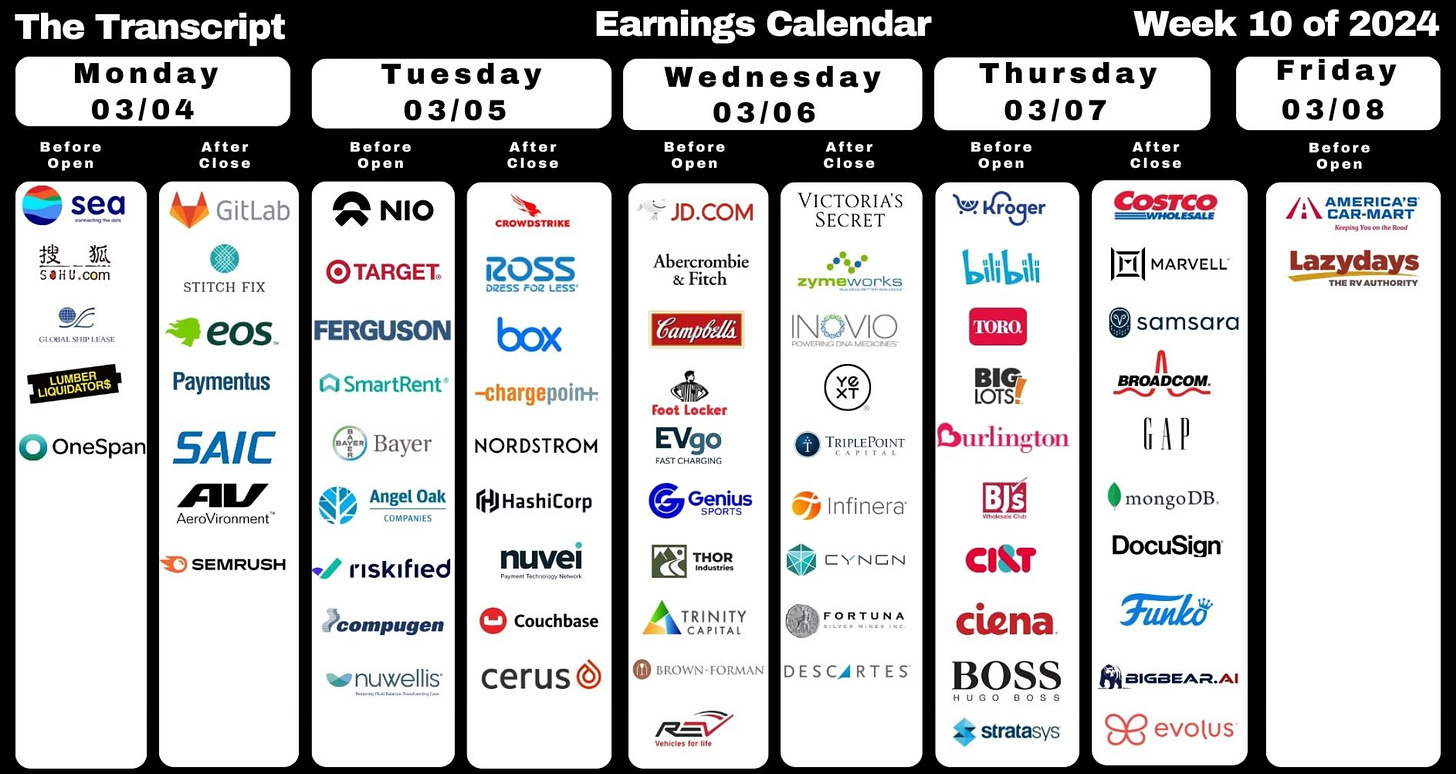
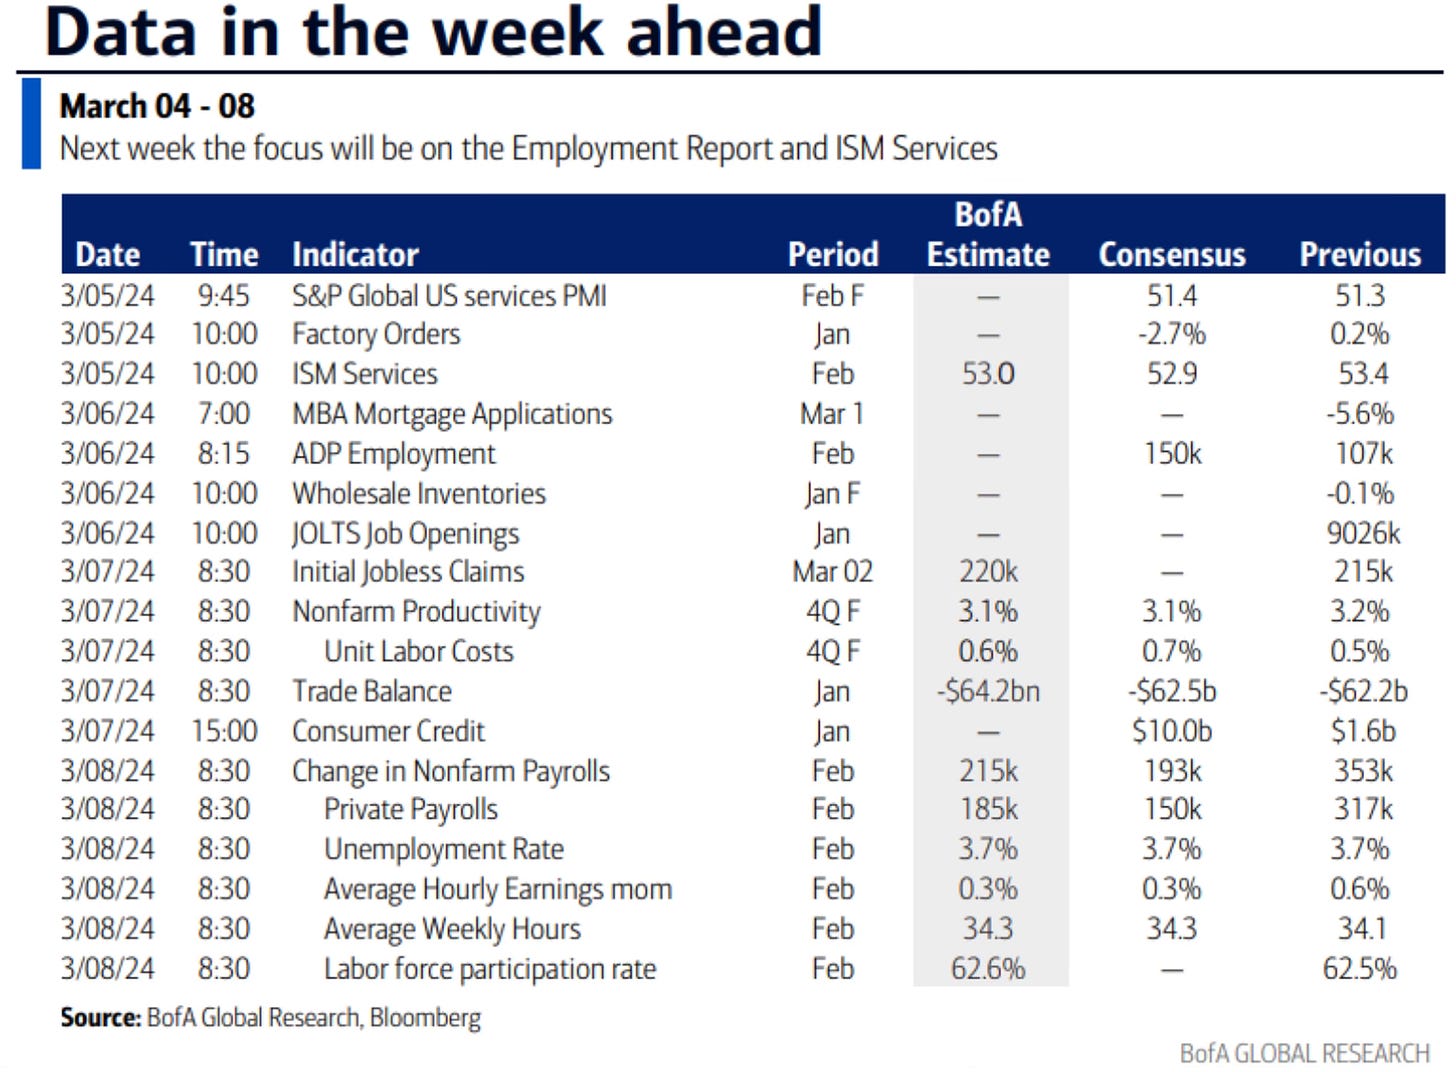
Upcoming Earnings & Data
The Coffee Table ☕
- wrote an excellent post called Why We Don’t Trust Each Other Anymore. This is one of those posts you start reading and have to read to the end. It’s on point with what we’ve been experiencing as a society. Everything now seems to be centered around clickbait and we seemly question everything we now read or hear.
If you’re a football fan like me, you’ve probably at some point read something written by the great Peter King. The legendary writer wrote his last column on Monday after 44 years of covering the NFL. It’s Time. Who’s Complaining? Not Me. I’ve read his Monday morning column since I was a little kid when he wrote for Sports Illustrated. If you’re a fan of the NFL this is a must read. He goes back over all the memorable interviews and notes from his over four decades covering the NFL. All the best in retirement Peter.
Last weekend I tried Ben Holladay Bourbon. This came highly recommended to me by multiple readers. Upon opening it I was stunned at how good it smelled. This was one of the best smelling bourbons I’ve ever smelled. My wife even loved the smell! My expectations went even higher. Unfortunately the taste was a letdown. I didn’t get a lot of flavor profiles as the burn drowned it out for me. Was surprised at that with it only being 100 proof. I will come back again in the future to retry it.
Thank you for reading! If you enjoyed Spilled Coffee, please subscribe.
Spilled Coffee grows through word of mouth. Please consider sharing this post with someone who might appreciate it.
Order my book, Two-Way Street below.


