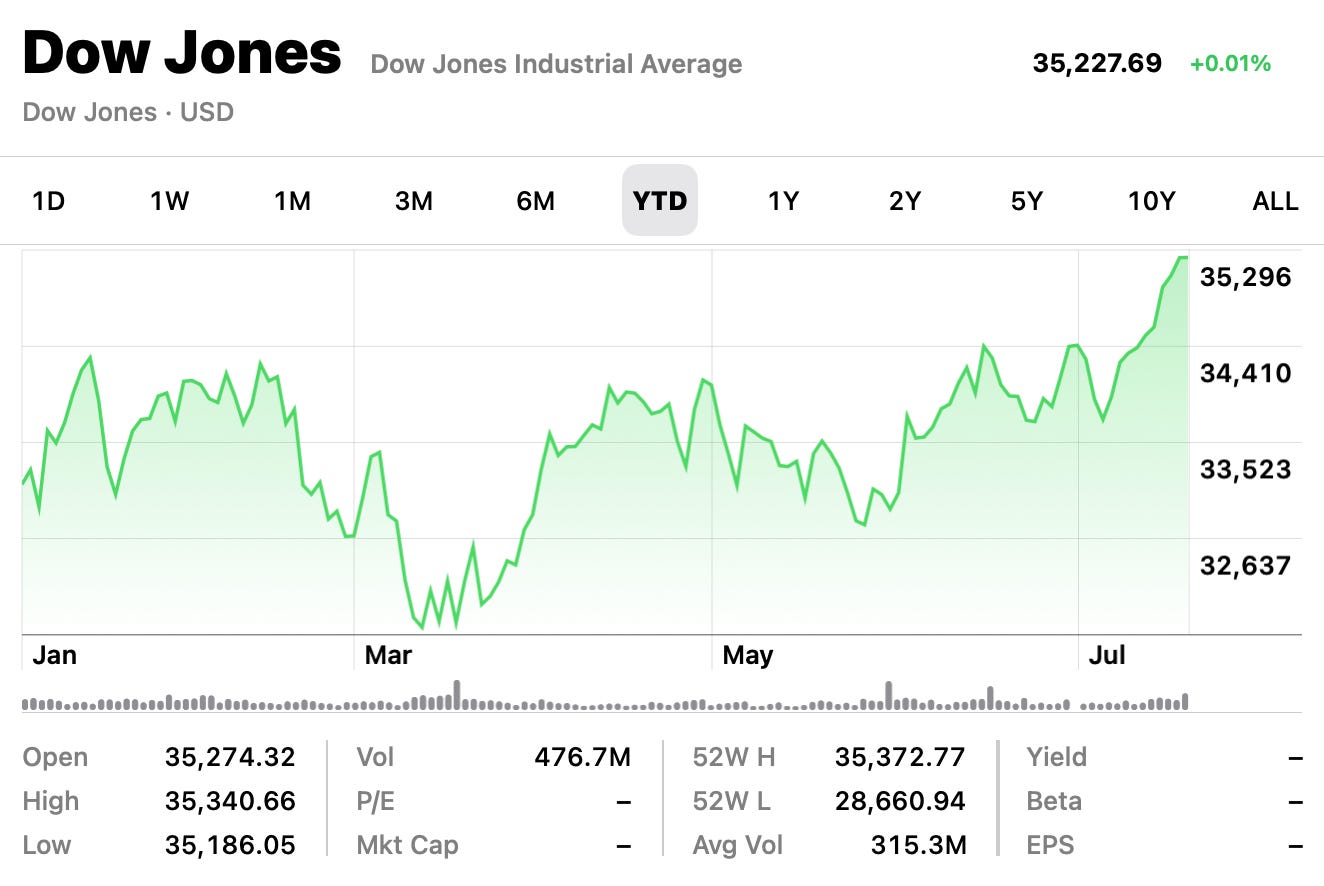
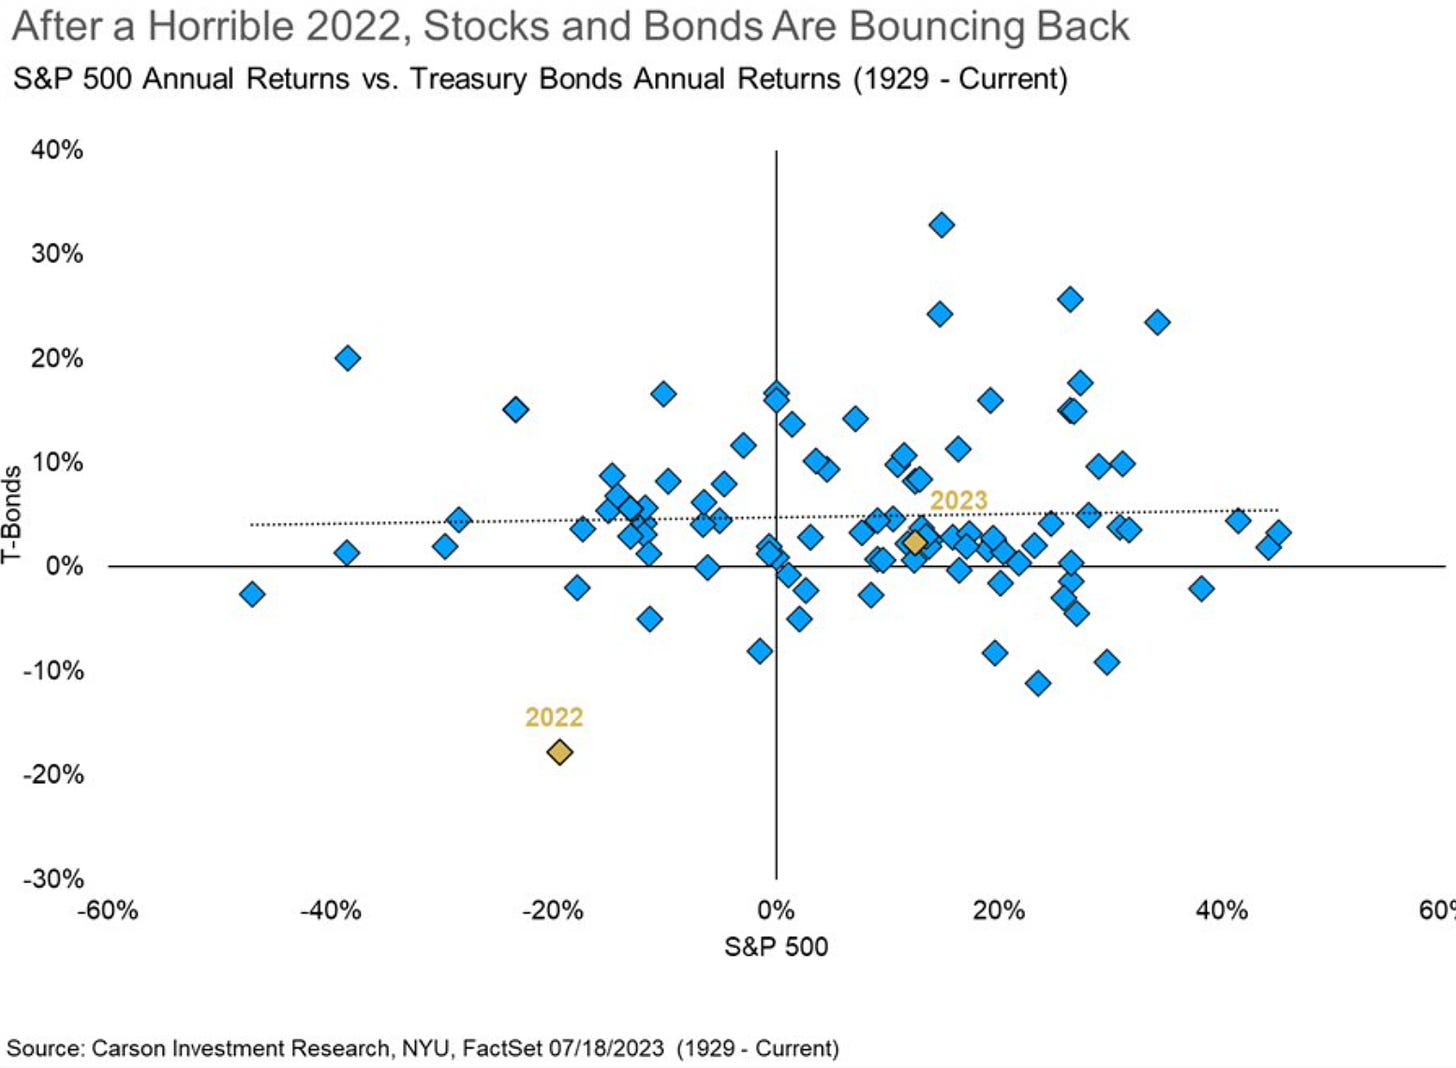
This week was the week of the Dow. The laggard of the major indices so far this year is in the midst of 10 consecutive positive days. That is its longest winning streak since August 2017 and good for an 18-month high.
With the S&P 500 up 18.62% YTD and the Nasdaq up 35.66% YTD it’s still the Dow that is lagging behind, up only 6.31%. If the Dow continues to makes a move higher, this will make the tail end of this year very interesting. We continue to see a widening in the number of stocks participation to the upside. This is setting up 2023 to be among one of the best years for investors.
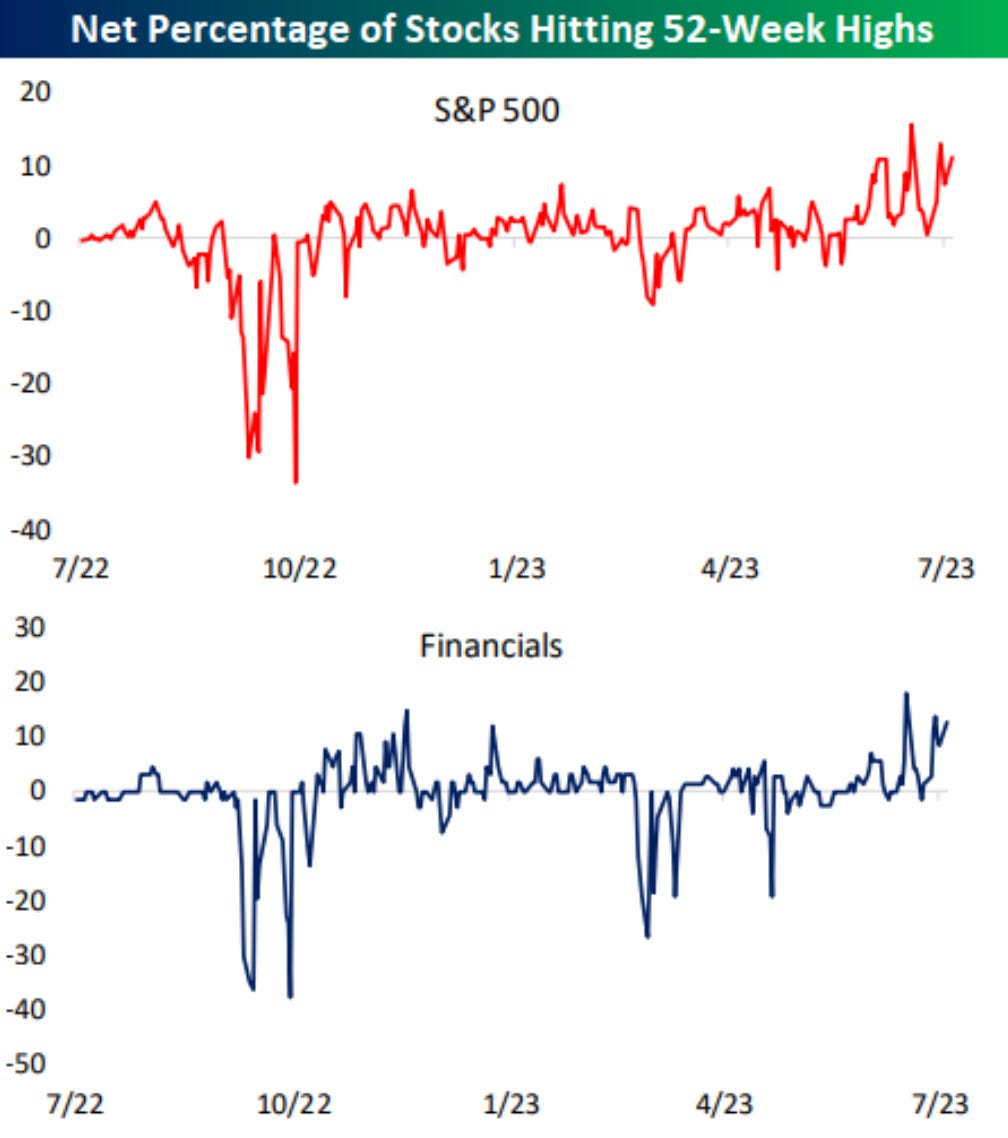
The new highs continue to expand and now even financials are participating.
The consumer is still doing ok and we know that the consumer drives the economy. Visa V 0.00%↑ and Mastercard MA 0.00%↑ who tell the story of consumer sending both sit at 52-weeks highs. That should really tell you something.
Remember all the things that we were told as reasons to sell and not buy stocks? Eminent recession, yield curves, the fed, earnings, a war, inflation, debt ceiling, housing crash due to rising rates, student loan repayments restarting and whatever else. Everything was supposed to get way worse.
All the while the trend for the majority of stocks has been up for well over a year now. If you believed all the bad news and negativity you missed the rally. If you bought along the way you’re very happy. We can all learn from this and remember it for the next time.
As the participation widens, evident by the recent surge in the Dow, you can expect to see the all-time highs be taken out by years end as I’ve said. Then what? Does the old all-time high of mark of 4,796 mean the peak for the S&P? I don’t think so. Once we reach the 4,796 mark expect the talk to change to S&P 5,000. The hats will start being printed. That’s the next major milestone for the S&P to reach. It will reach that number, it’s just a question of when.
Inflation Becoming a Non-Story
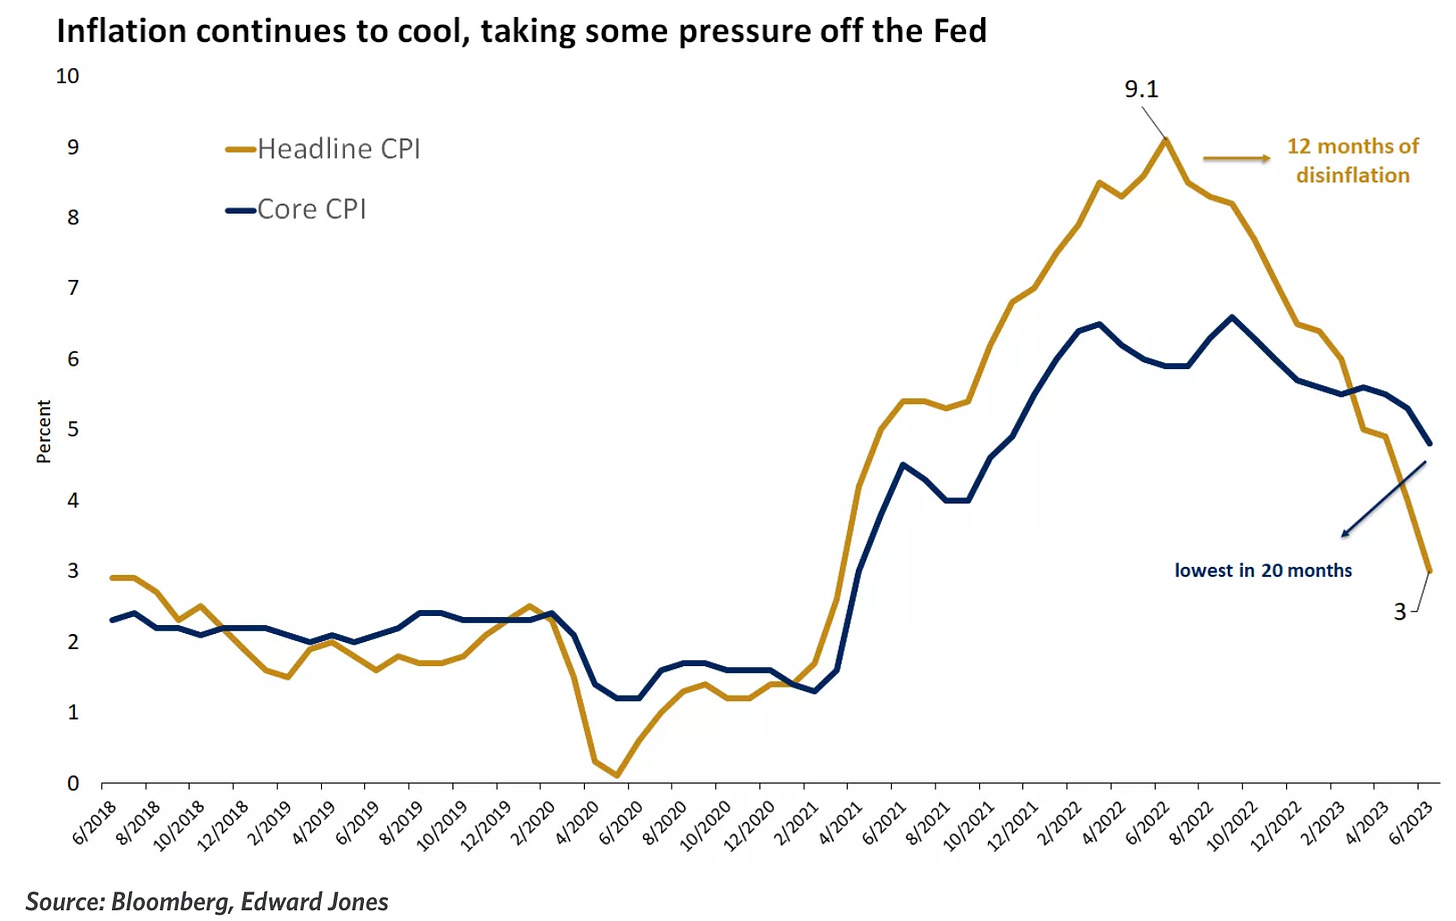
What had been the biggest story and for a long stretch the only story that mattered to investors isn’t carrying the weight it once did. Inflation has cooled and now we’re in a period of disinflation. This is making the Fed’s job easier and loosening the need to continue raising rates. It’s something that consumers love to see. Investors also.
CPI is now one-third of where it had peaked a year ago in June 2022 at 9.1%. This makes 12 straight months of declines to the current 3% number. That’s the lowest number in 20 months!
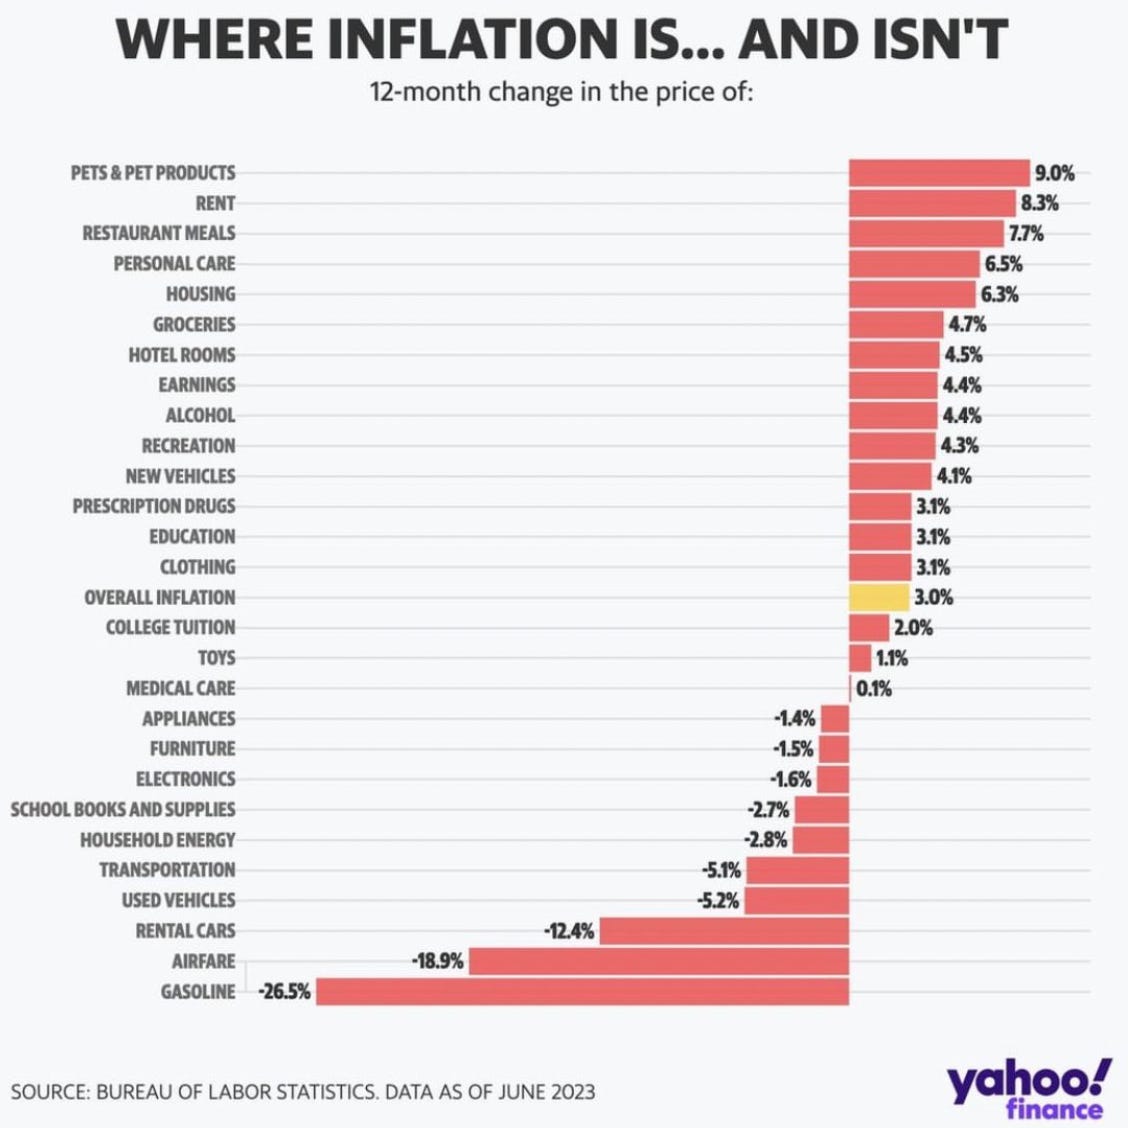
Here is a great chart showing which categories inflation is still present and where it isn’t.
Professionals vs Retail
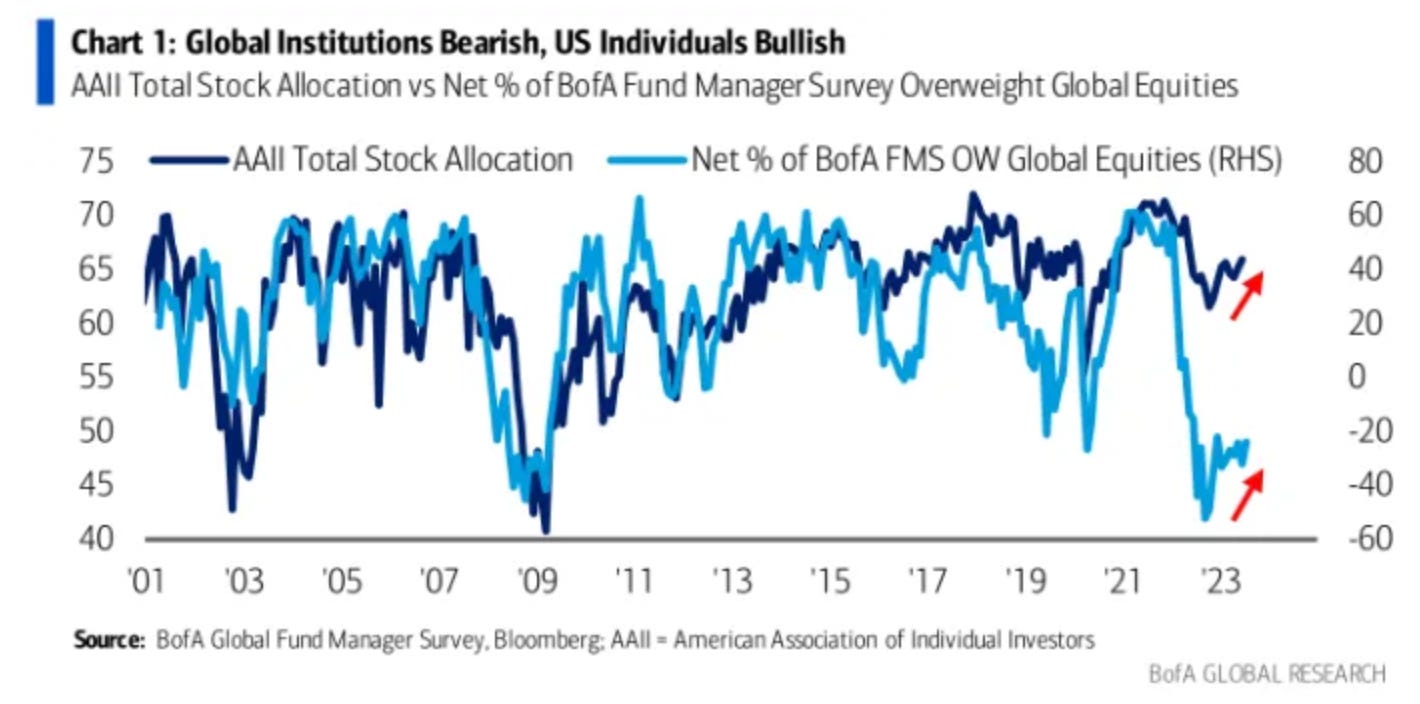
This chart from BofA is one of the best I’ve seen this month. It shows the drastic difference in stock allocation from retail investors and professional investors. The so called “smart money” of the professionals has been tentative and mostly on the sidelines during this rally. Does this mean that a lot of the run up is retail investor fueled? If that is the case, there is a lot of institutional money that will be forced to get in and play catch up eventually. That will undoubtedly drive the market even higher.
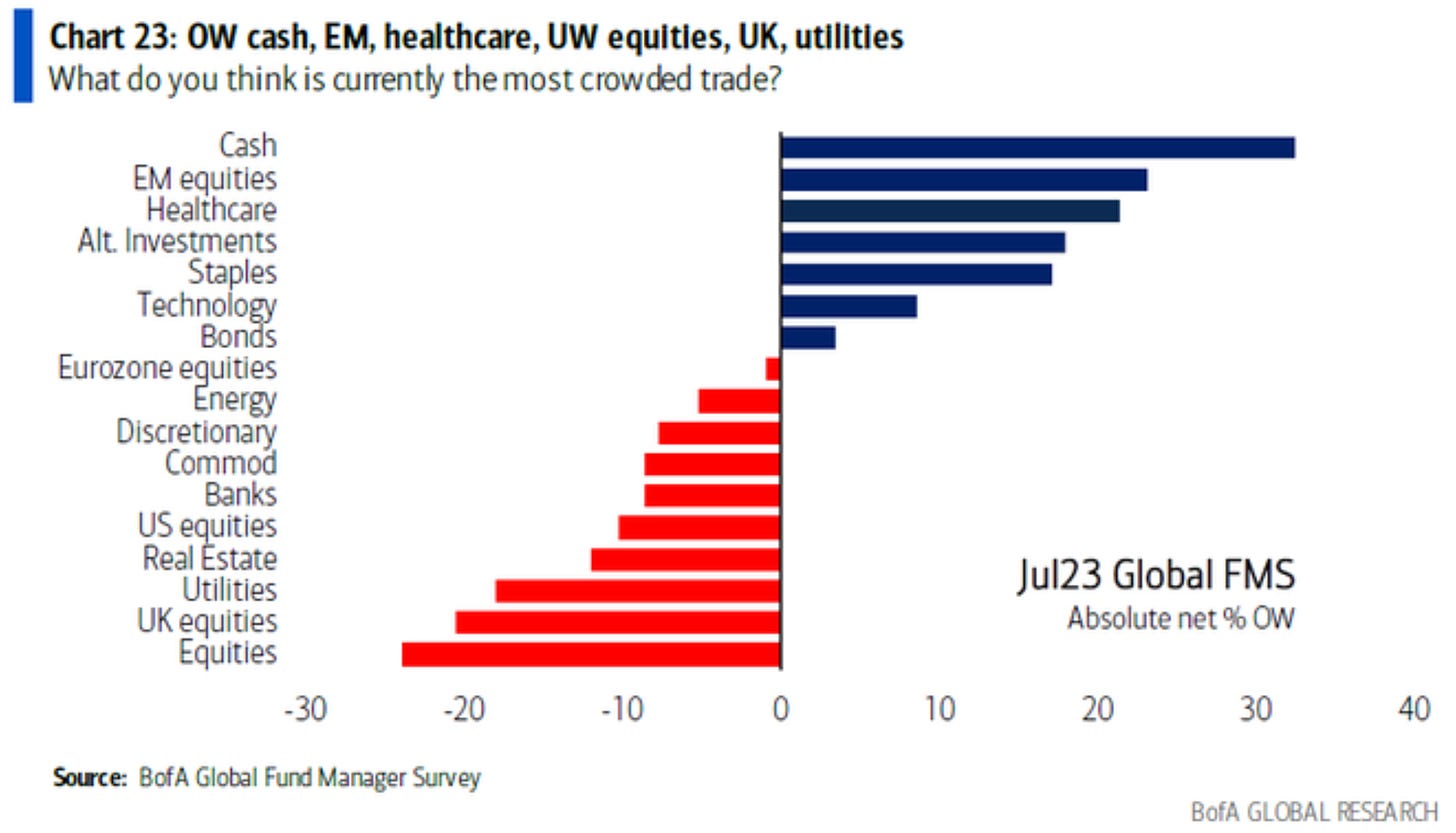
To drive home the point of professionals not buying into this surge, let’s look into the July BofA Fund Managers Survey. What is the most overweight area? Just as you’d expect, cash. The most underweight? You guessed it, equities. When I say that I think there is a chance that the S&P 500 hits 5,000 soon, this is a big reason why.
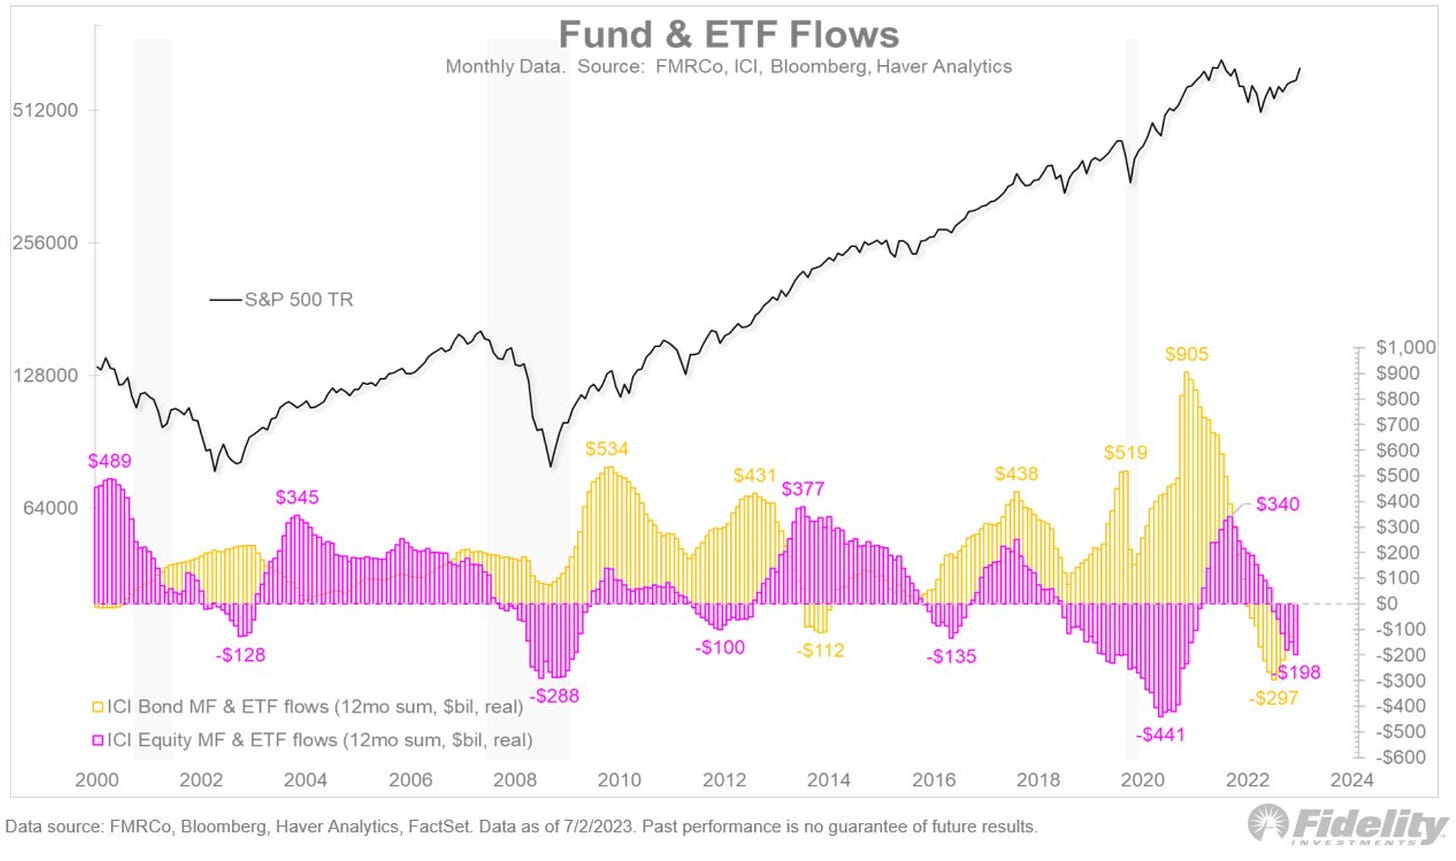
This chart from Jurrien Timmer showing the 12 month-net inflows into bonds and equities (both mutual funds and ETFs) also proves that a lot of long-only money has not joined into this rally, yet. Very bullish the longer this market run continues. We’ve yet to see the FOMO chase from sideline cash kick in. What happens when it does?
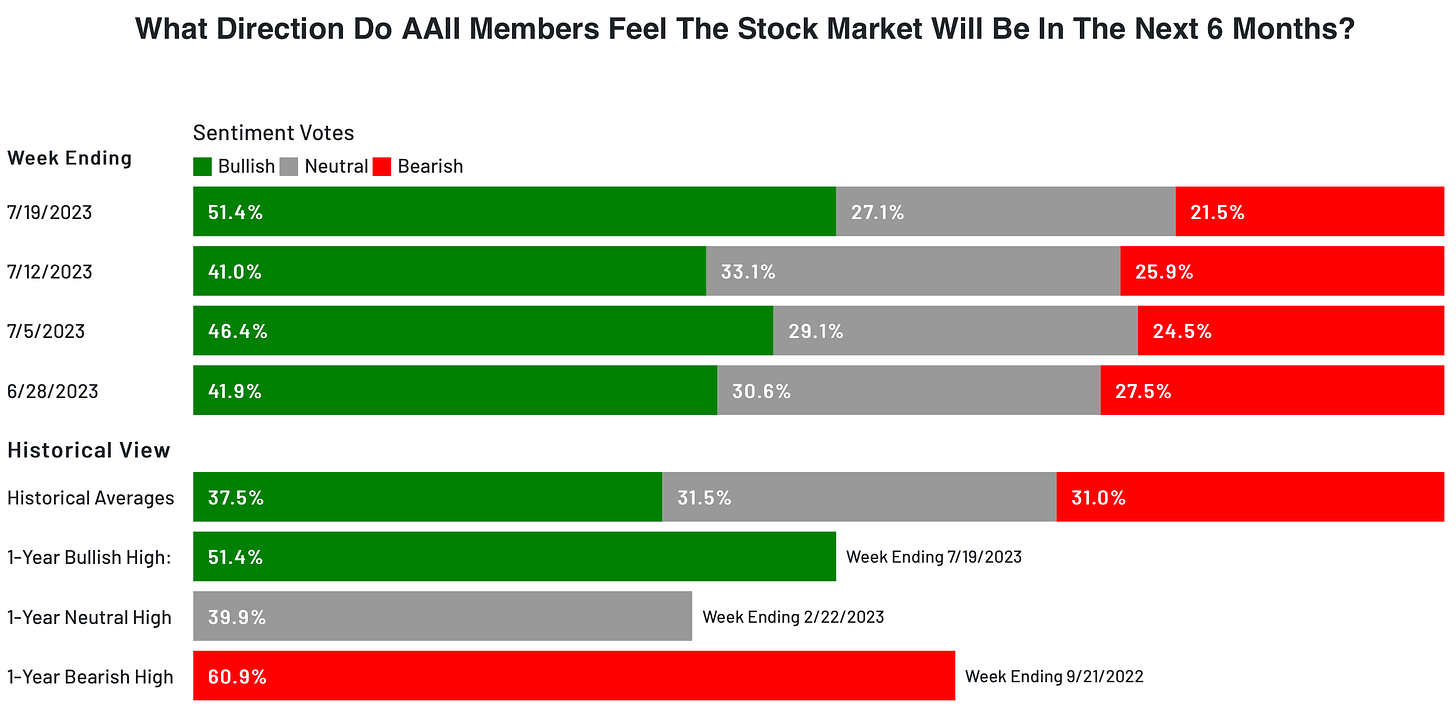
Bullish Sentiment Highest Since 2021
The AAII Bullish Sentiment Survey now shows the level of bullishness at the highest level since April 2021. That’s unusually high. The bearishness is at the lowest level since June 2021. After a run like the stock market has had, would you really expect anything else?
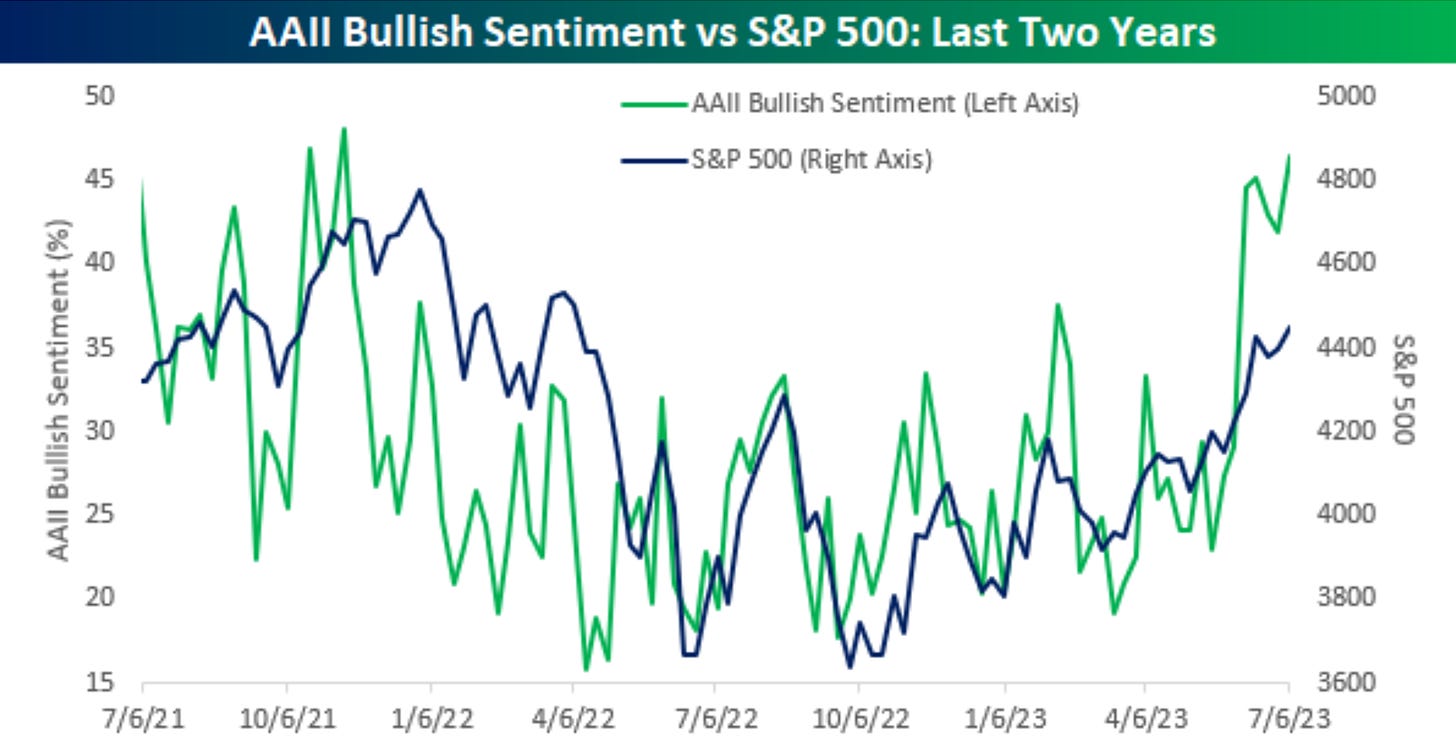
To see if the AAII bullish sentiment is any indicator of future S&P 500 returns, Bespoke has this chart on how the two have tracked over the past two years.
The China Unwind
In February I wrote a post called The Unwinding Reliance on China. In it I stated the following;
What I look at is the world’s largest companies, greatest investors and investment institutions are steering clear and unwinding away from China. This should give a clear indication where thoughts and opinions are at. It may be a good time to assess how much reliance you and your company has to China. Whether it be through your products or investments.
This chart that
shared shows that this is exactly what the US companies are doing.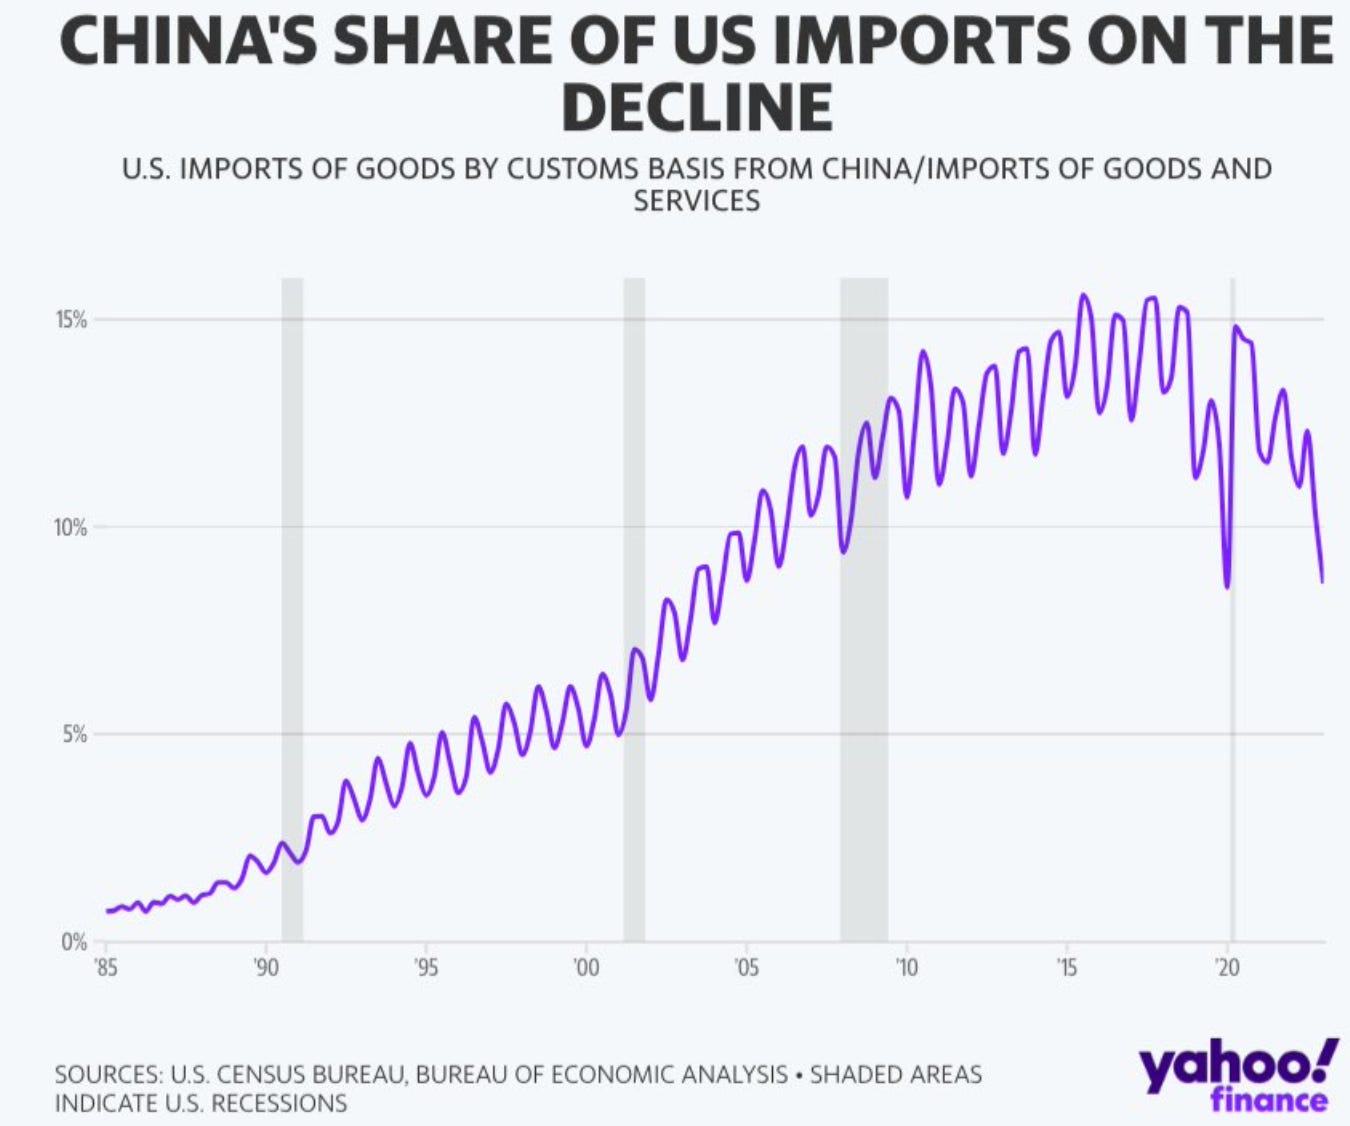
Where They’ve Come From
Just how much have the big tech stocks bounced off their 52-week lows to now? This is another thing we can all learn from and remember for the next time.
Alphabet GOOGL 0.00%↑ $83.34 to $120.02 +44%
Amazon AMZN 0.00%↑ $81.43 to $130 +60%
Meta META 0.00%↑ $88.09 to $294.26 +234%
Microsoft MSFT 0.00%↑ $213.43 to $343.77 +61%
Netflix NFLX 0.00%↑ $188.40 to $427.50 +127%
Nvidia NVDA 0.00%↑ $108.13 to $443.09 +309%
Tesla TSLA 0.00%↑ $101.80 to $260.02 +155%
What I’m Watching - Bearish Signals?
Yes things seem to be going great for the market and the economy but part of what I do is try to identify the path ahead. Depending who you read or watch your view may only be one-sided. I always try to look at all the sides to get a complete story and then form my own view and options.
Right now I am and have been bullish. I’m still fully invested. That stance hasn’t changed. But there are some things that I have been watching that may not seem important now but in time they could. It’s why I continue to monitor many things. It’s why I started to turn bullish well before most others near the end of last year. You try to identify trends, changes that counter the consensus at the moment (contrarian thinking) within the market or economy that could matter down the line.
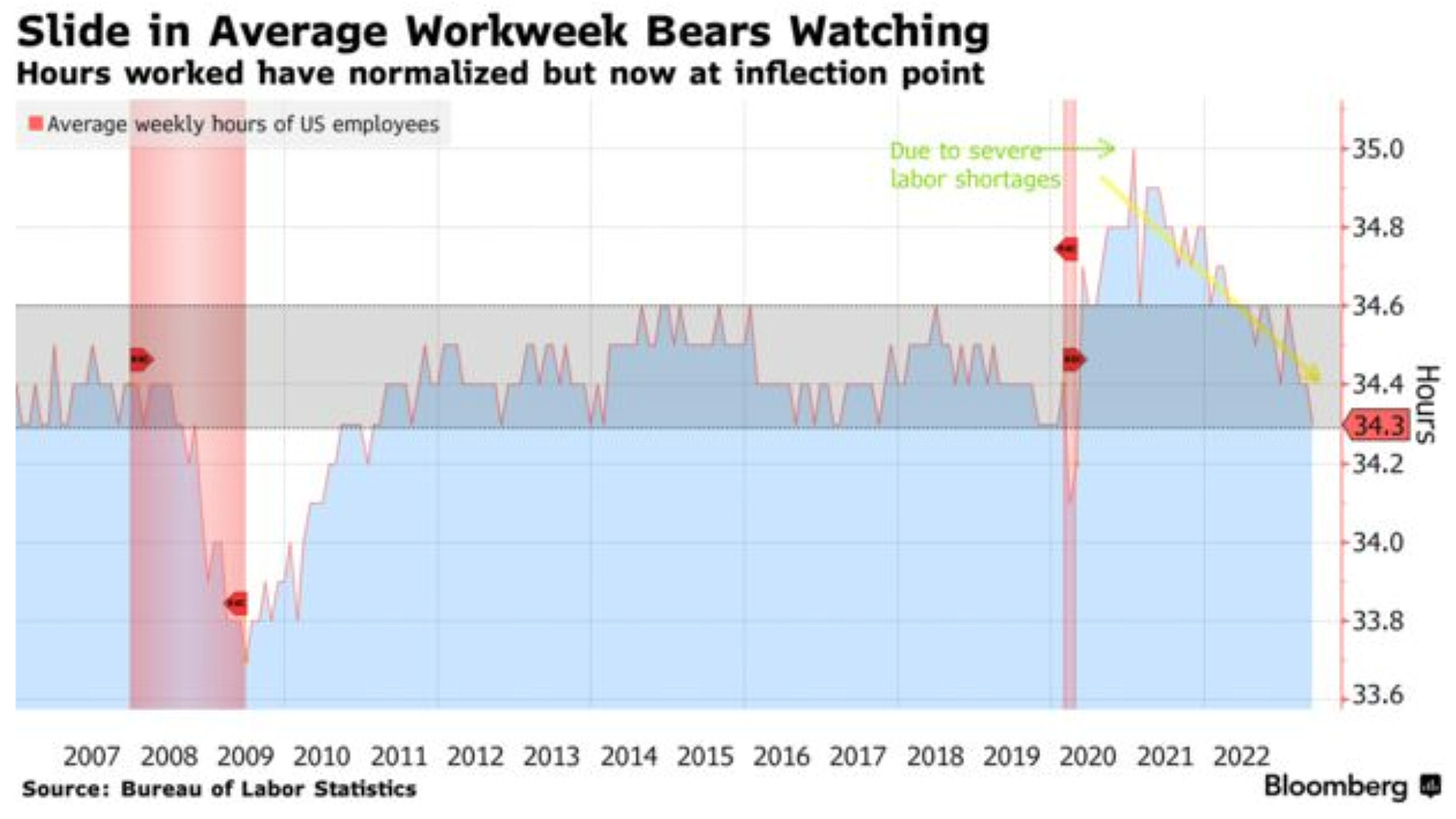
The first is this chart on the change in the average hours worked. It really bears watching because this is going back to pre-covid trend and we’ve already been hearing about the decrease in labor productivity. There was the spike in labor shortages after the pandemic but that has worked itself out. How much lower this goes will be interesting to watch. Especially with the new work week really only being four days as Fridays are now a part of the weekend it seems.
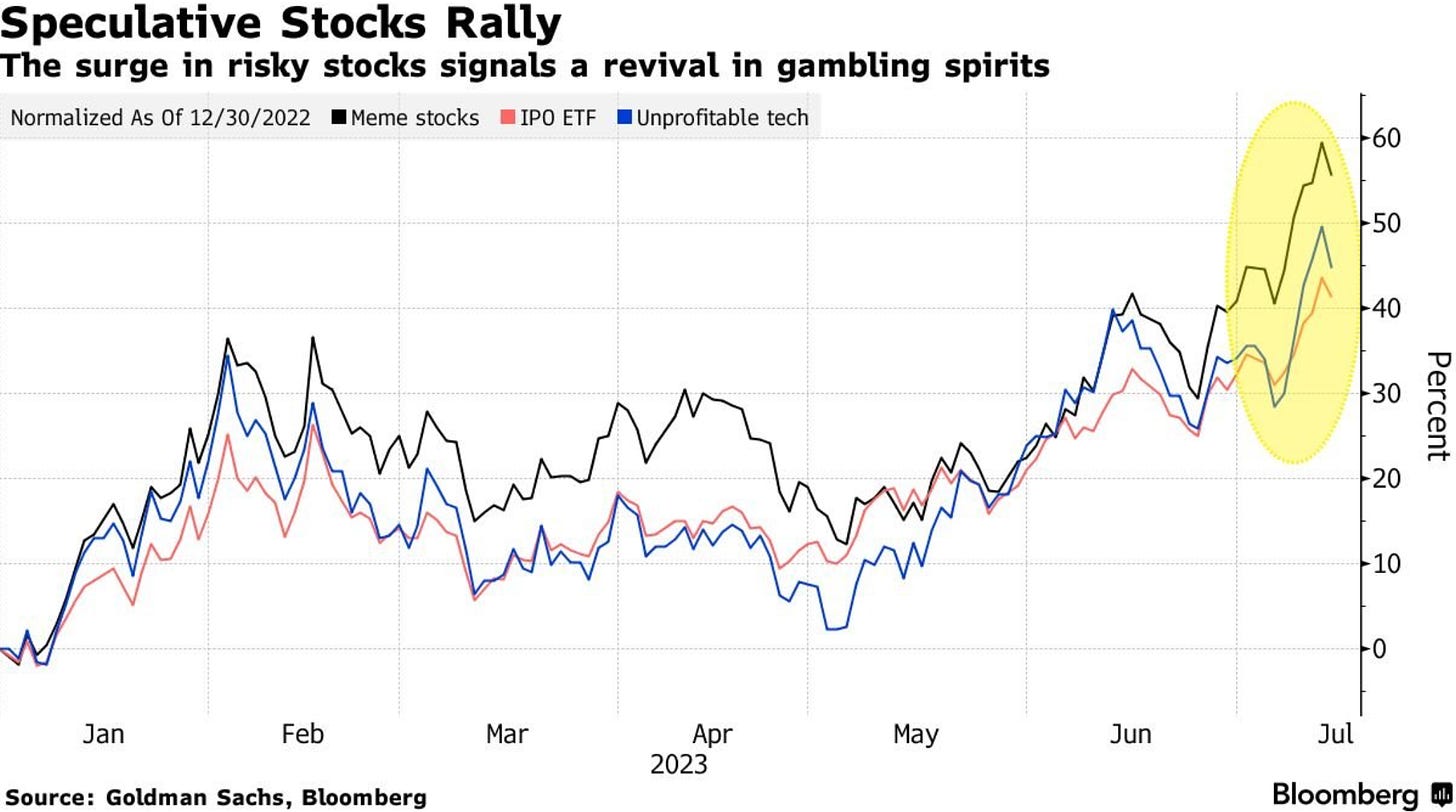
When you start to see a pickup in IPOs, meme stock activity and unprofitable tech stocks pop it’s time to take notice. That doesn’t raise the alarm for tops or to sell but it says things could be bordering on the frothy periods. This brings back the gambling and gamification of the retail investors. It’s still early but defiantly an area to watch now in this bullish period we’ve entered.
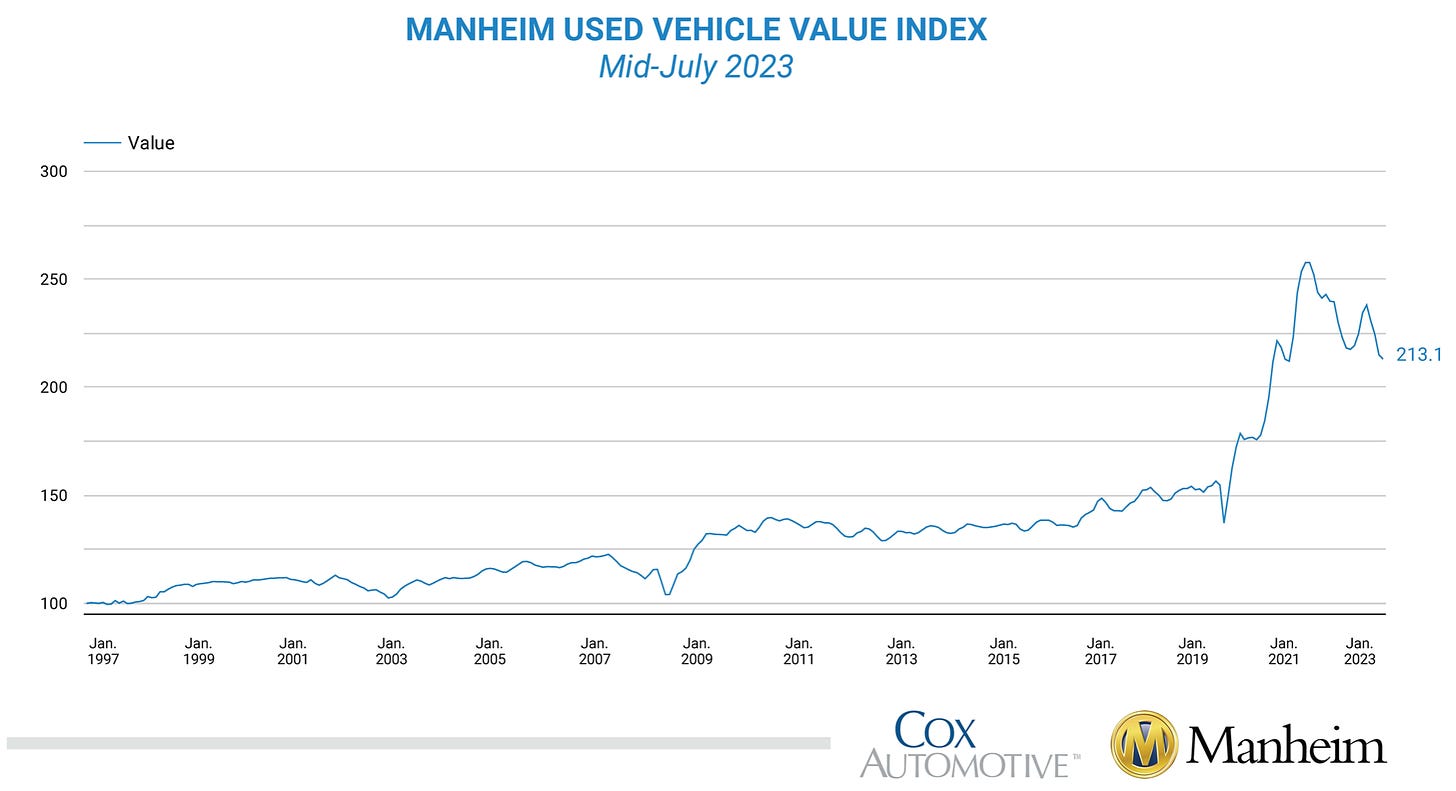
Used vehicle prices just had the second largest largest YOY price decline ever. Prices fell 10.3% from a year ago. This matters because this was one of the first things to take off in price after COVID. It does help on the inflation front and almost has to come down some but does this signal a weakening consumer. When you see price start to fall like this and that sharply, it signals a demand decline. An early indicator in the past could be another early indicator again.
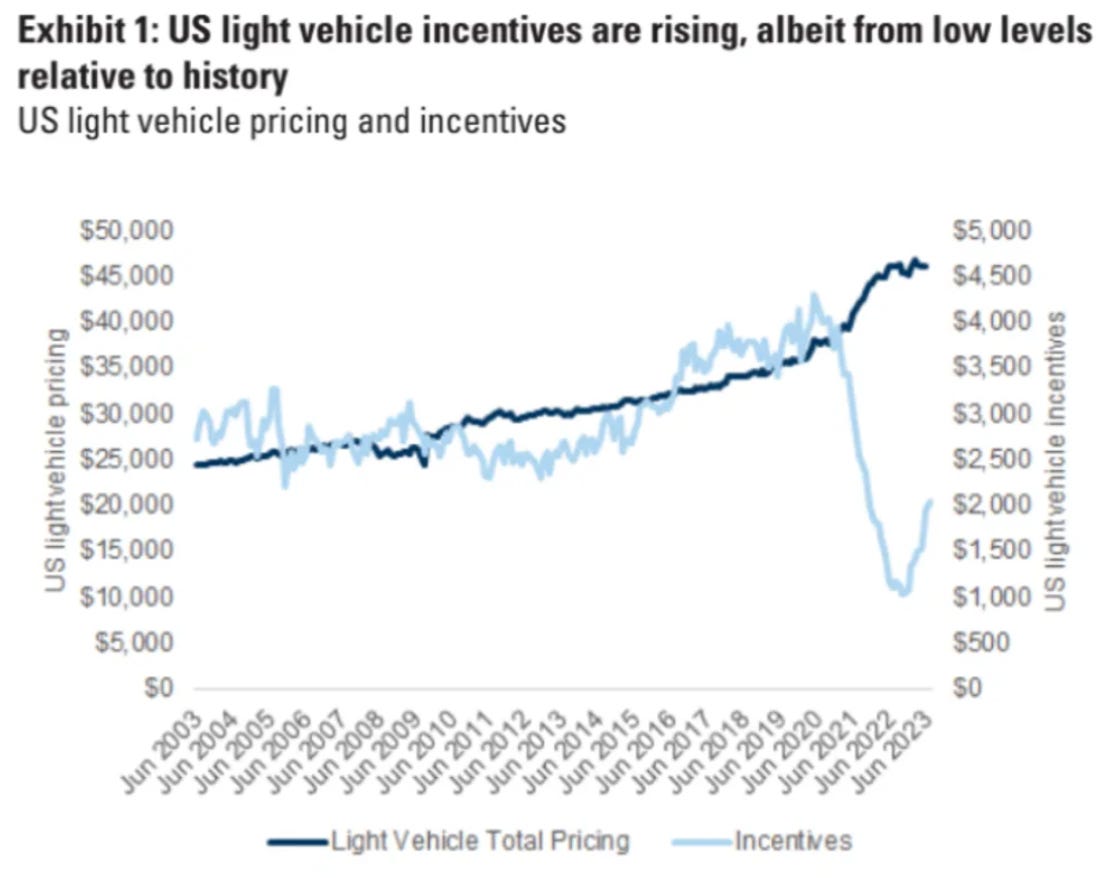
To prove demand is waning, this chart shows that light vehicle incentive are starting to rise. Again, it has been way off trend historically but still shows that demand is changing from what it was.
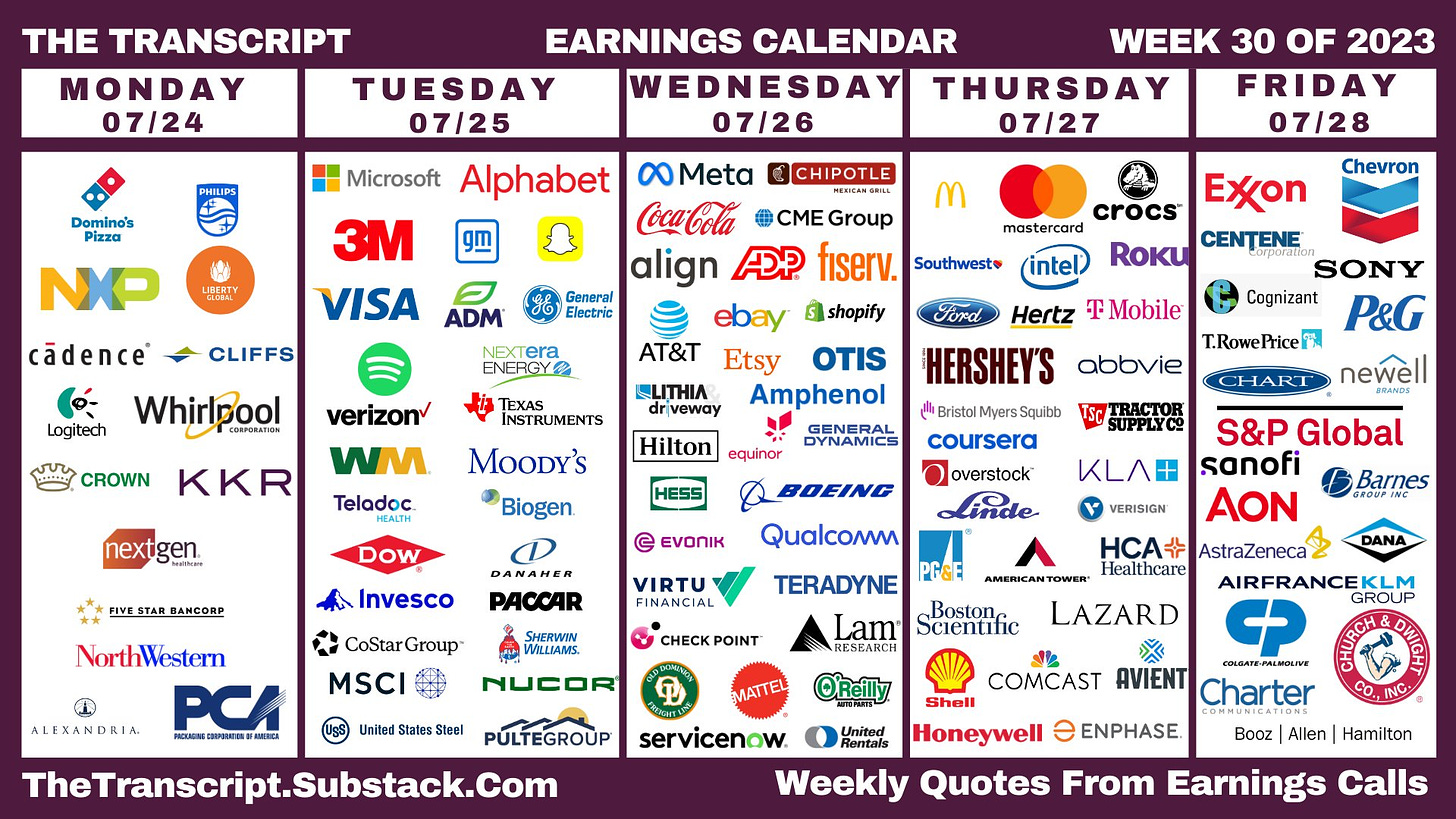
Earnings Next Week
Next week is a very big week of earnings with 173 S&P 500 companies reporting.
The Coffee Table ☕
The Cruel Irony of Investing was a very good post by Michael Batnick. He doesn’t write as much as he used to but Michael is one of the best financial bloggers and when he does write something I always read it. Really liked this quote, “The market has no mercy. It almost never does what you think it’s going to do. You have to let go of the illusion that you can outsmart it.”
There was an interesting piece by Nick Maggiulli called The Problem with Valuation. He explained why stock valuations are higher today than they have been in the past. But could our valuation metrics be outdated?
Jack Raines wrote a great post, Five Career-Related Things I’ve Changed My Mind On. Enjoyed reading this on career, prestige and success. No matter how you slice it, success is hard and takes longer than you think. Finding success is a marathon and not a sprint. Jack is a great writer and this is one of his best this year.
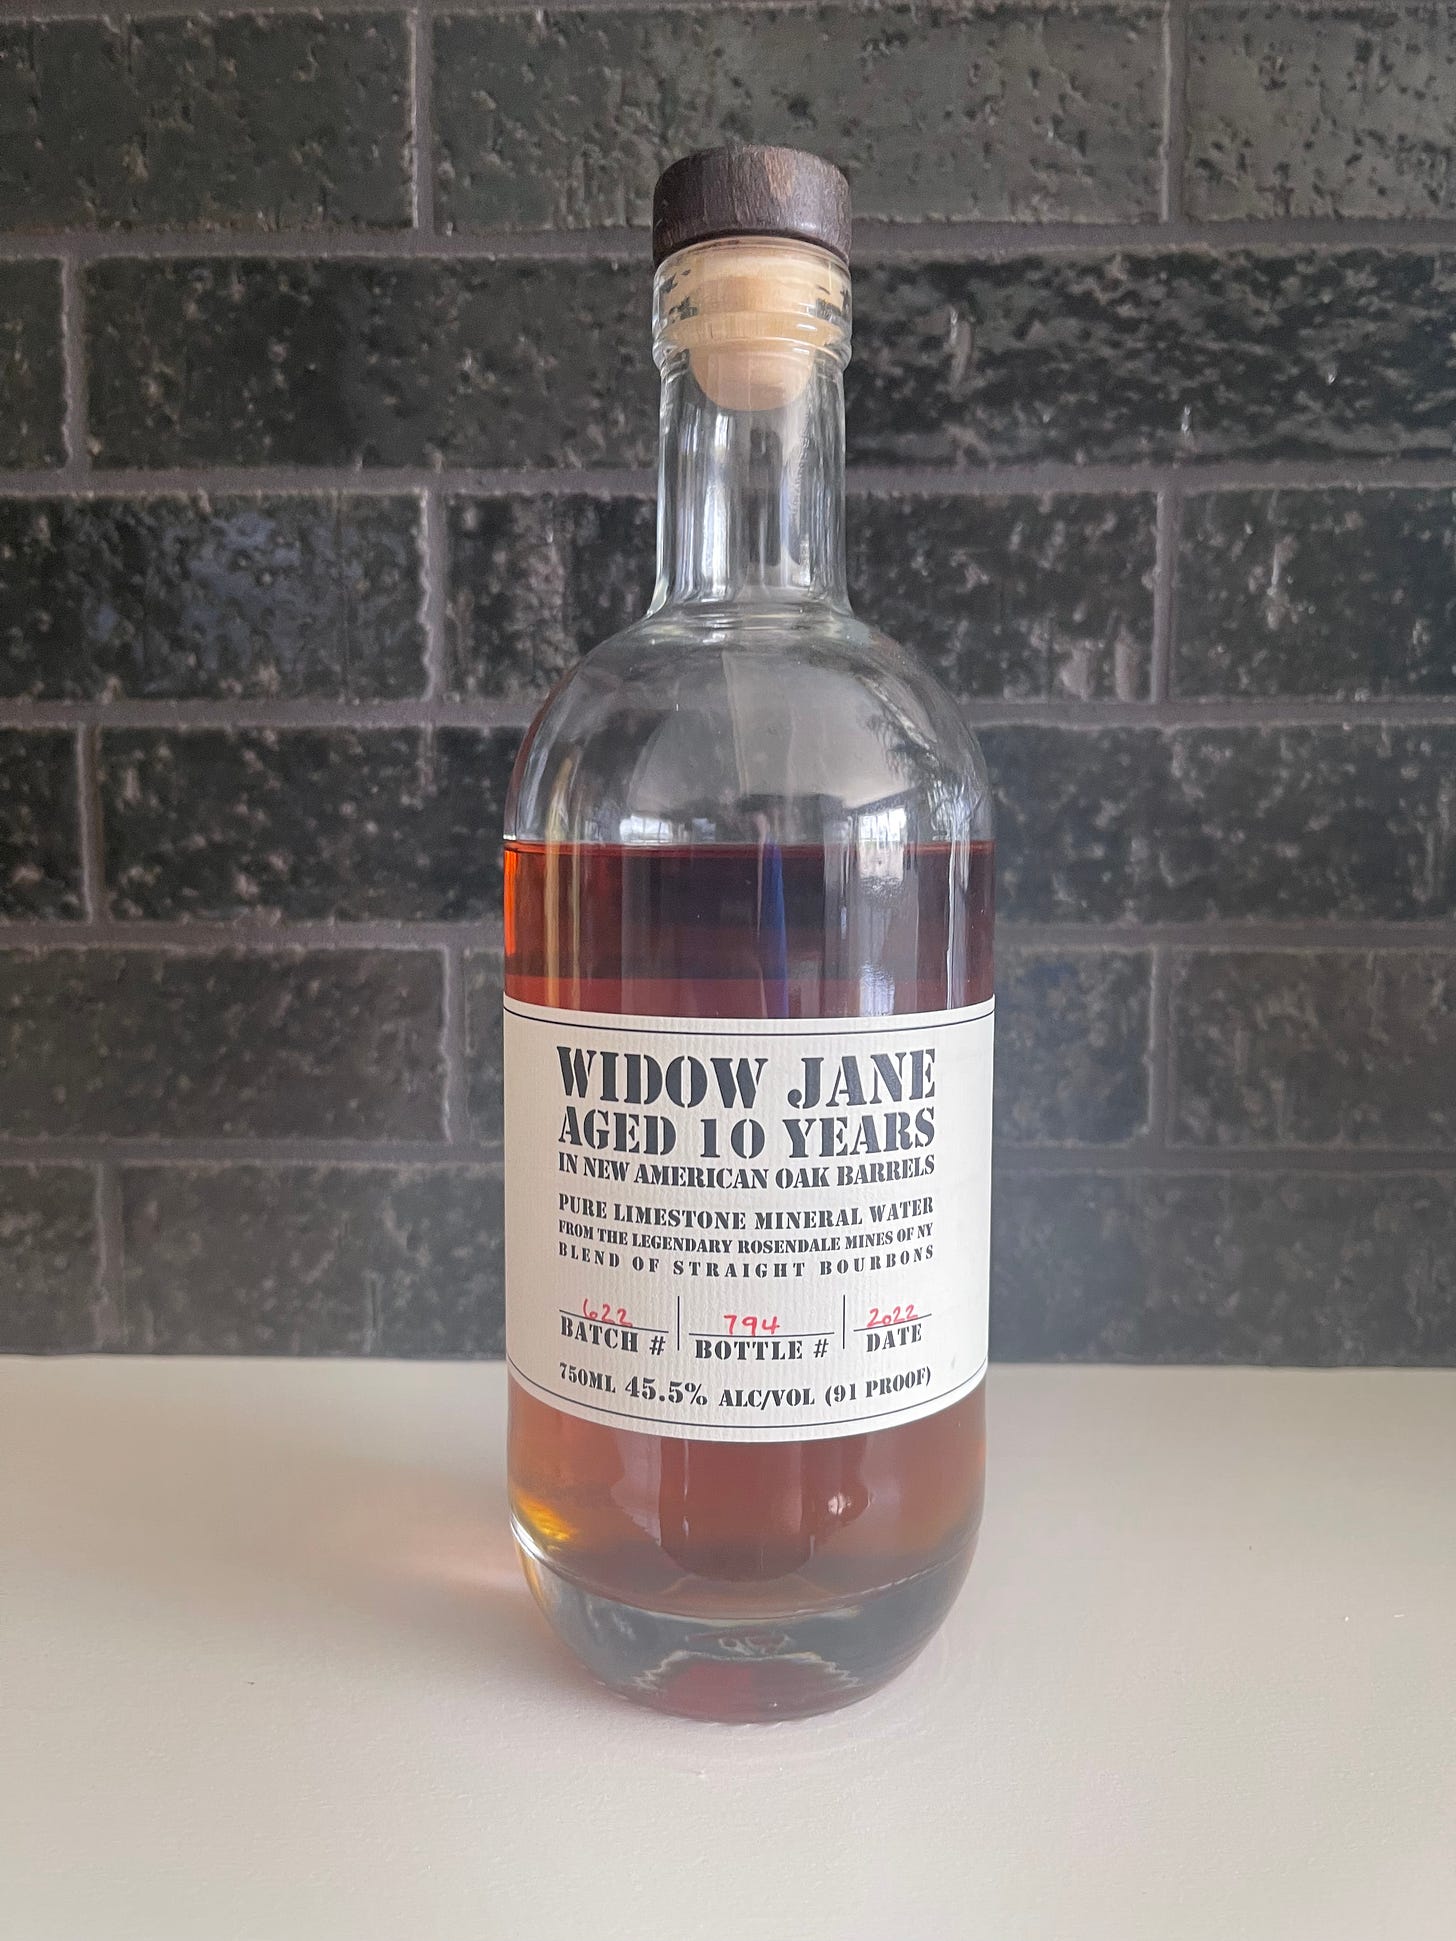
I recently went back and tried Widow Jane. It’s a good solid tasting bourbon. It’s readily for sale. I got this bottle at Costco. The smell is outstanding. To taste there is a good well rounded flavor but it doesn’t really stand out with a lack of bite. No flavors really jump out. I kind of found myself waiting for more to come through because it smells so good. Their more limited rare editions may offer this. I may have to see what I can find.
Thank you for reading! If you enjoyed Spilled Coffee, please subscribe.
Spilled Coffee grows through word of mouth. Please consider sharing this post with someone who might appreciate it.
Disclaimer: This is not investment advice. You should not treat any opinion expressed as a specific inducement to make a particular purchase, investment or follow a particular strategy, but only as an expression of an opinion. Do your own research.


