


Investing Update: Is The Worst Over?
What I'm buying, selling & watching
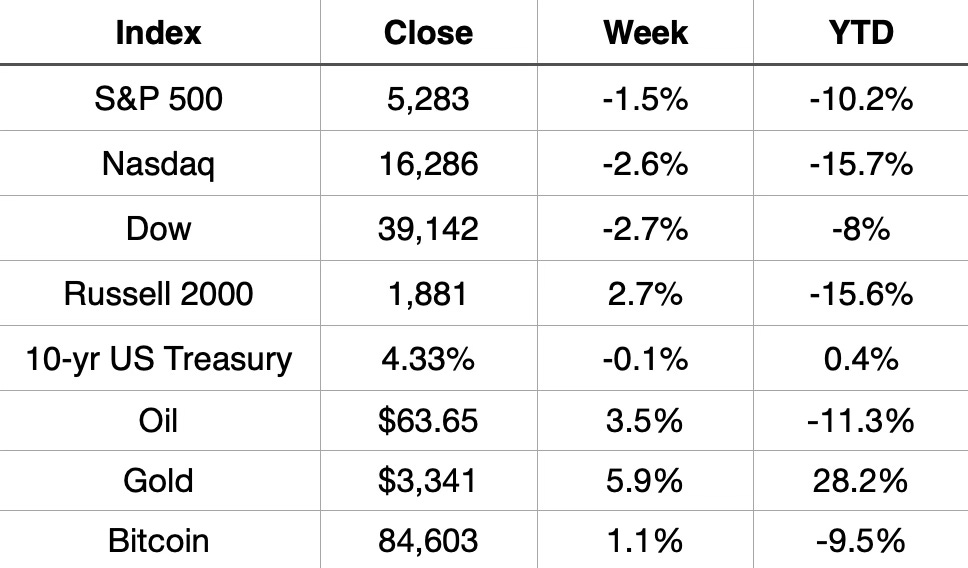
As this market continues to search for direction, after an up week last week, it finished down this week.
All the major indices fell.
S&P 500 -1.5%
Nasdaq -2.6%
Dow -2.7%.
YTD the S&P 500 is down 10.2%, the Nasdaq down 15.7% and the Dow down 8%.
Market Recap
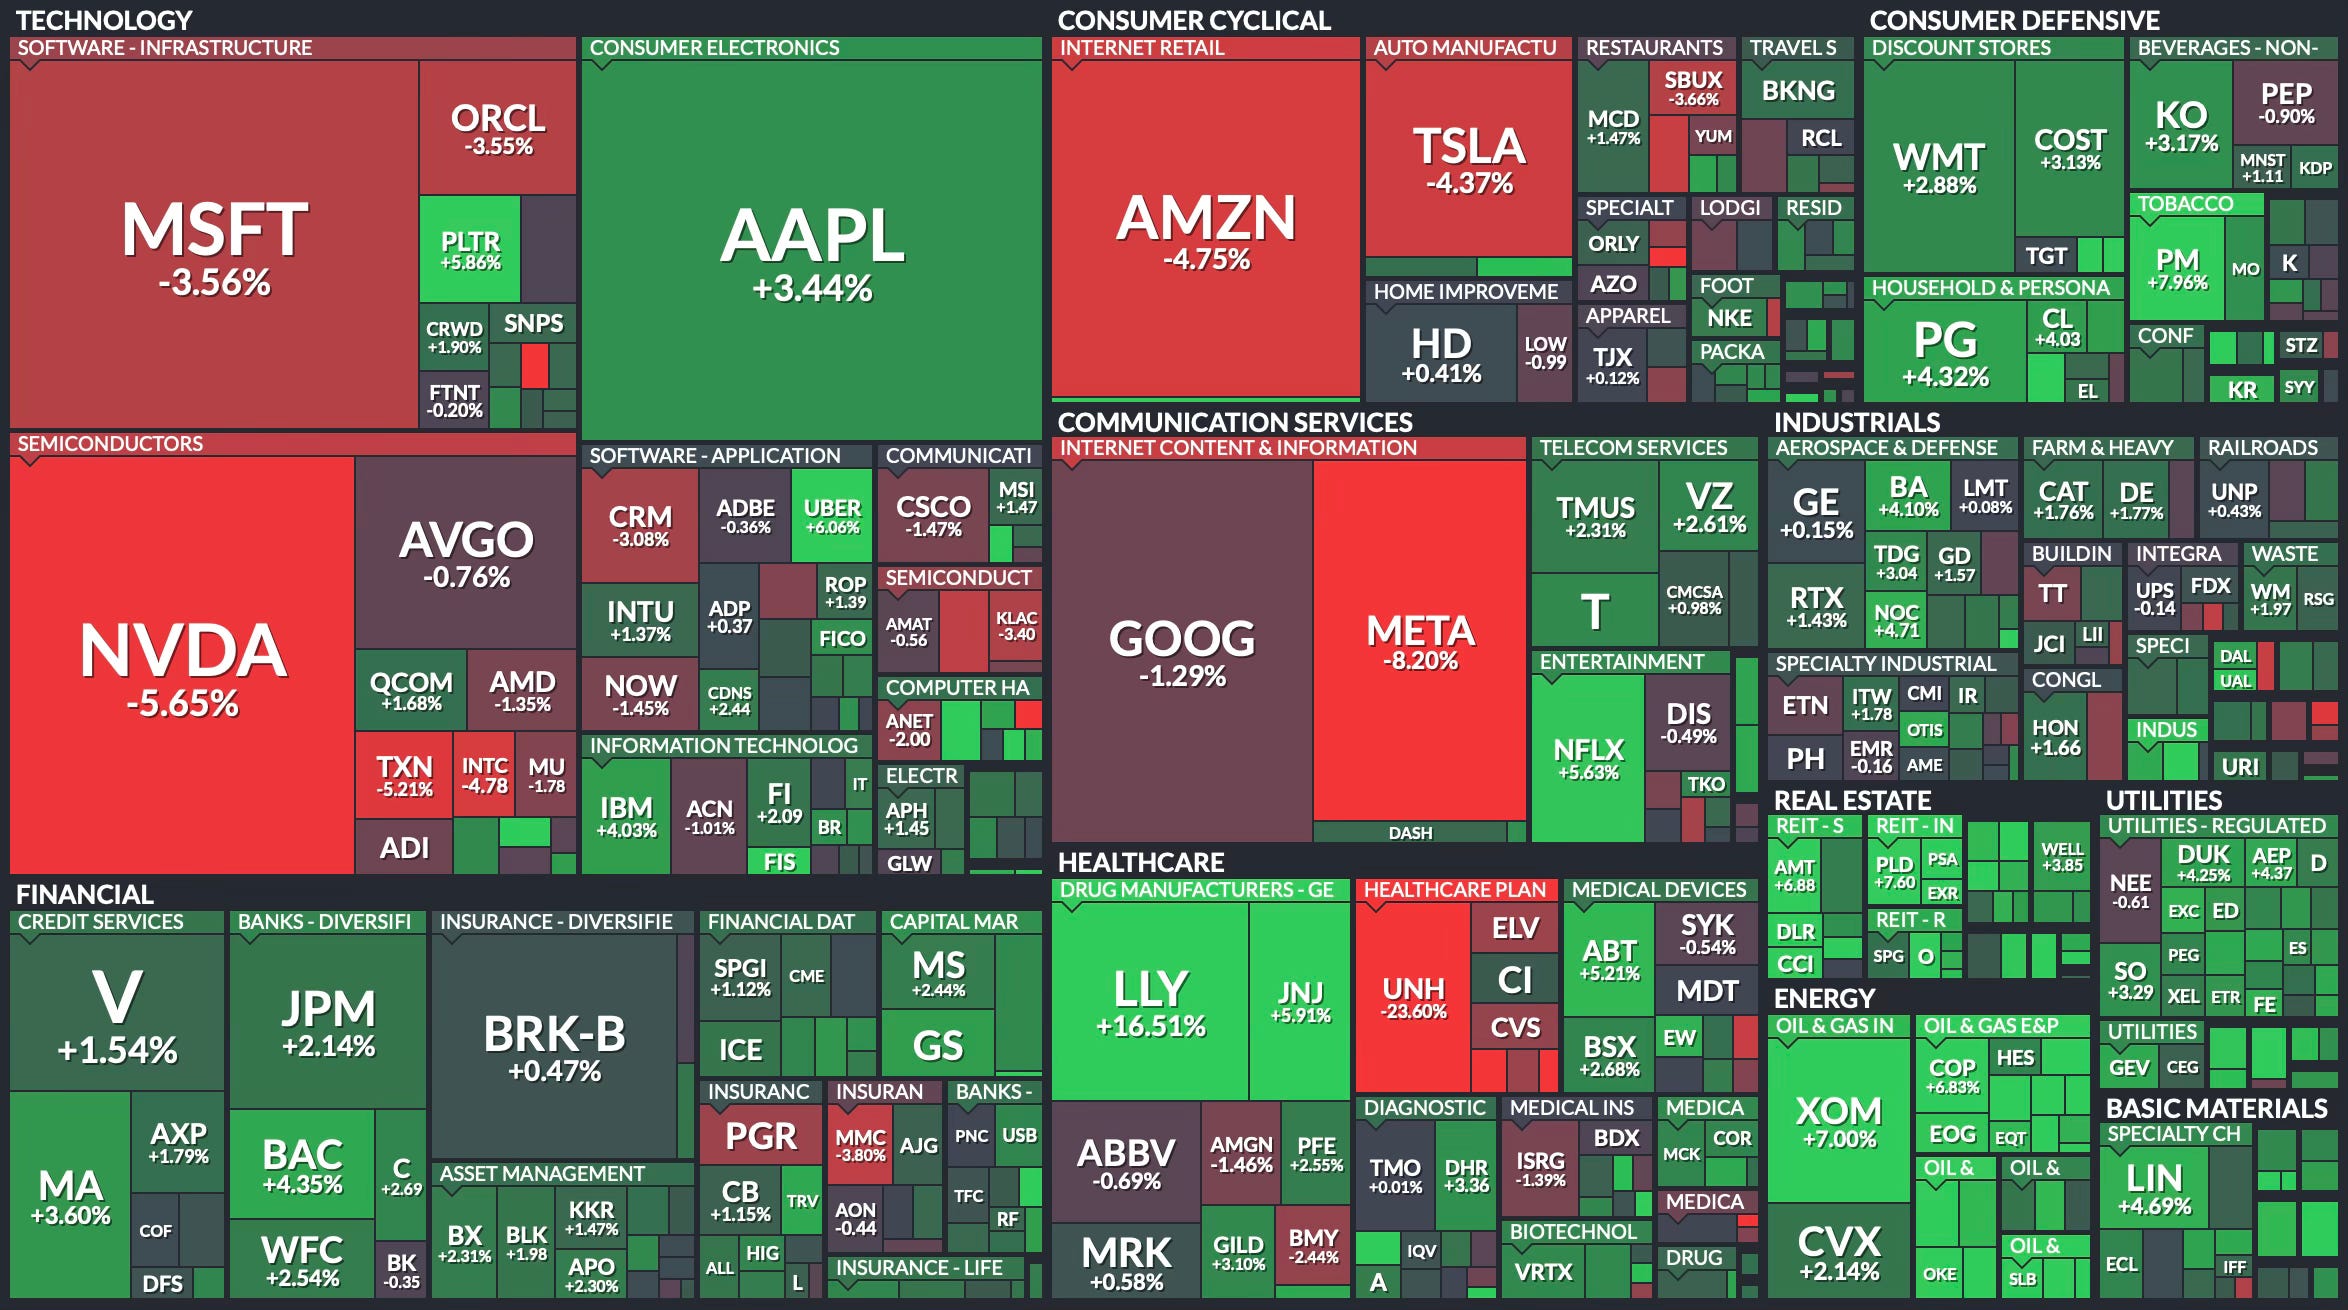
Weekly Heat Map Of Stocks
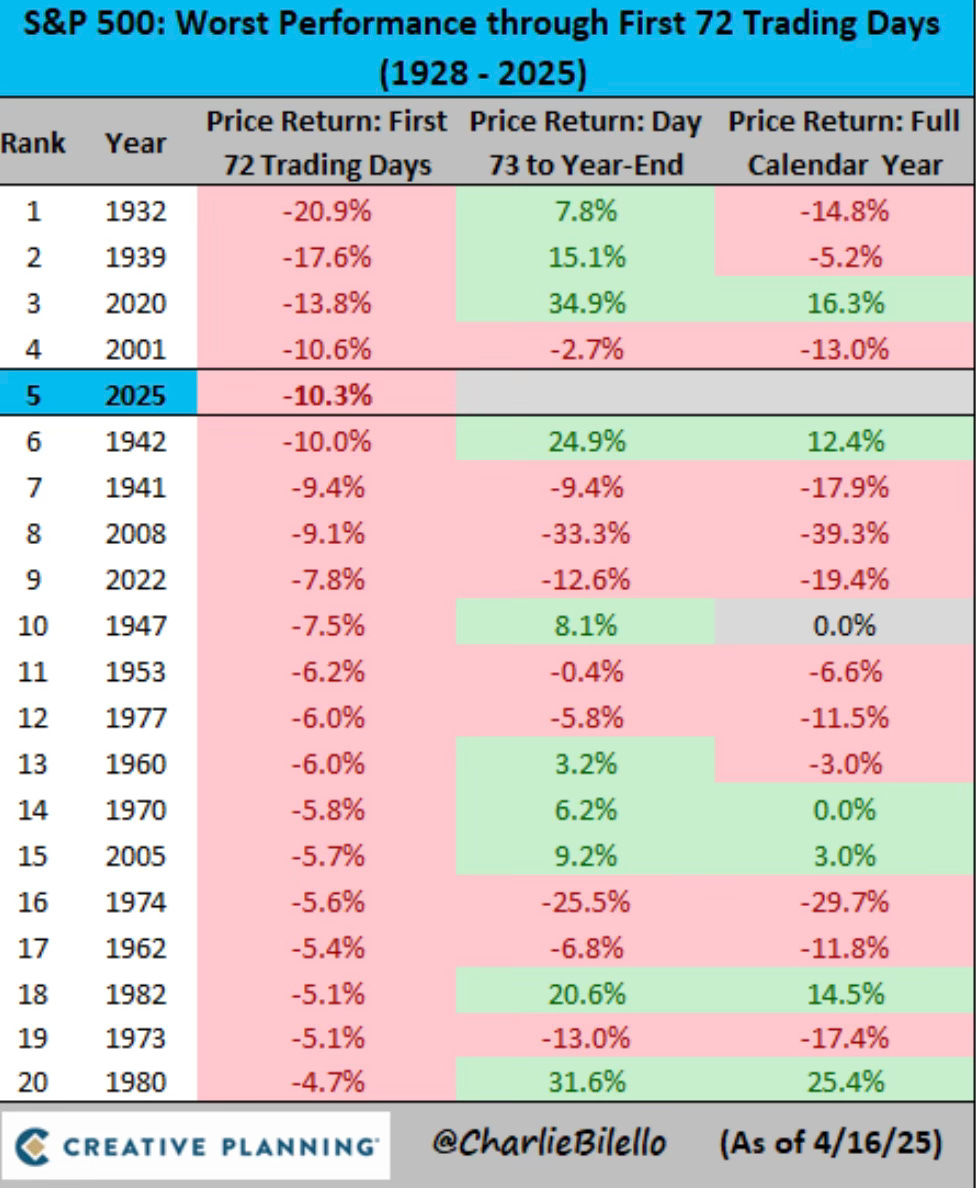
Through the first 72 trading days of the year, this has been the 5th worst start to a year in history.
Now what is surprising about this chart, is that in 3 out of the 4 years ahead of this year, day 73 forward to the end of the year was actually positive. 2001 was the one exception.
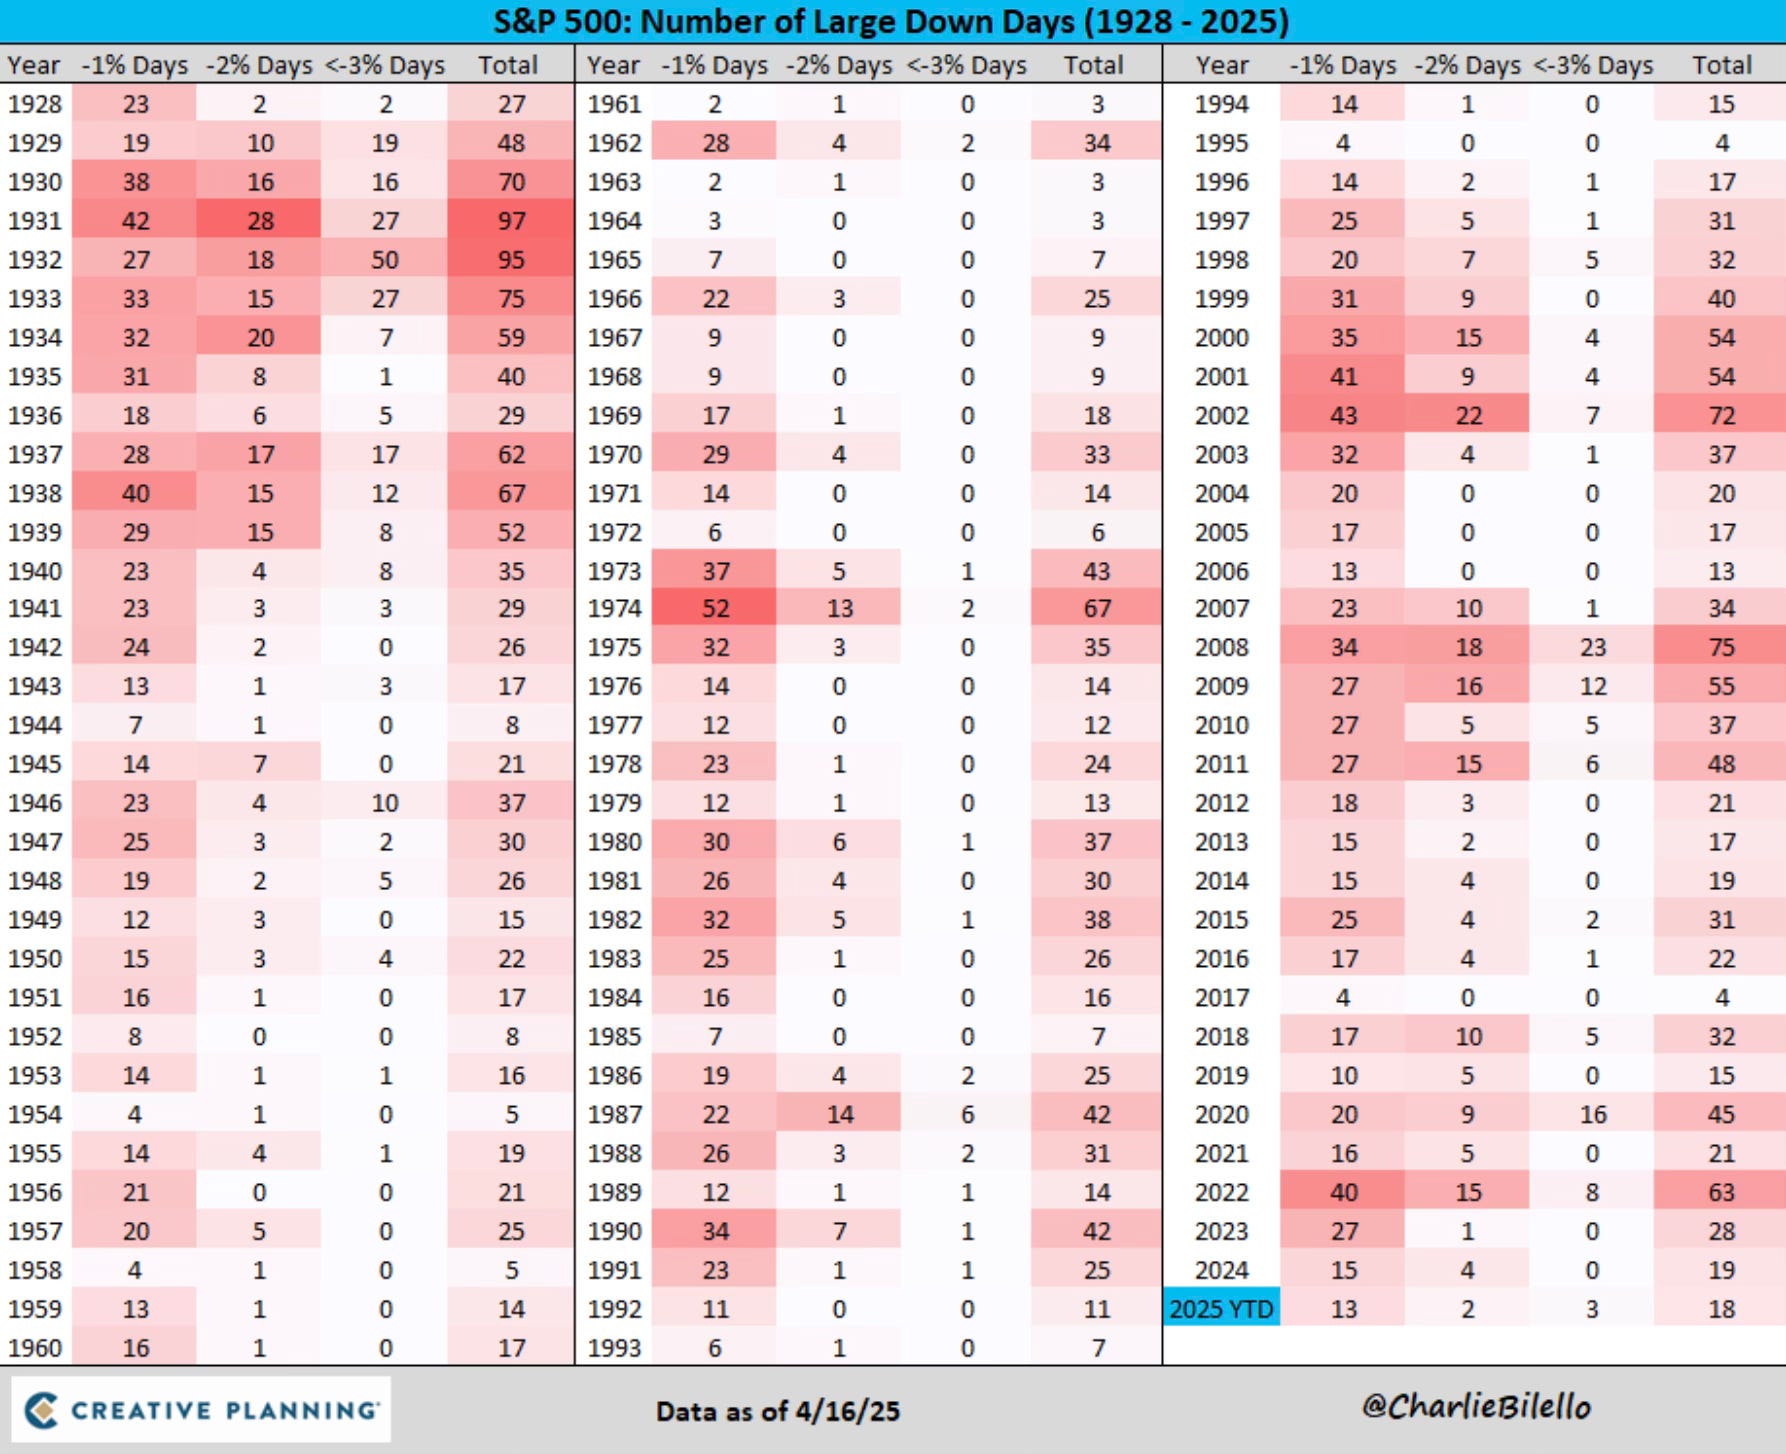
You can see how much volatility has already occurred in 2025. Through this week, there has already been 18 large down days. In all of 2024, there were only 19 large down days all year.
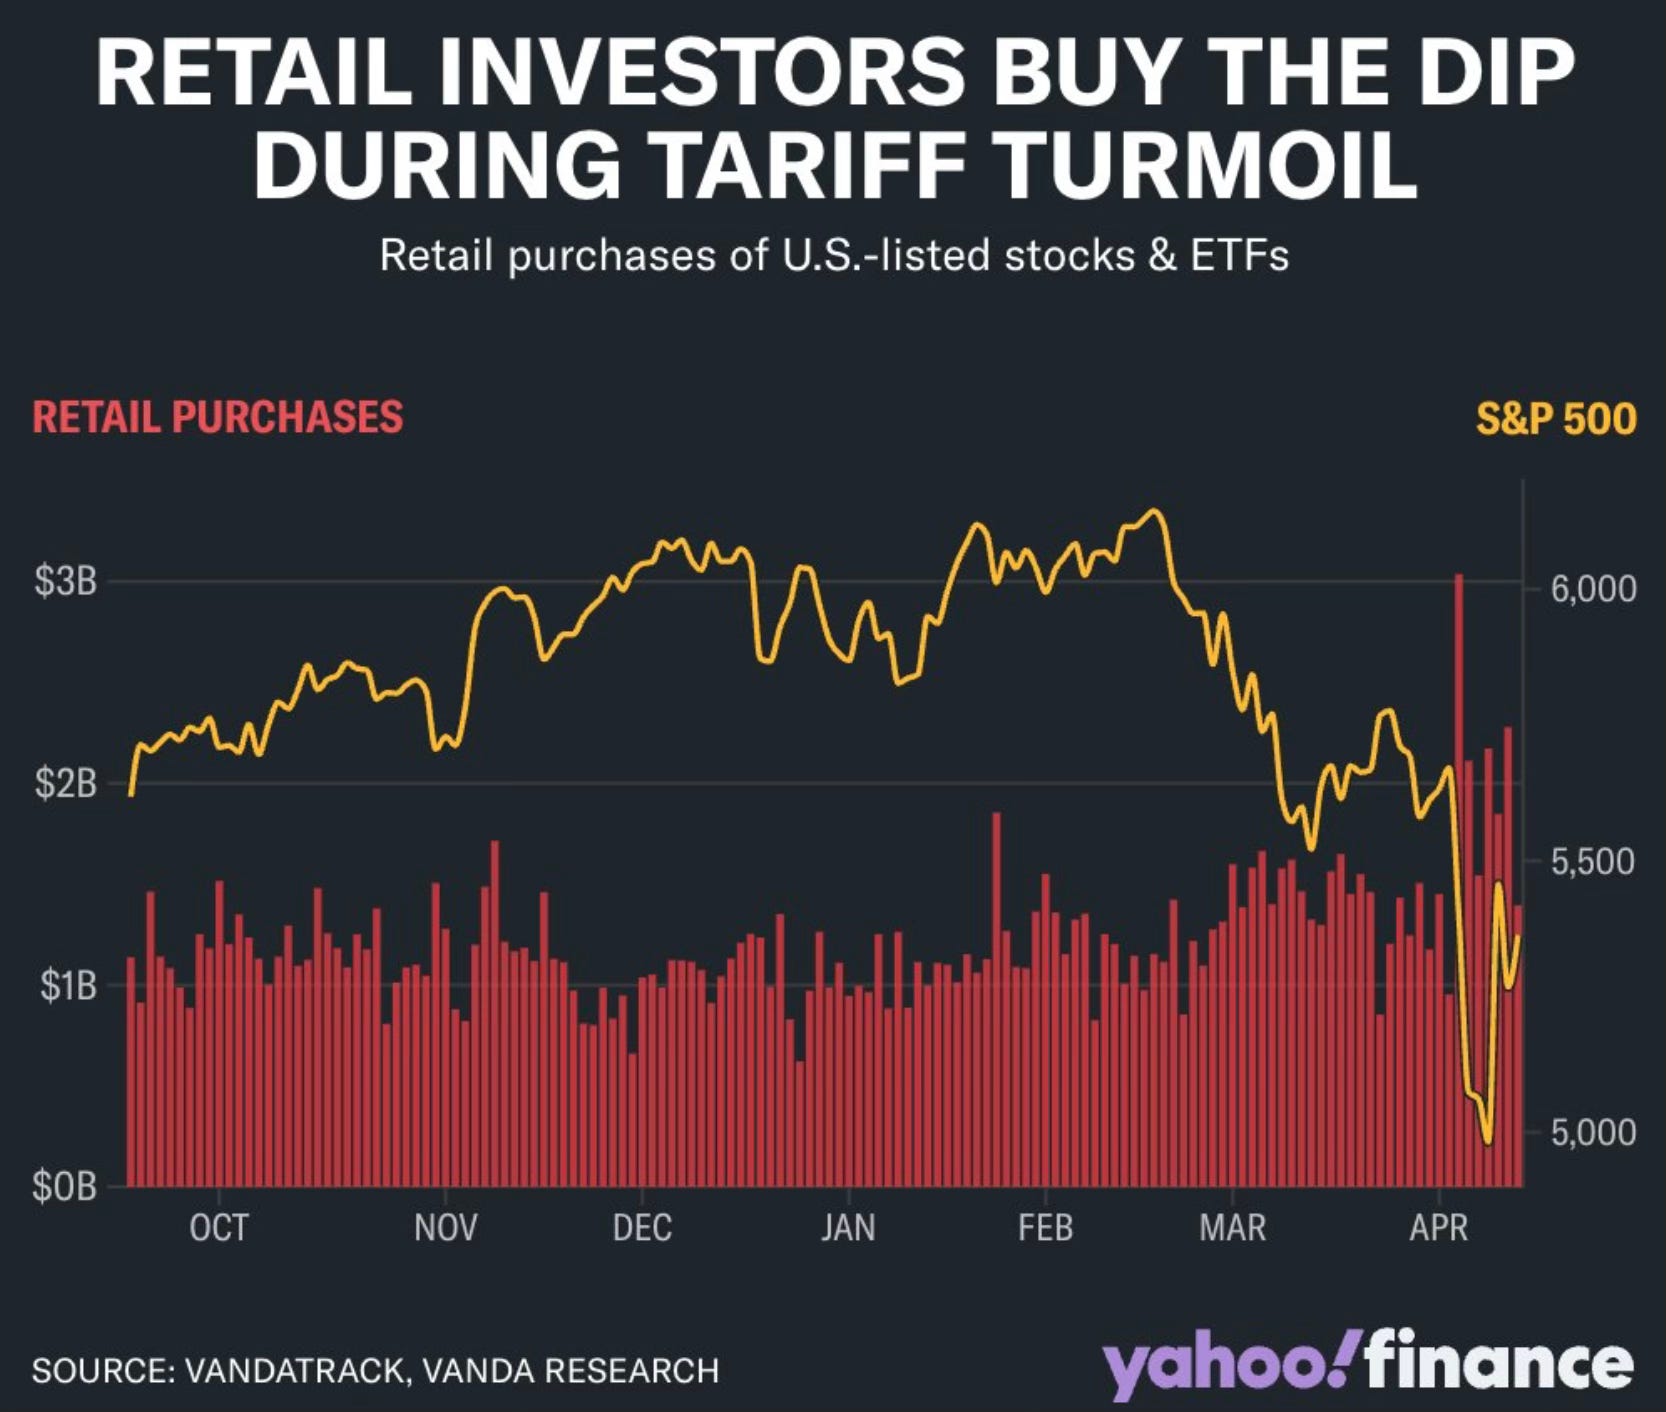
Through all this volatility, retail investors continue to buy the dip. They have not let up on buying.
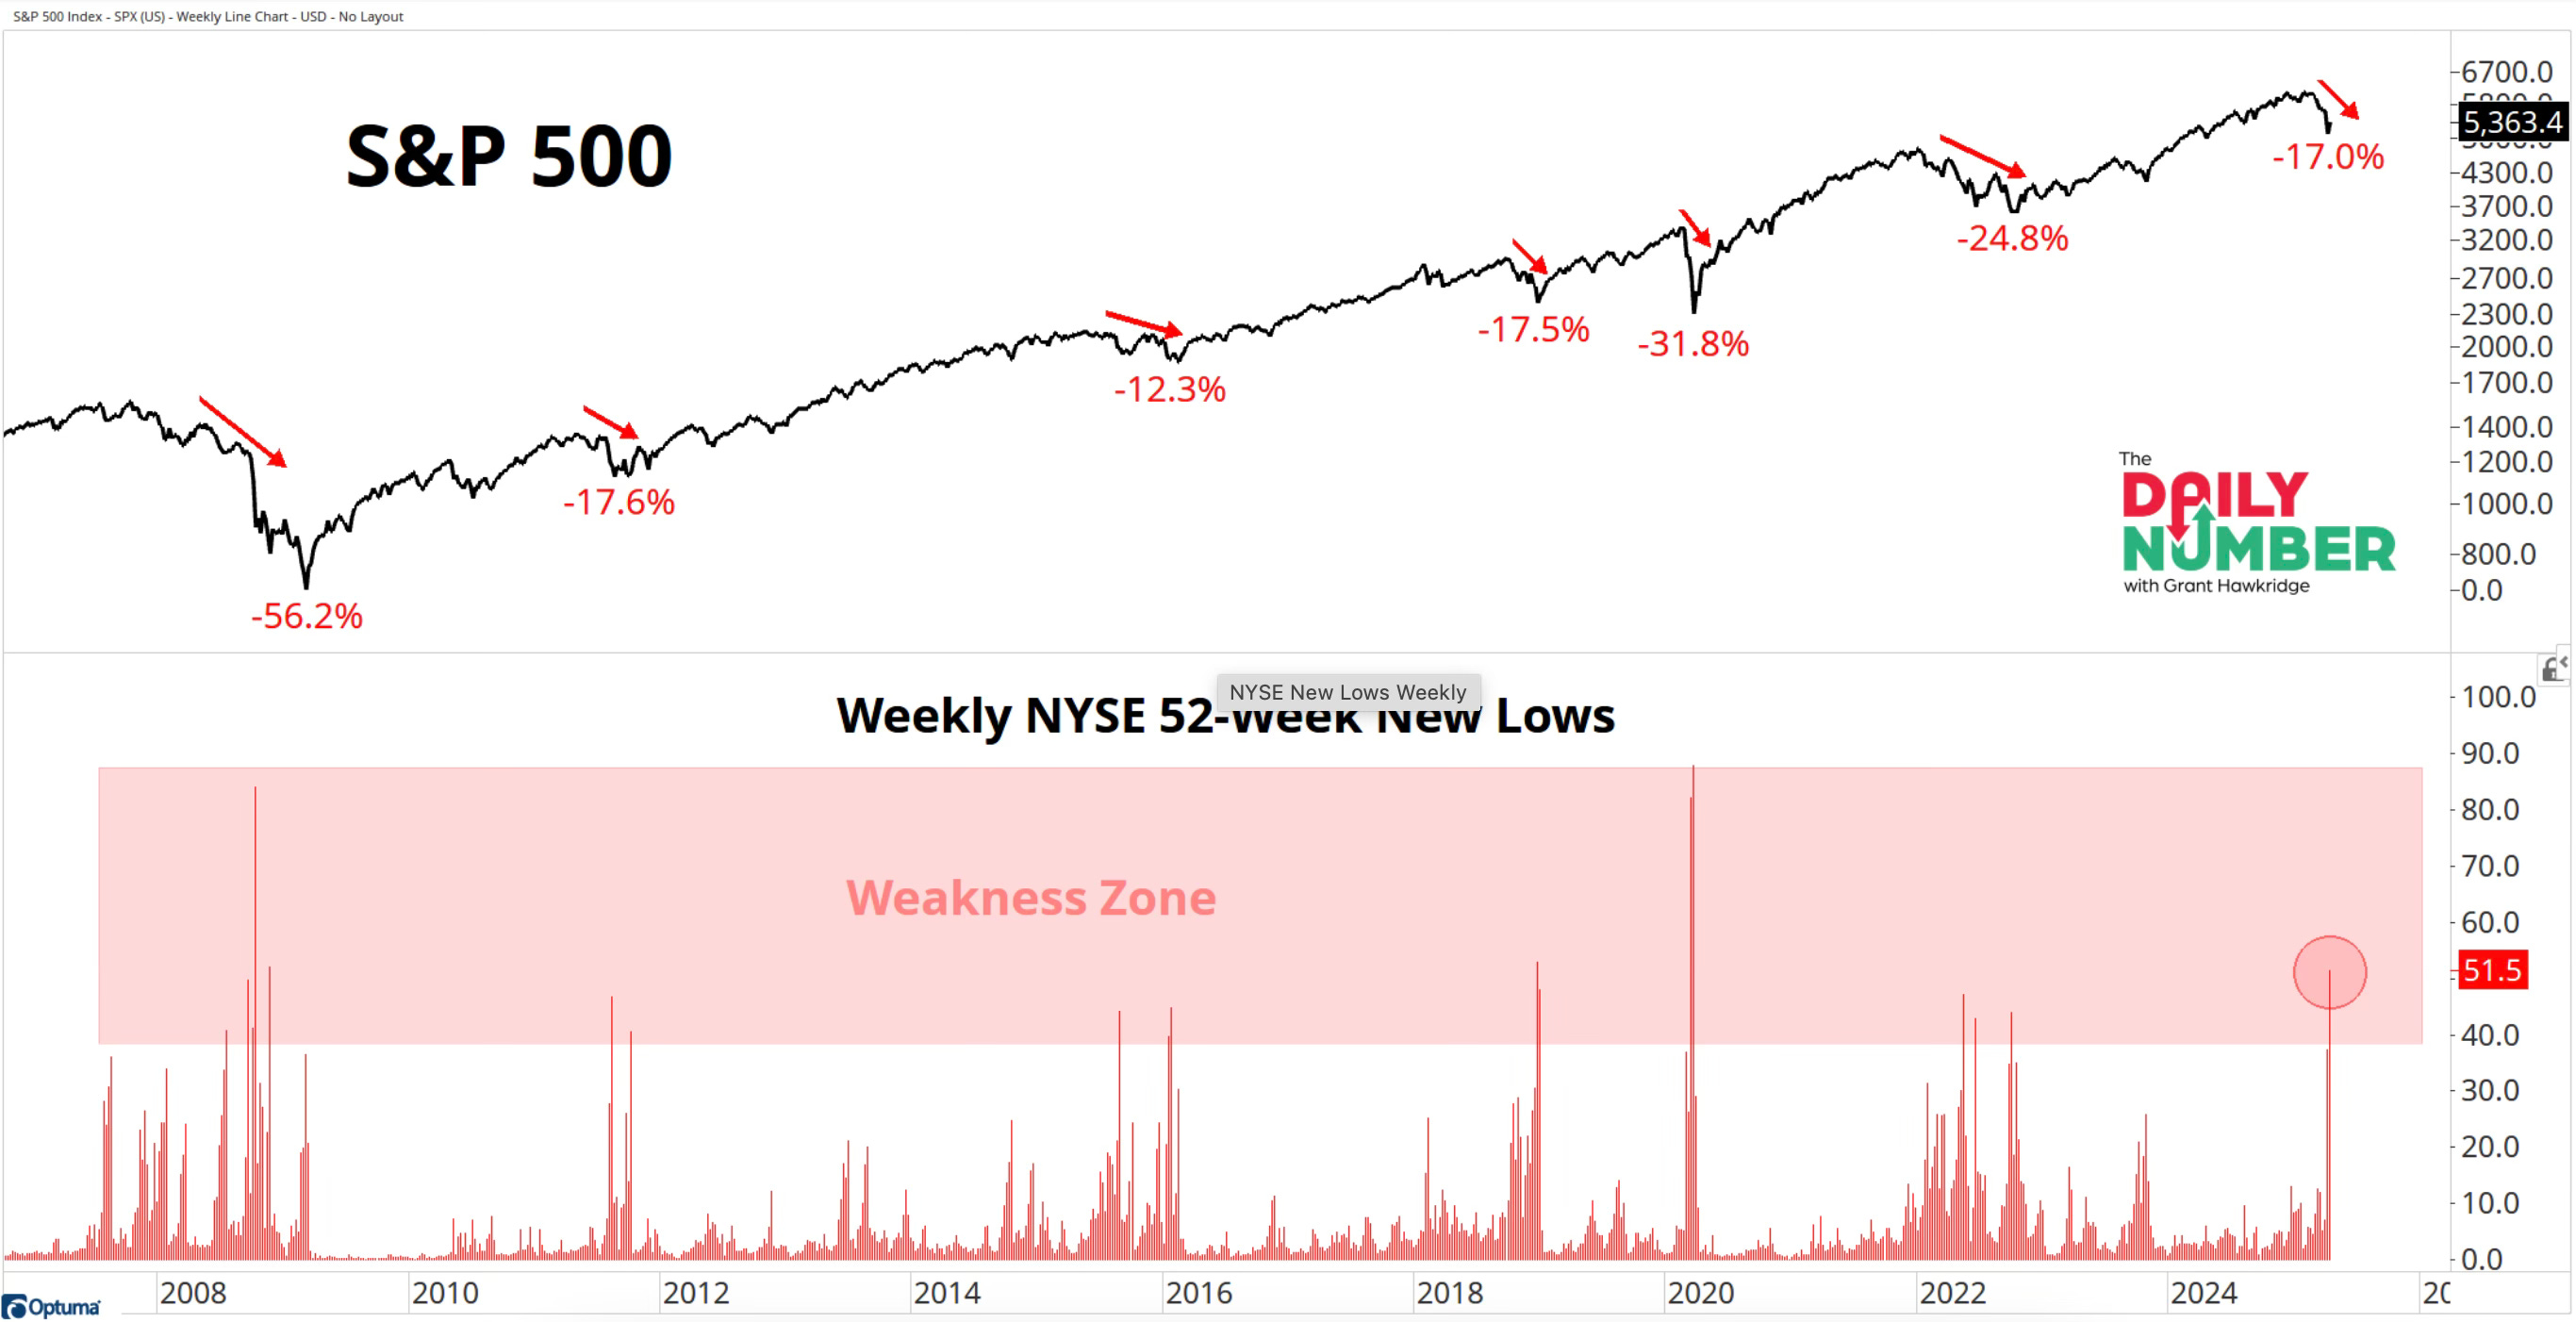
This comes on the heels of more than 50% of stocks on the NYSE hitting new 52-week lows last week. That’s the 4th highest level over the last 17 years.
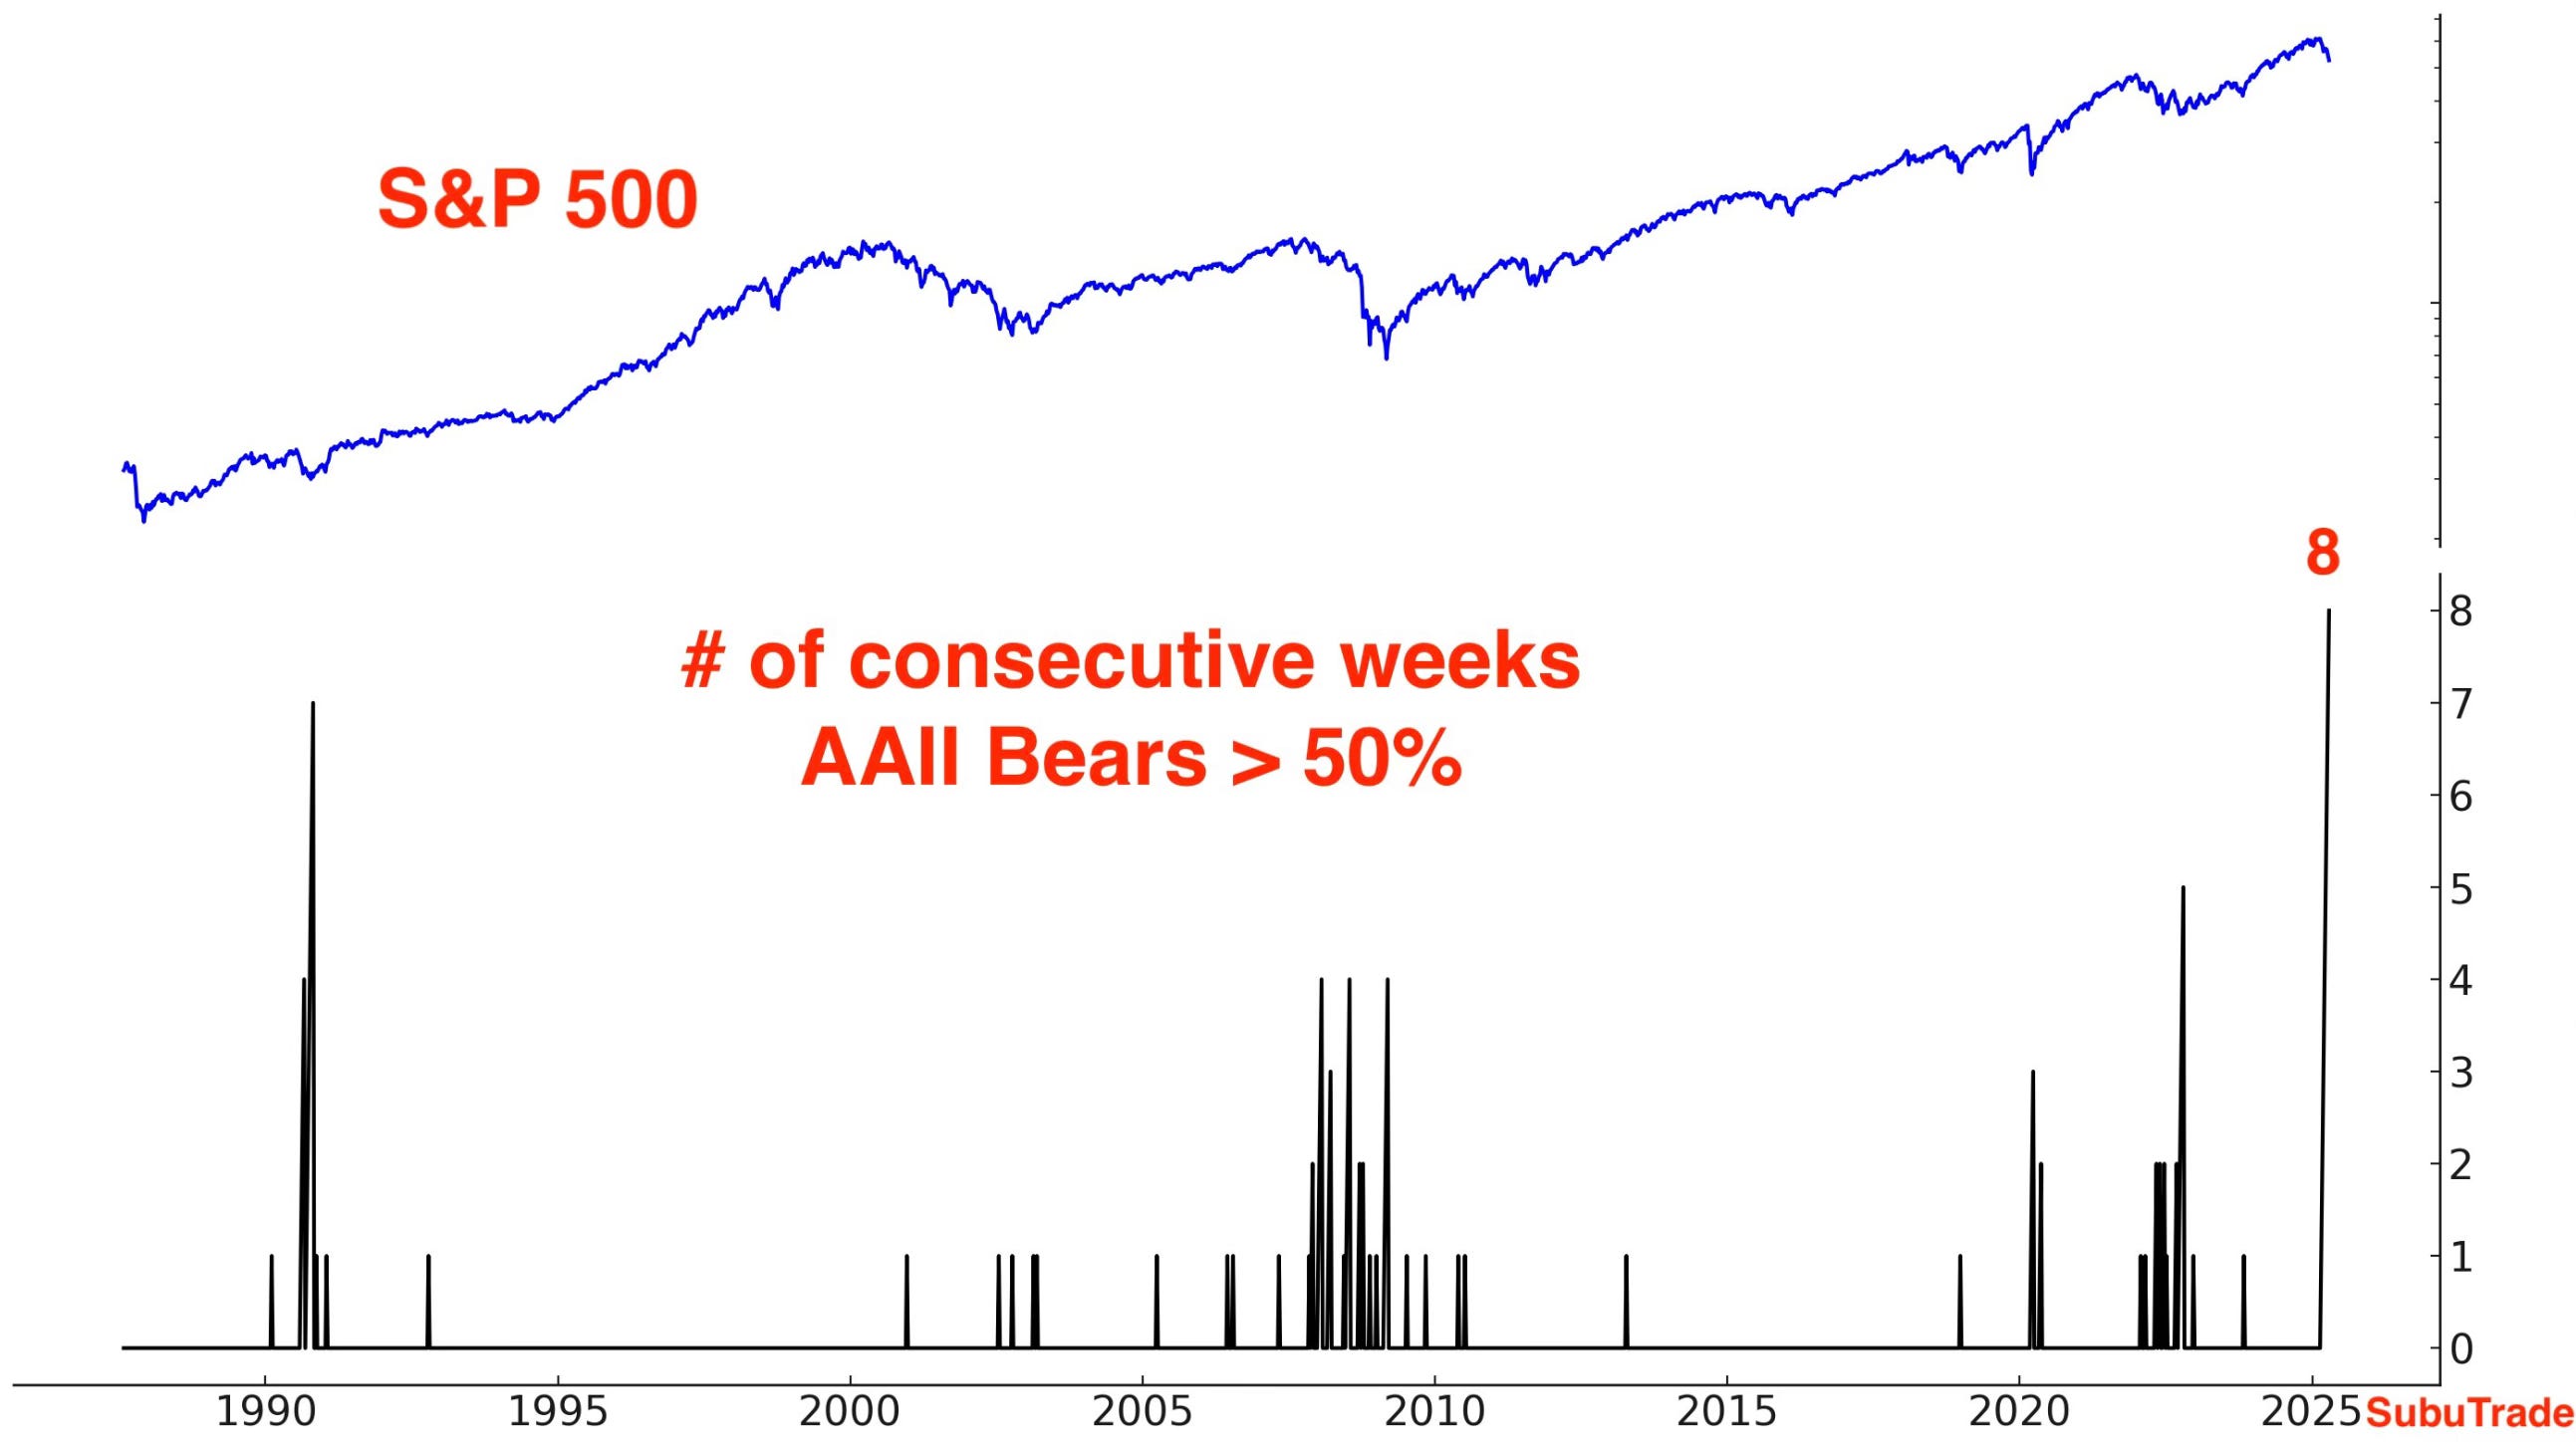
This has pushed the AAII bears over 56%. This is the 8th straight week with over 50% bears. This has actually never happened before. That’s right, never. Not during the 1990 bear market, dot-com collapse, 2008, or COVID.
I mean sentiment is literally in the toilet.
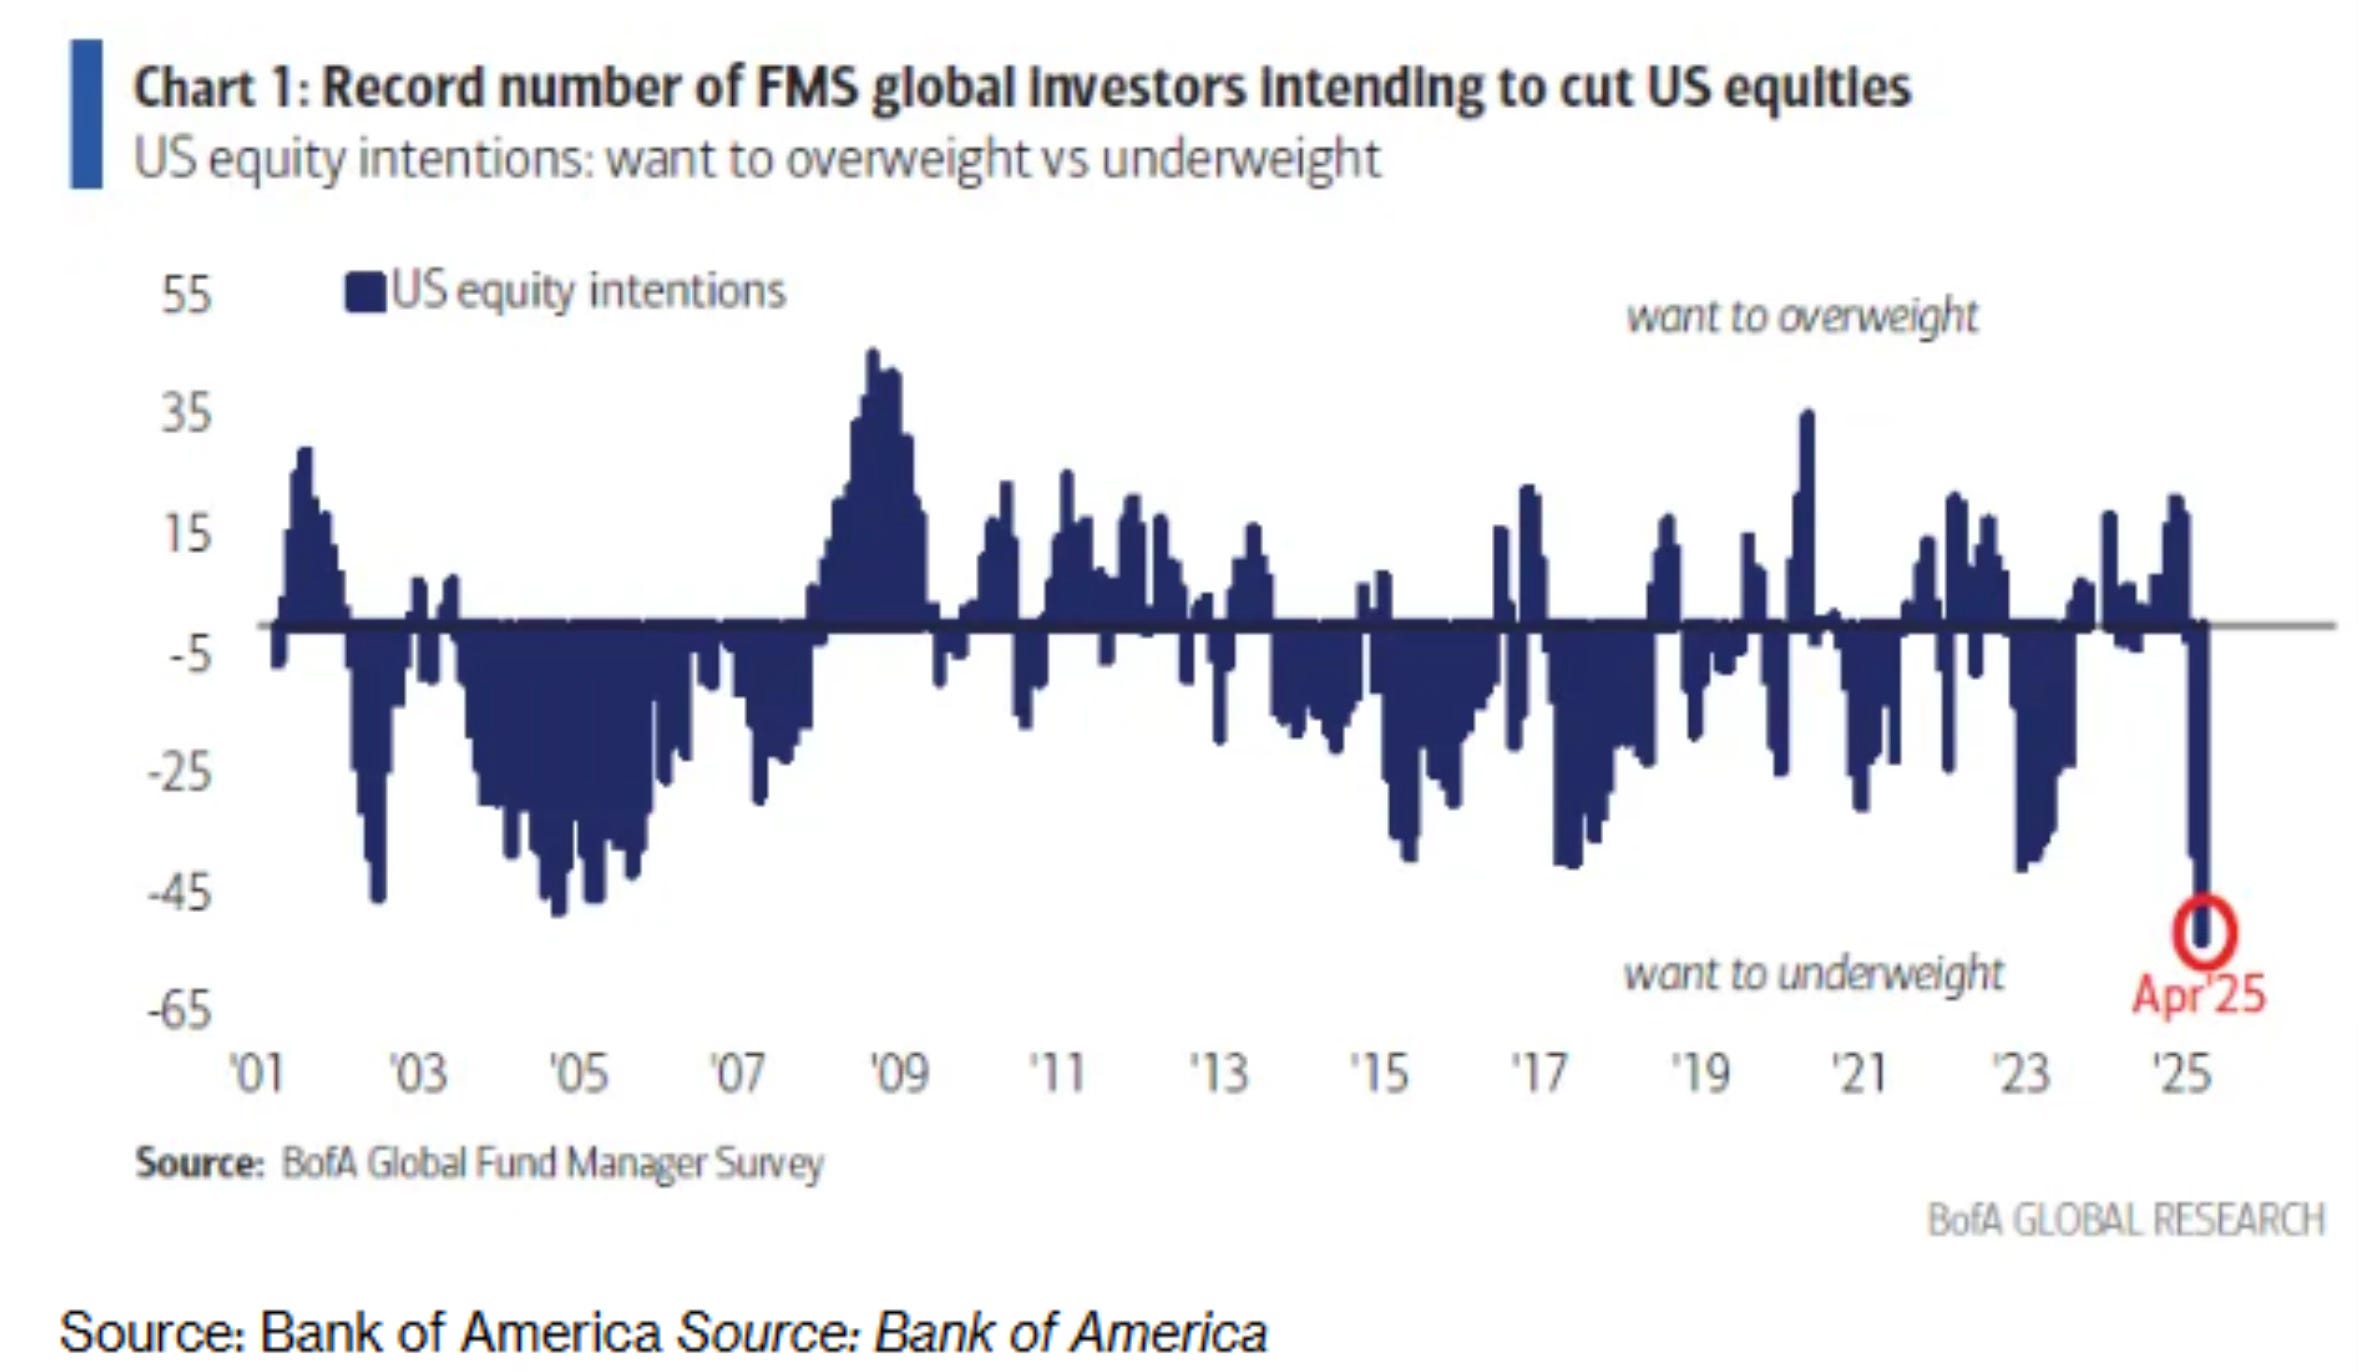
The BofA global fund managers survey investor sentiment has now sunk to the 5th lowest on record.
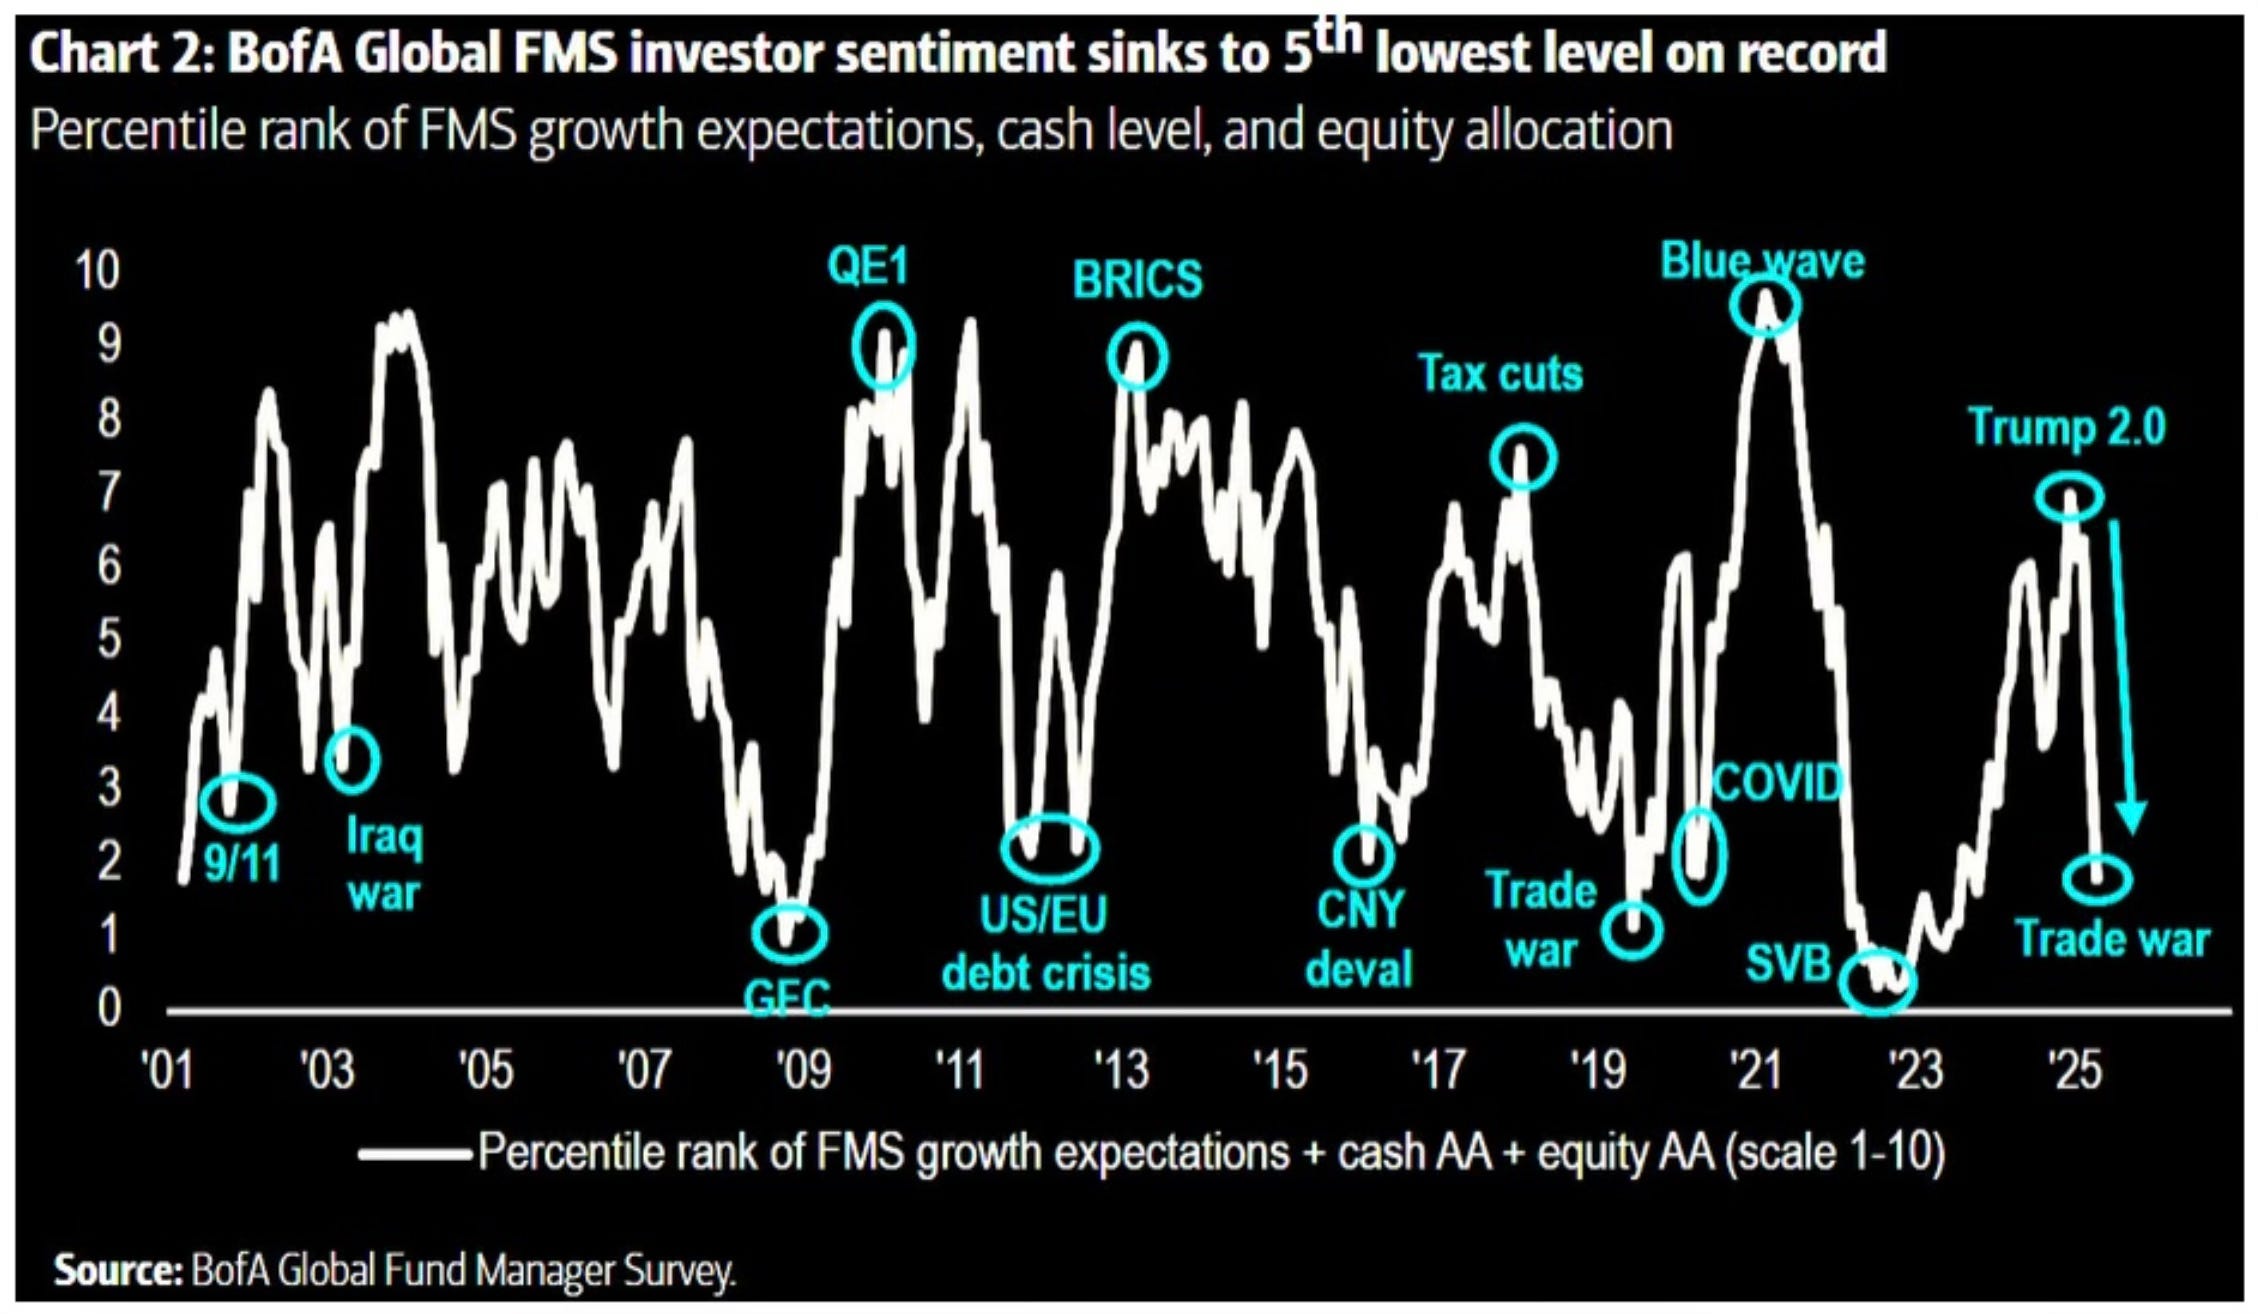
Fund managers haven’t been this negative on U.S. assets in over 30 years.
Does this mean the worst is over? Let’s take a look.