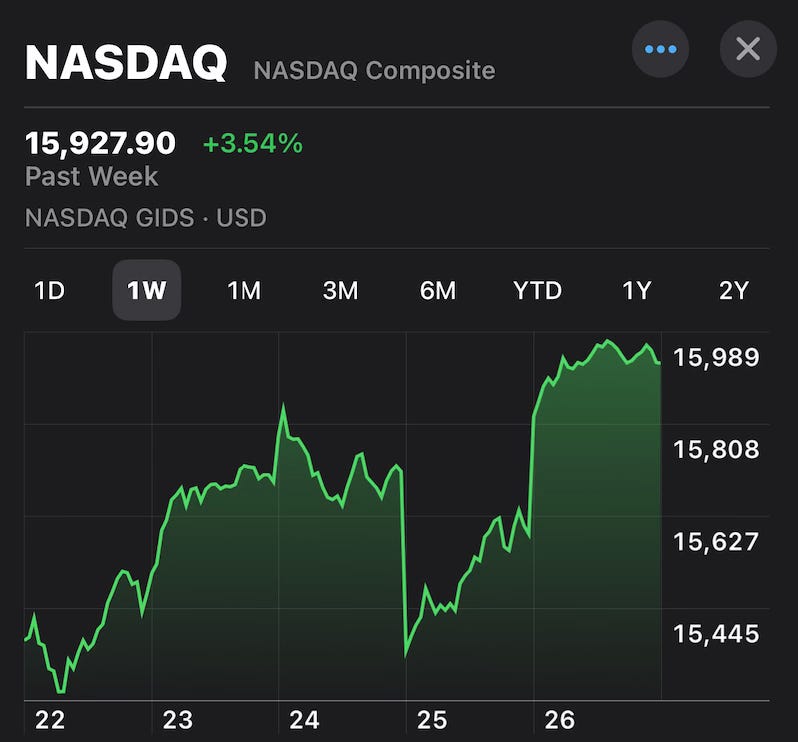
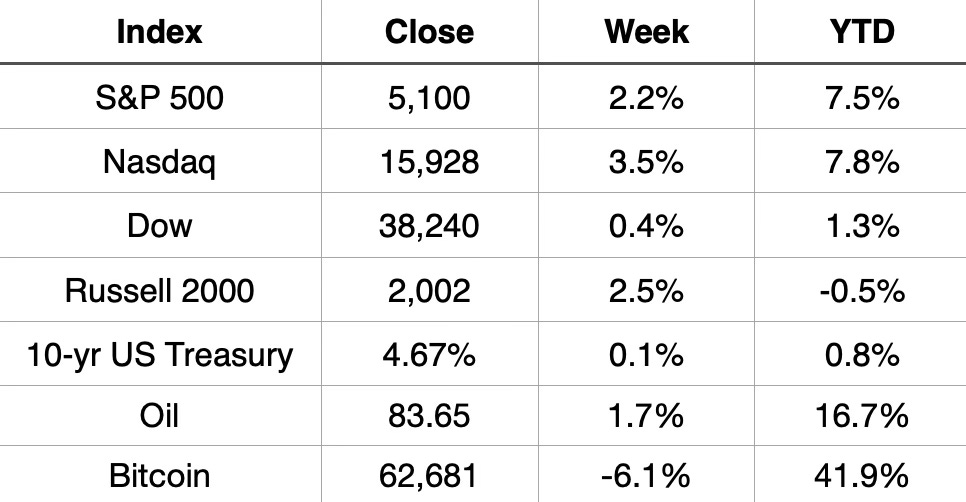
We saw a nice bounce back this week in the stock market. The S&P 500 had its best week in 6 months.
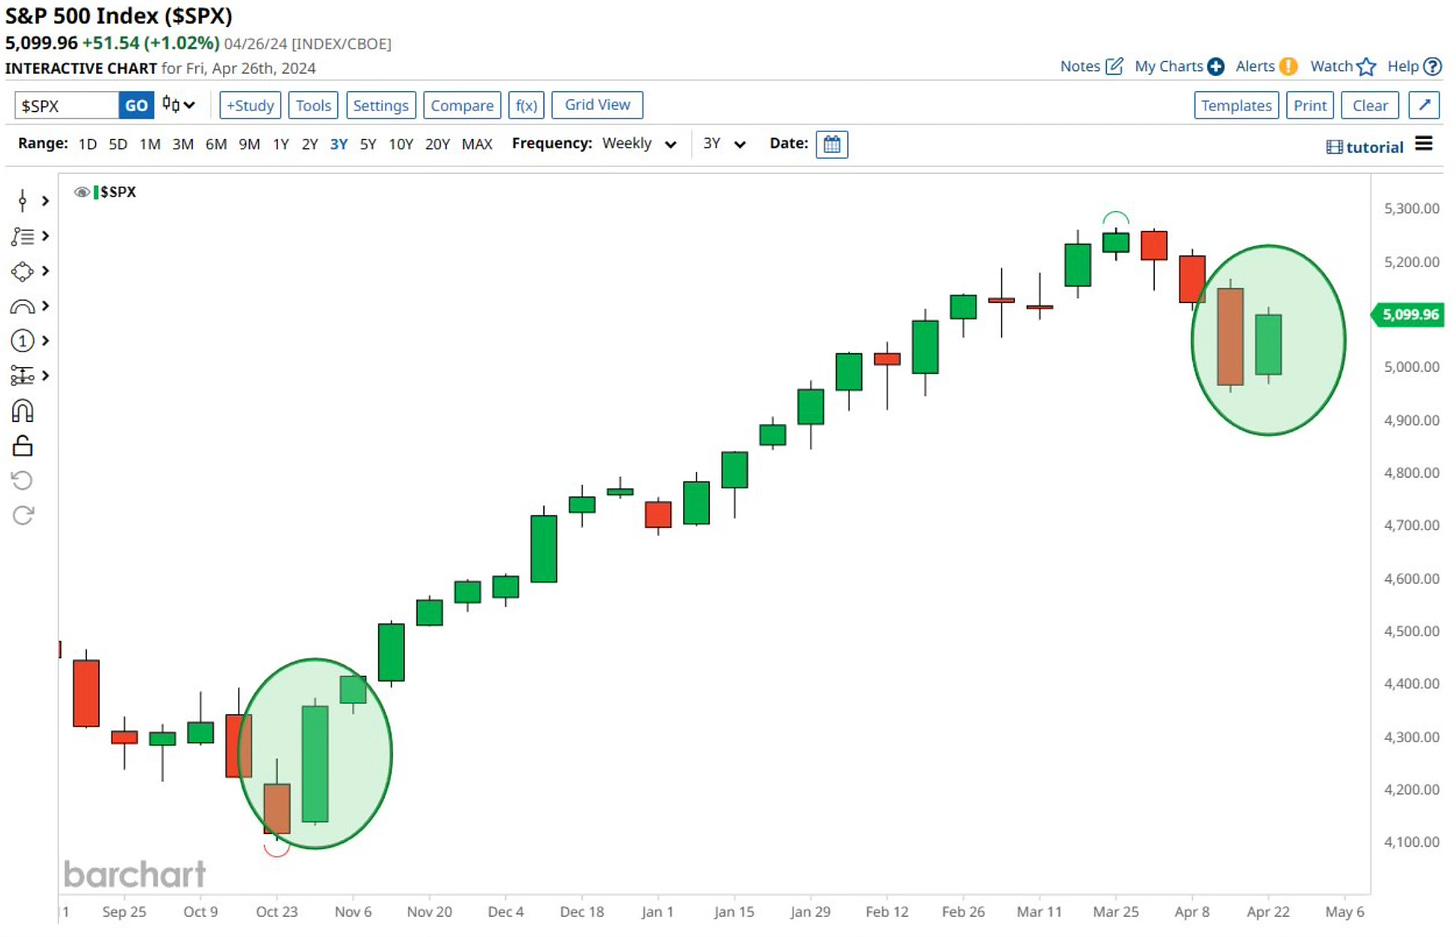
The Nasdaq saw its best day this week in two months and broke a four week losing streak.
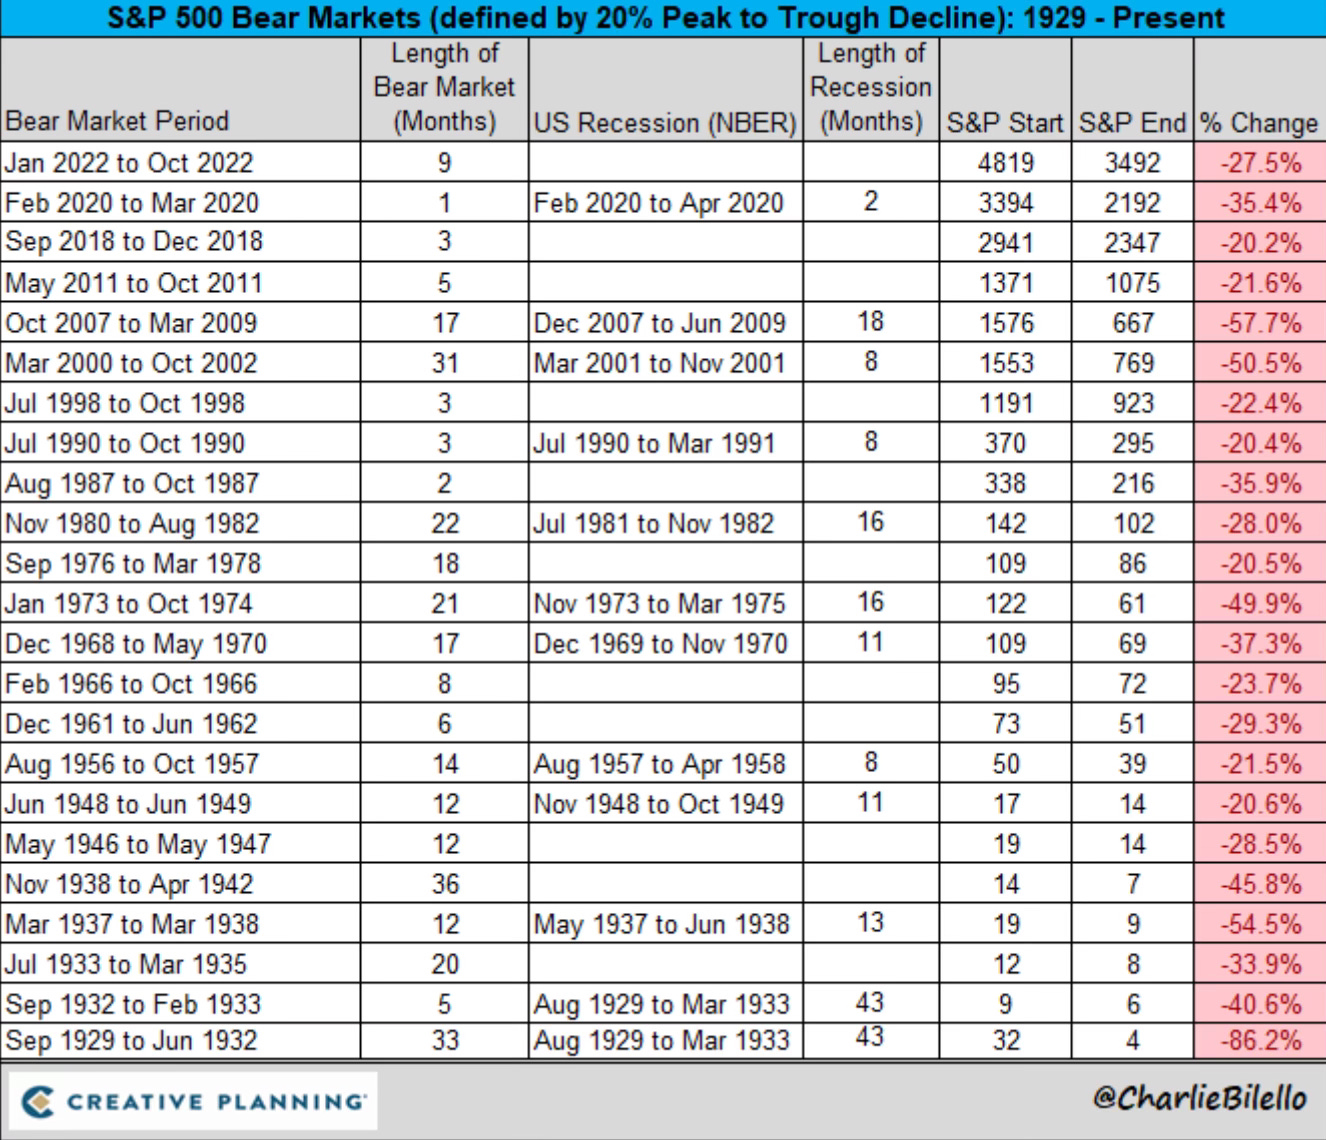
Dip Buying
Never let a good pullback go to waste. I wrote about buying the dip in my update last week. Investing Update: Buy The Dip?
Whenever we see a market pullback or correction, too many jump to the words bear market or crash. We fear it can always go much lower. But 20% declines from peak to trough happen far less than you think. This is a great chart that shows these occurrences dating back to 1928.
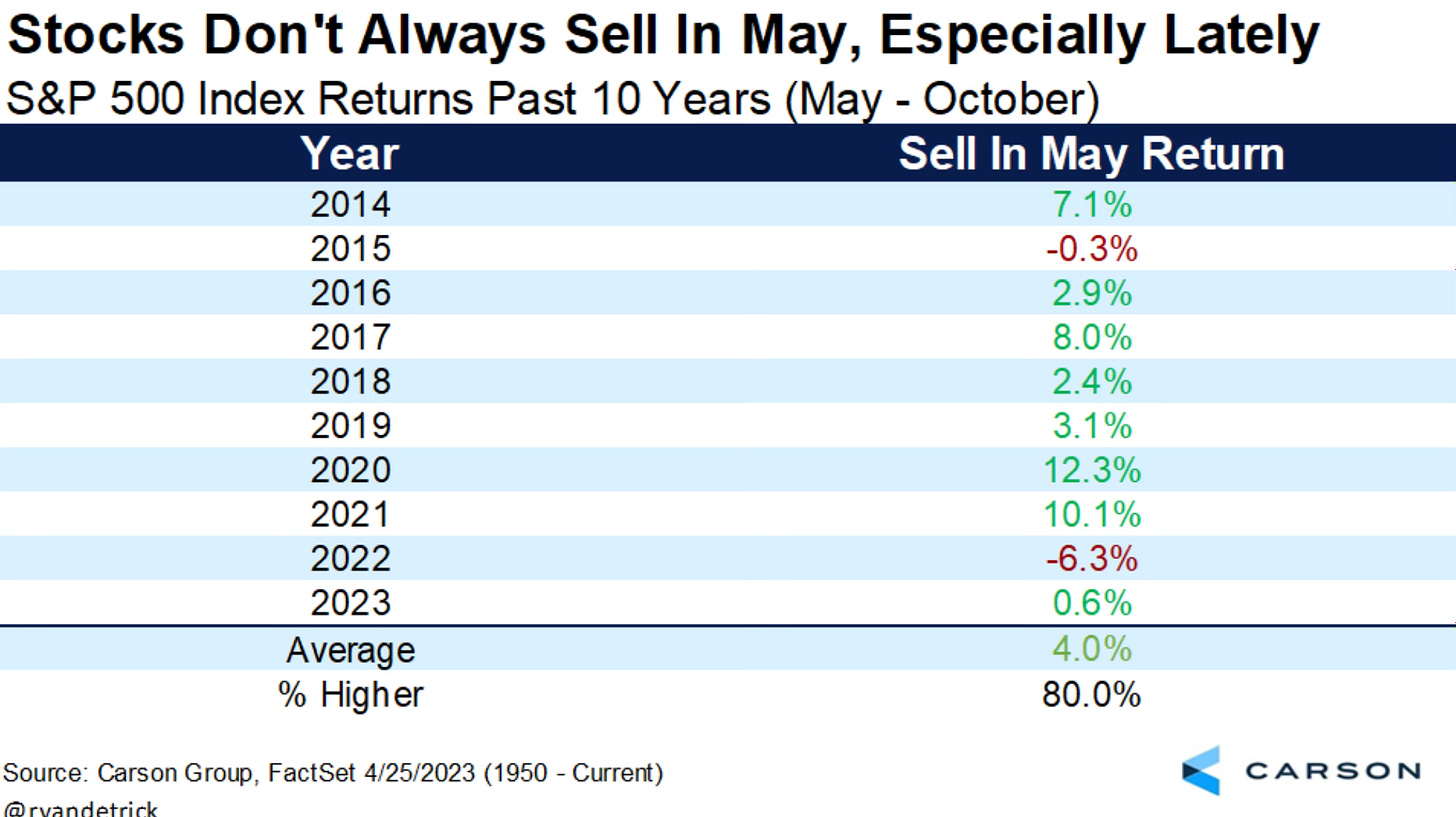
The Road To May
Last week I had shared a chart and wrote Don’t Sell In May & Go Away. Ryan Detrick had a good breakdown that zoomed in to look at how May has fared the past 10 years. Well it has been up in 8 of the past 10 years by an average of 4%. Ryan again proving the point that the old “Sell In May” adage isn’t always correct.
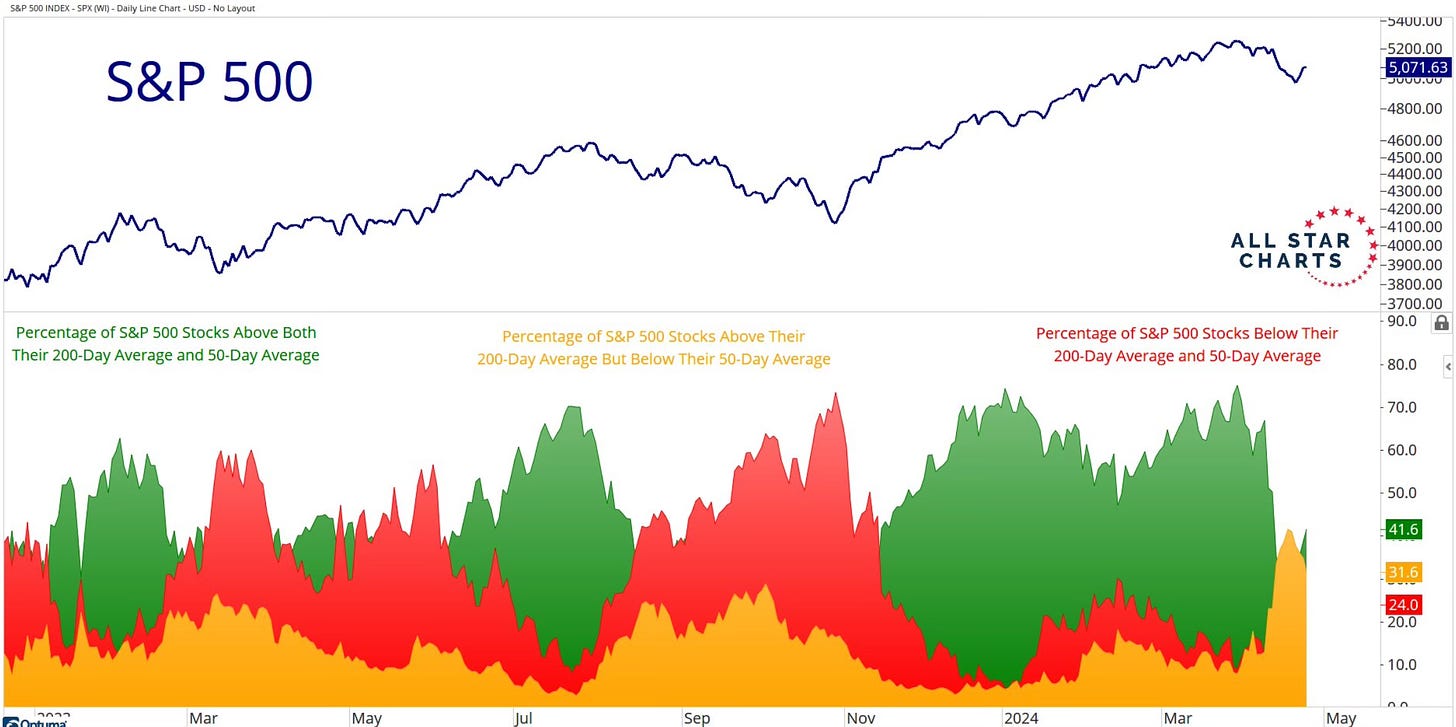
Grant Hawkridge updated this colorful chart which I love, where he has been updating on what the moving averages are showing us. As you can see there is now some green starting to take over the yellow. This is what we want to see and sets things up nicely as we embark upon May.
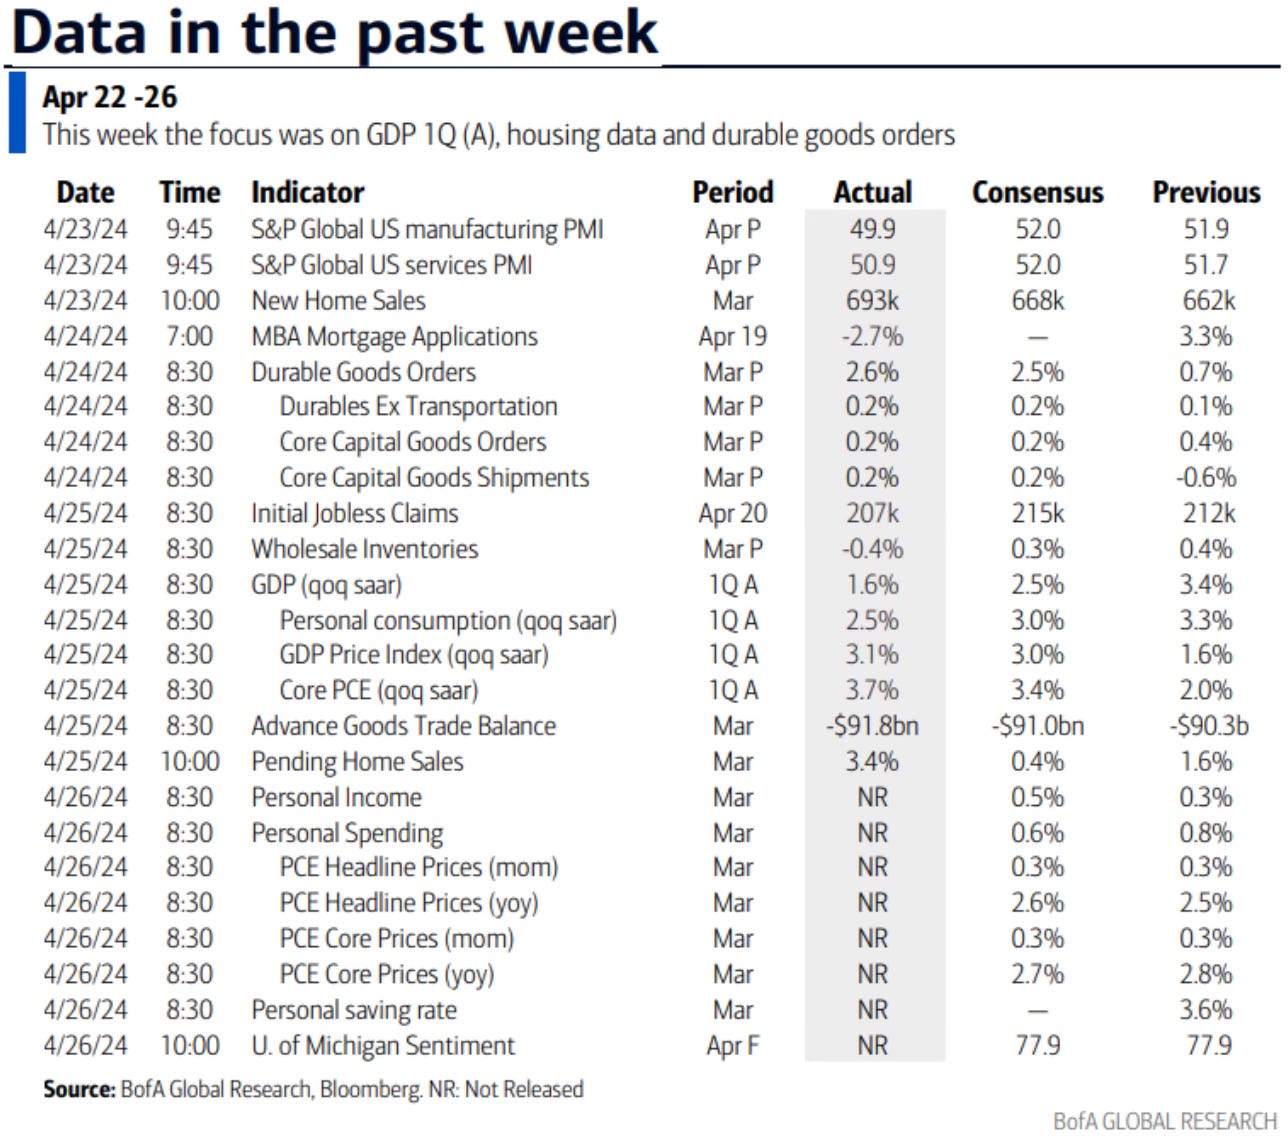
The Debate On Rates
This week saw the 10-year climb over 4.7%. That’s now the highest level since November 1st.
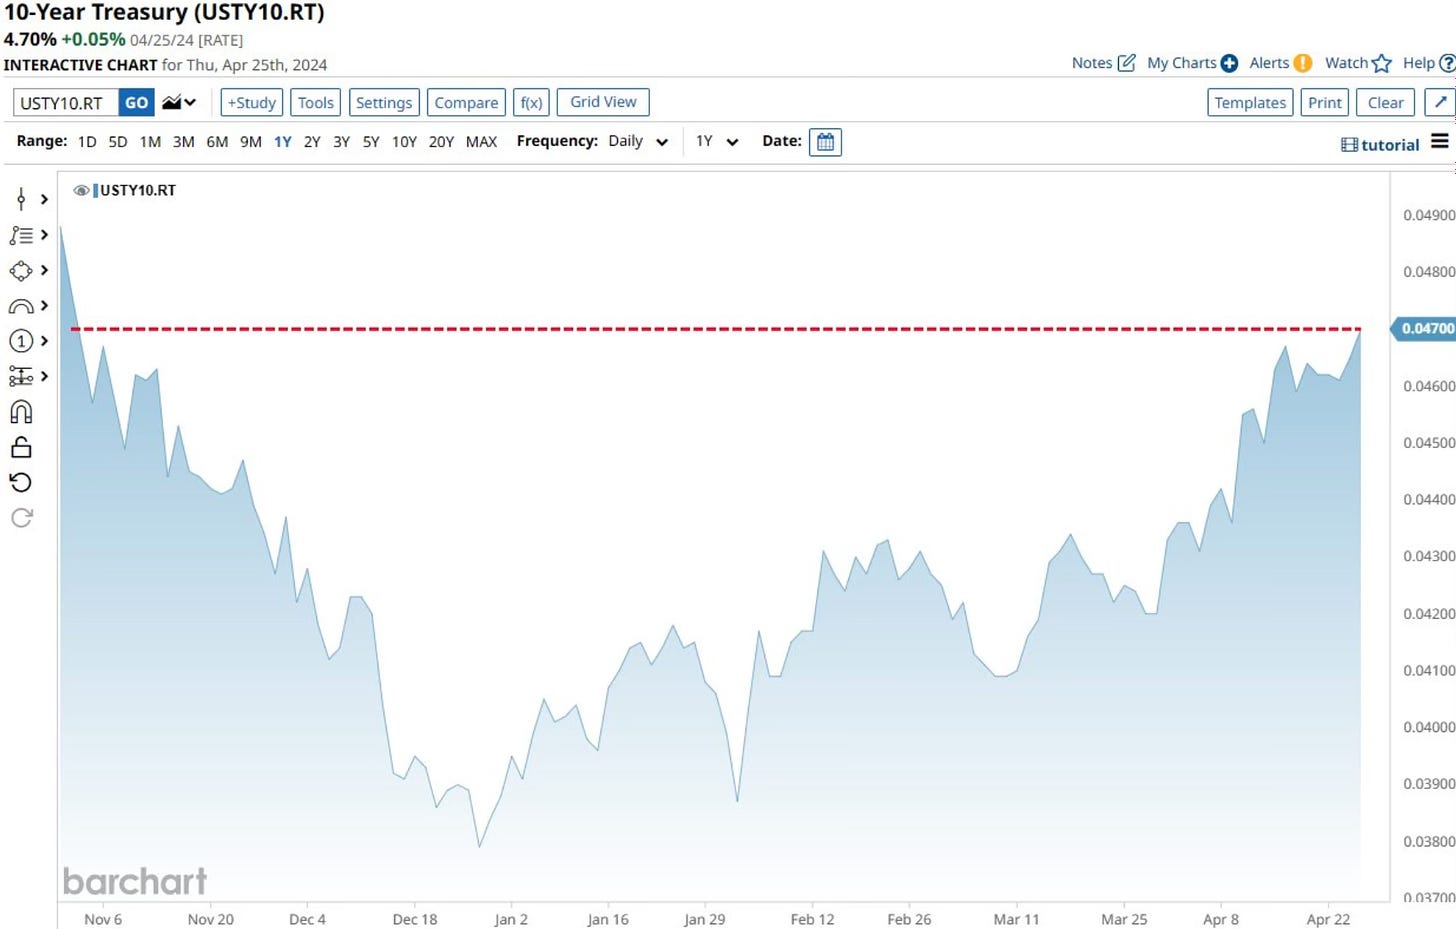
The debate still continues as to whether we will still see a rate cut this year or not. I’m starting to wonder if we possibly even see a rate hike before we see a rate cut. I talked about this and what happens when the 10-year reaches 5% and how the stock market has historically reacted this week in my post Higher For Longer.
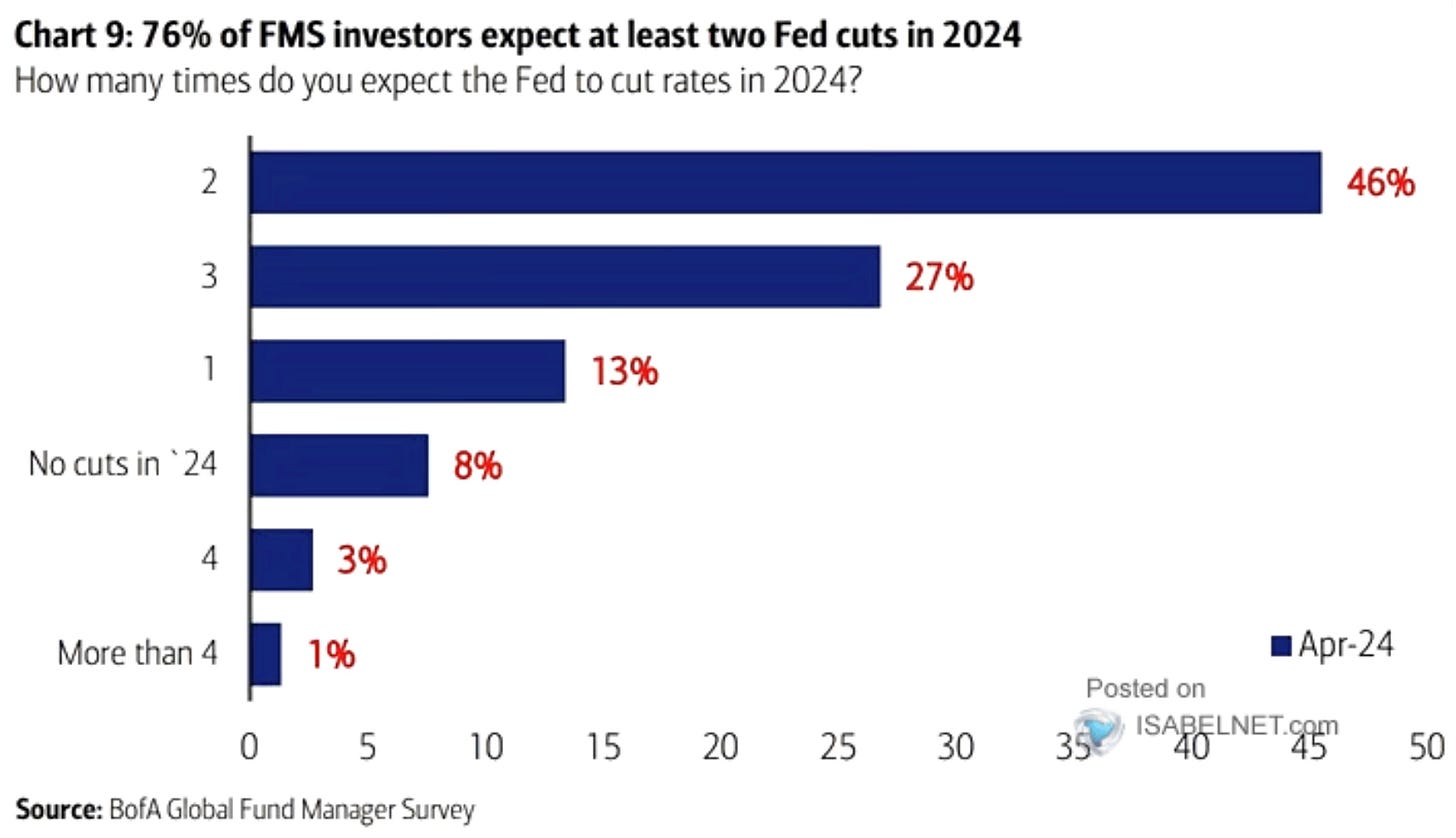
The recent fund managers survey surprised me as 46% still expect 2 rate cuts in 2024. Only 8% expect no rate cuts.
Positive Data
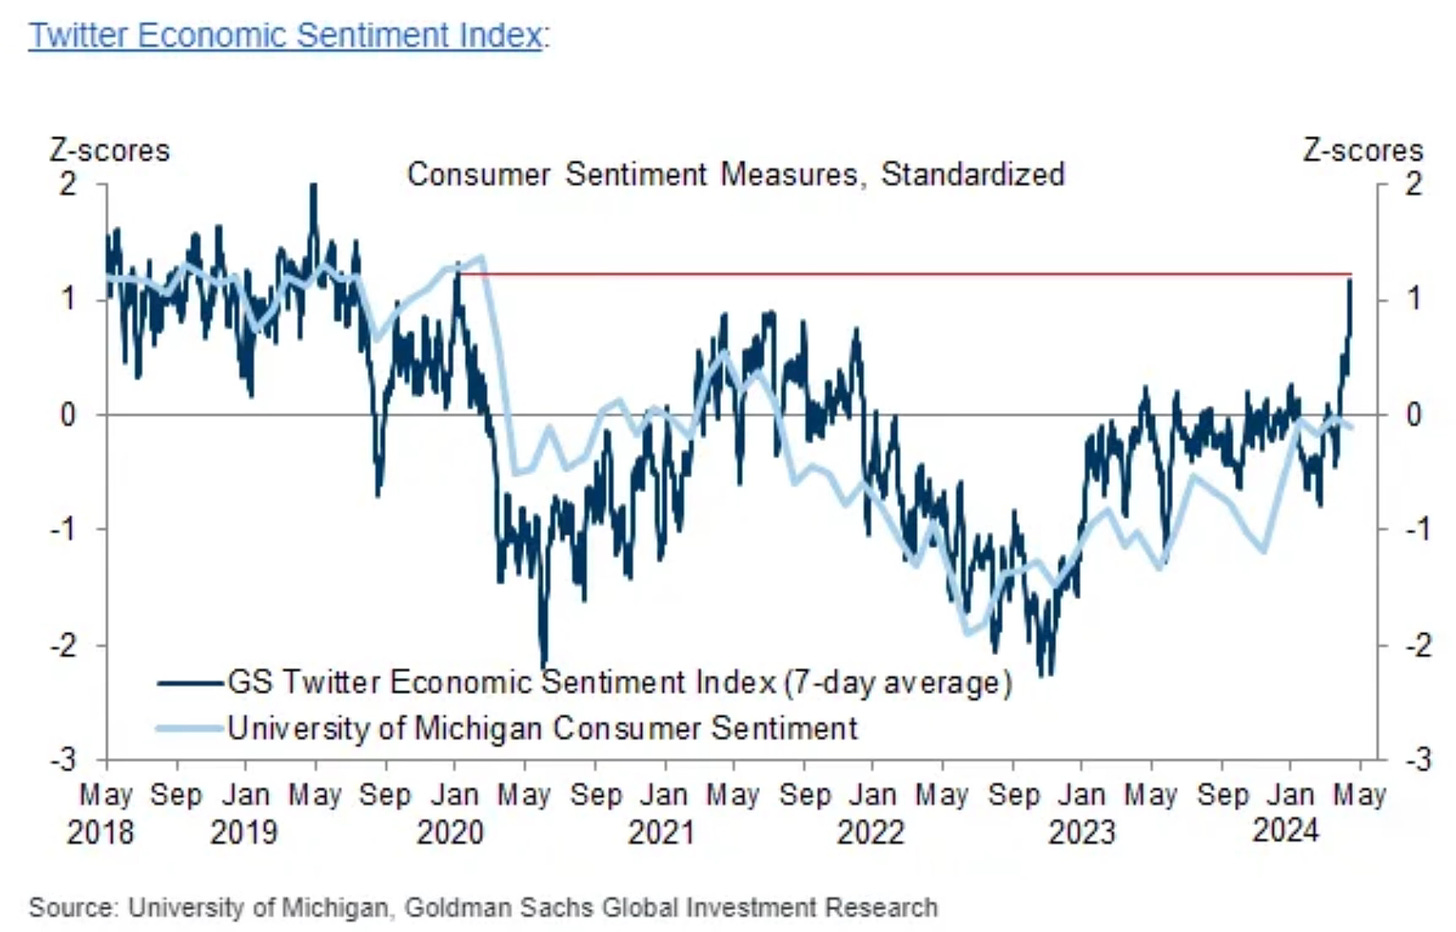
Even with this recent pullback, the economy and stock market still continue to power along. The Twitter Economic Sentiment Index, which I always keep an eye on has continue to improve and it now has hit the highest level since January of 2020.
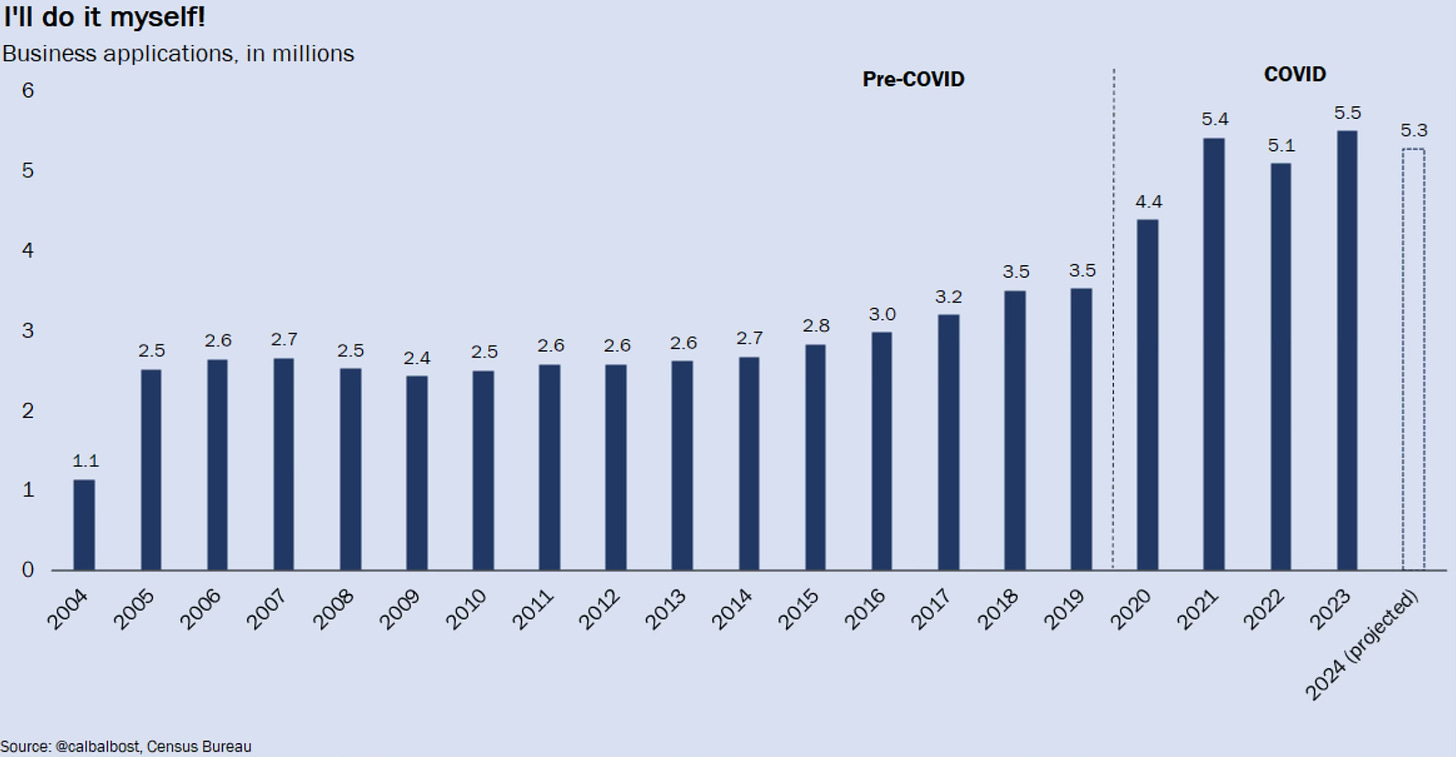
We continue to see Americans starting their own businesses. This was something that I thought was just a COVID phenomenon. I was wrong. People still want to go after the American dream and have their own business. I love to see this continuing!
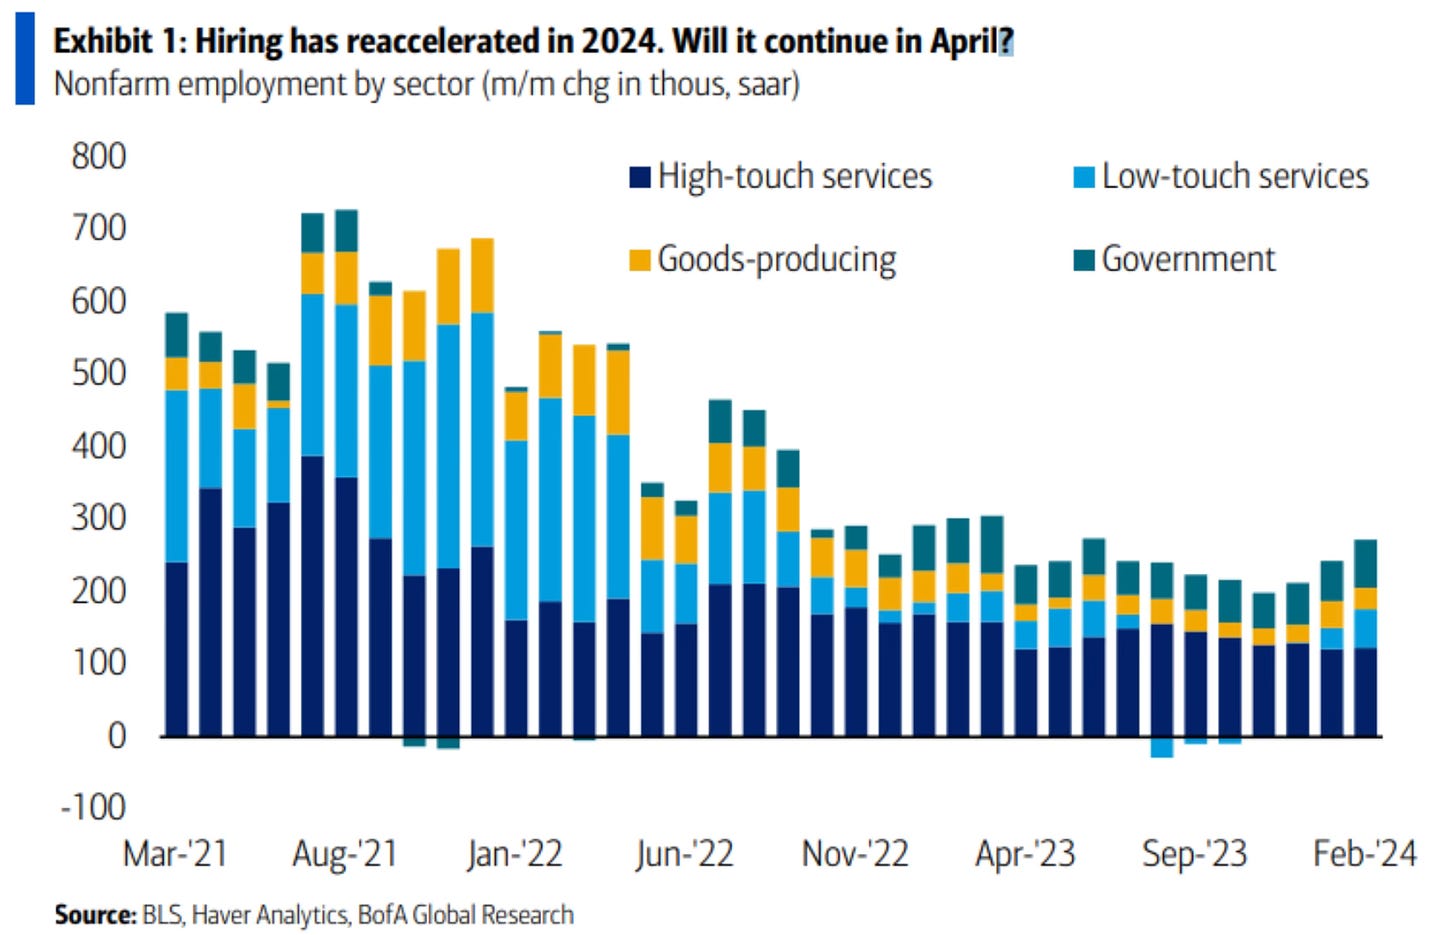
We’ve also seen hiring pick back up. It has ticked higher in all segments of nonfarm employment. Another great thing to see!
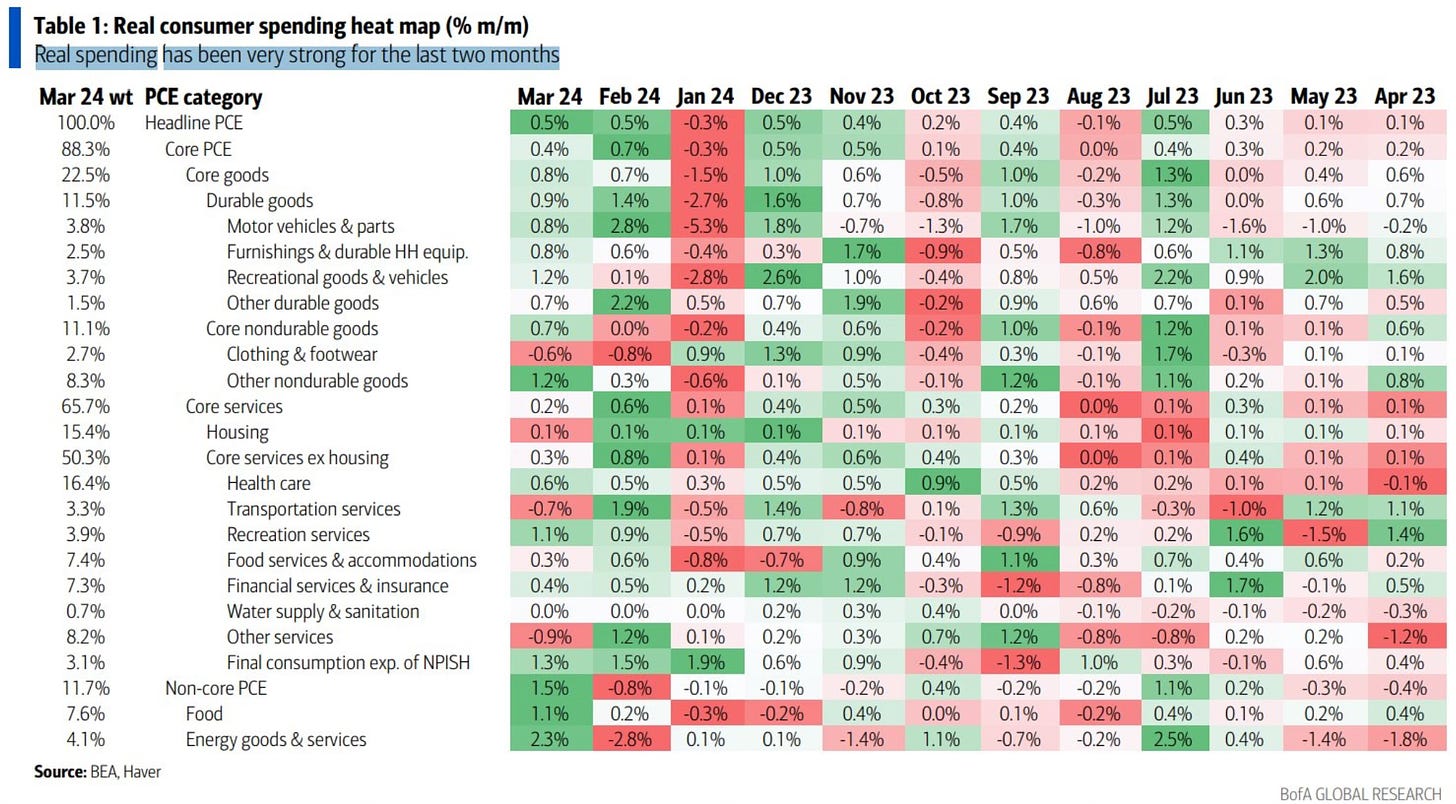
And the consumer just continues to spend. Look at how strong spending has been these last two months. A lot of dark green has replaced dark red.
Negative Date
On the other side of the coin there has been some negative data. Here is some negative data that I feel is worth mentioning.
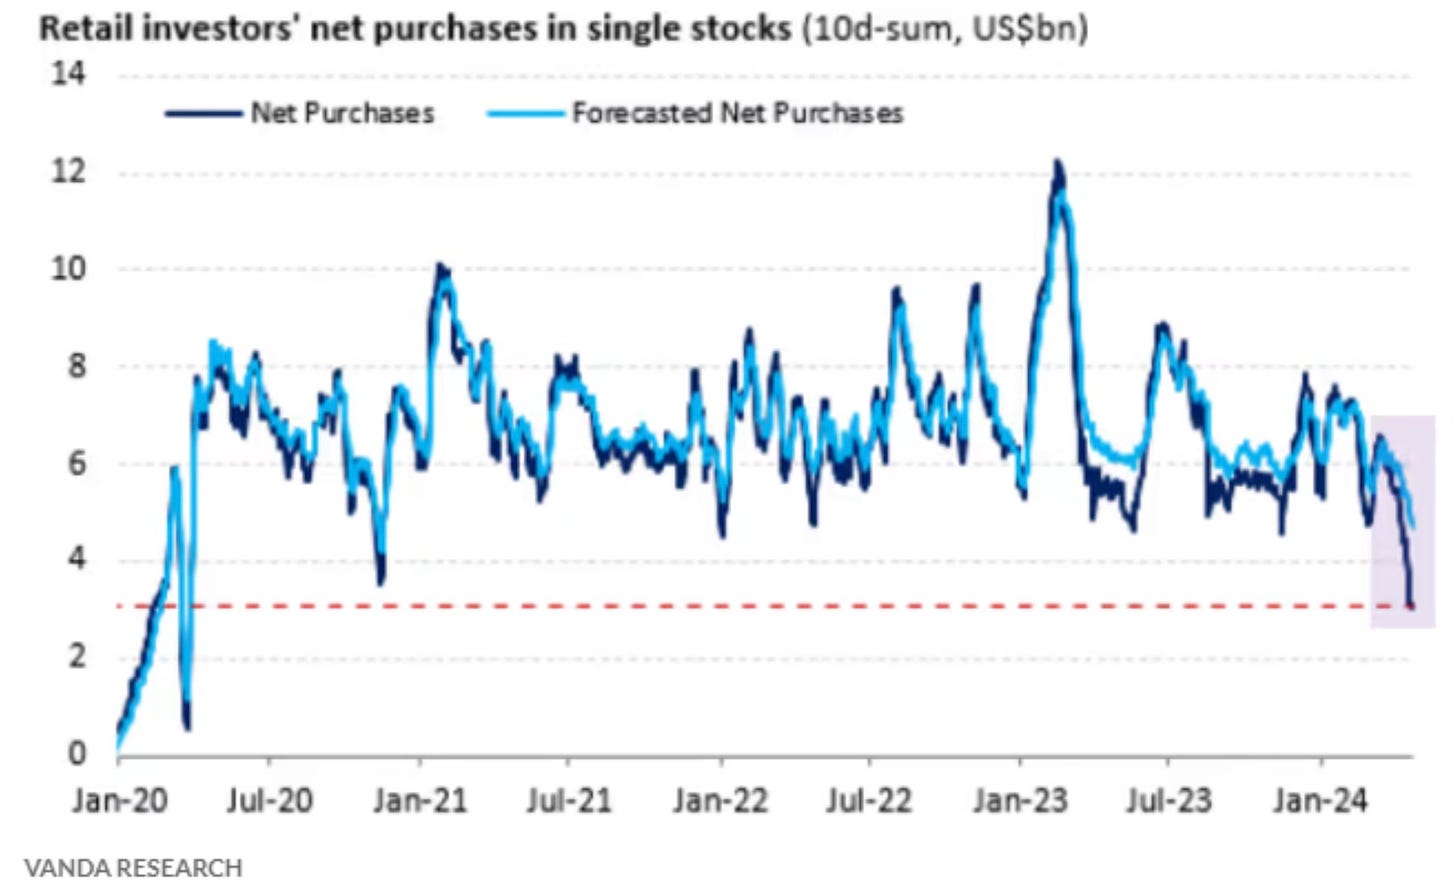
Retail investors are the most pessimistic about stocks since November.

This view holds true in what they’re doing and not only what they’re saying. The stock purchasing by individual investors is at the lowest level dating back to late 2020.
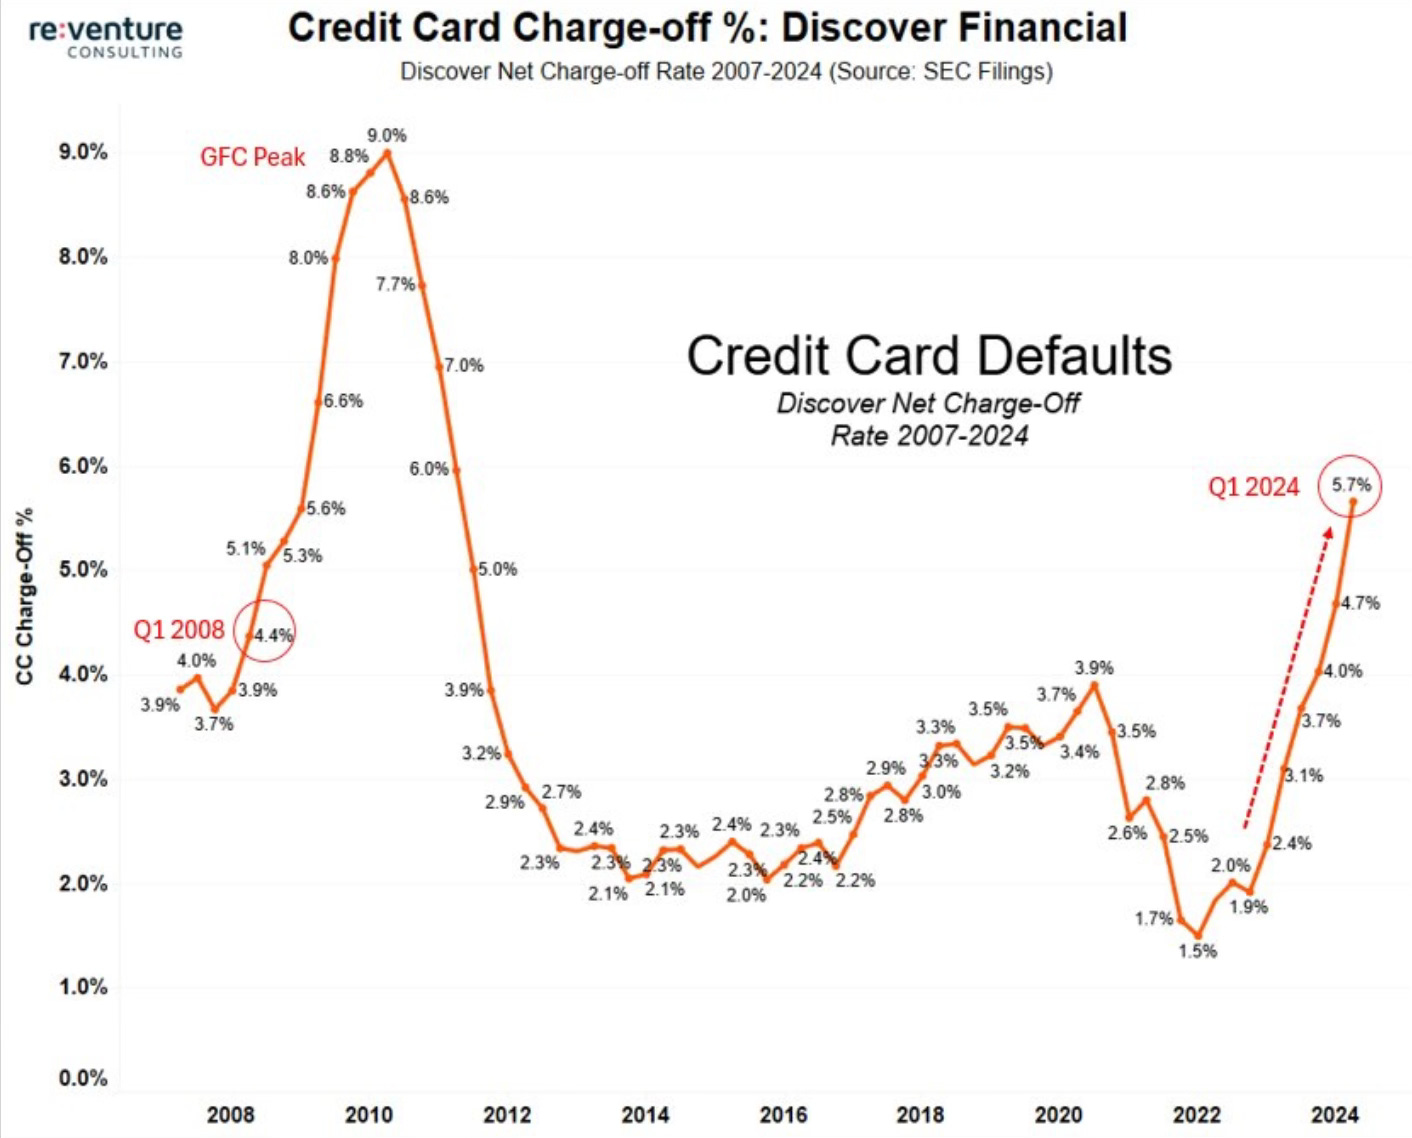
Discover Financial which is the 6th largest credit card company in the US, shared some interesting data. Their credit card delinquencies have now risen to the 2008 levels. That isn’t a period we want to be comparing economic or stock market data against.
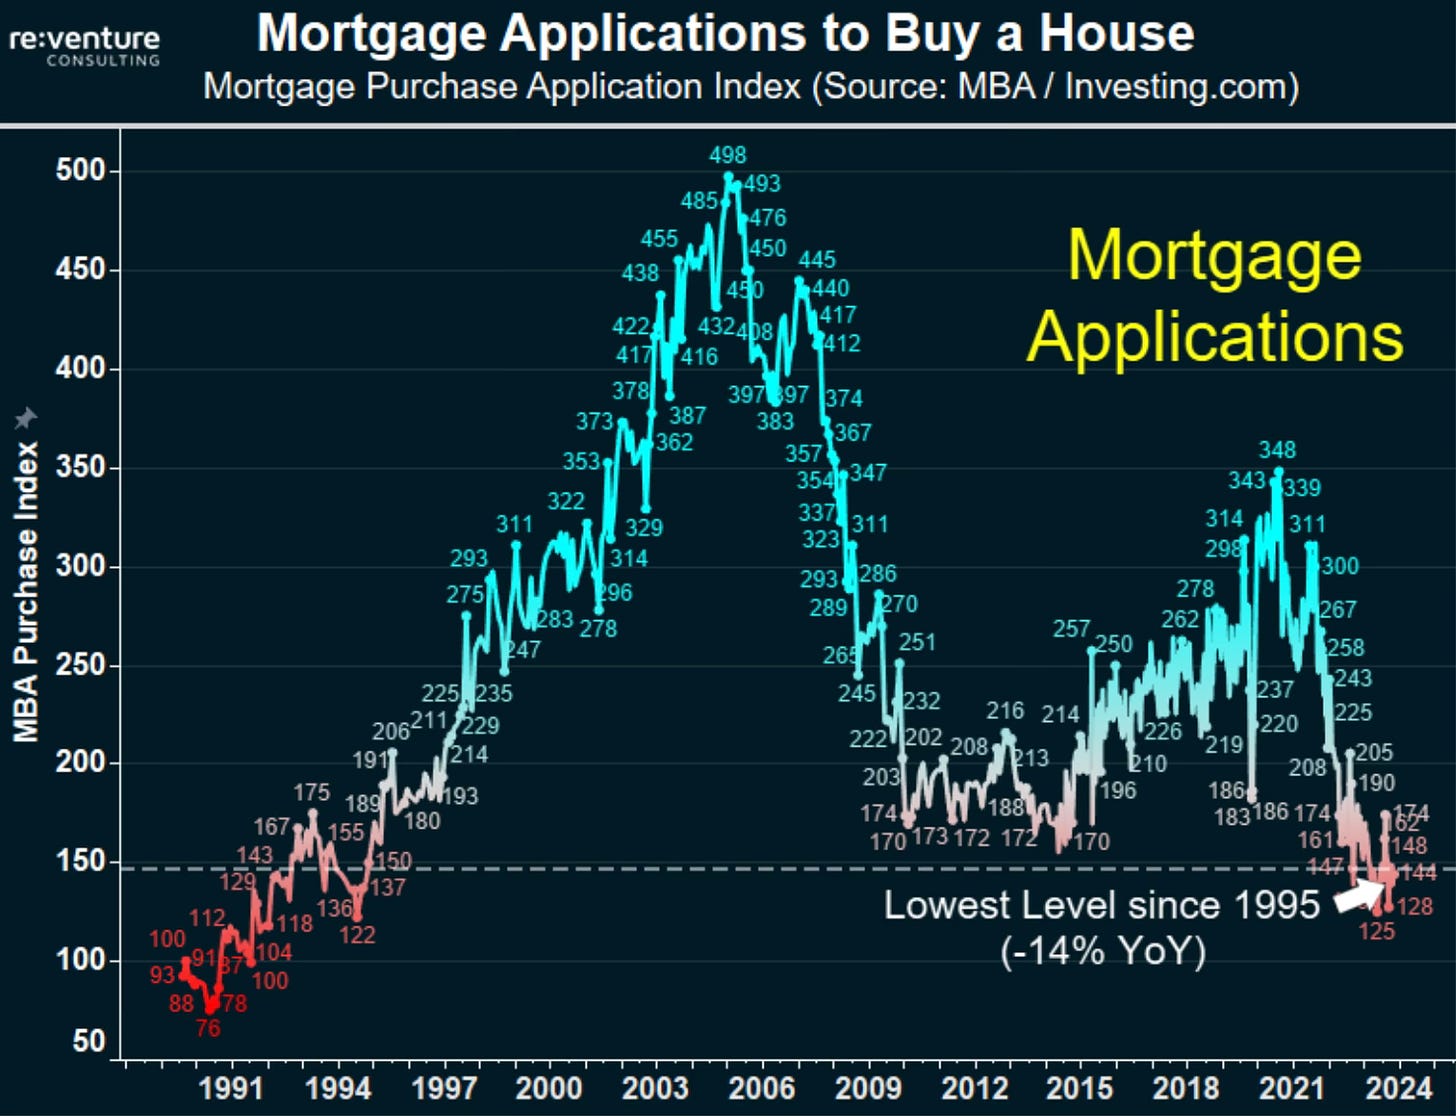
I’ll finish with my chart that most caught my attention this week. We may now be starting to see some signs of cracking within housing. Mortgage application have been falling and now sit at the lowest level since 1995. Higher mortgage rates and all-time high affordability may be taking shape now.
Positive or negative data can always easily be skewed in one direction or another. If you only want to focus on positive points you can do that. If you only want to find negative data and believe only that, you can do that also. The important part is that you take a look at both sides of the data. It’s the only way you get the clearest and most objective picture.
Moves I’ve Made
S&P 500 Index This week I added to my S&P 500 index position.
Upcoming Earnings & Data
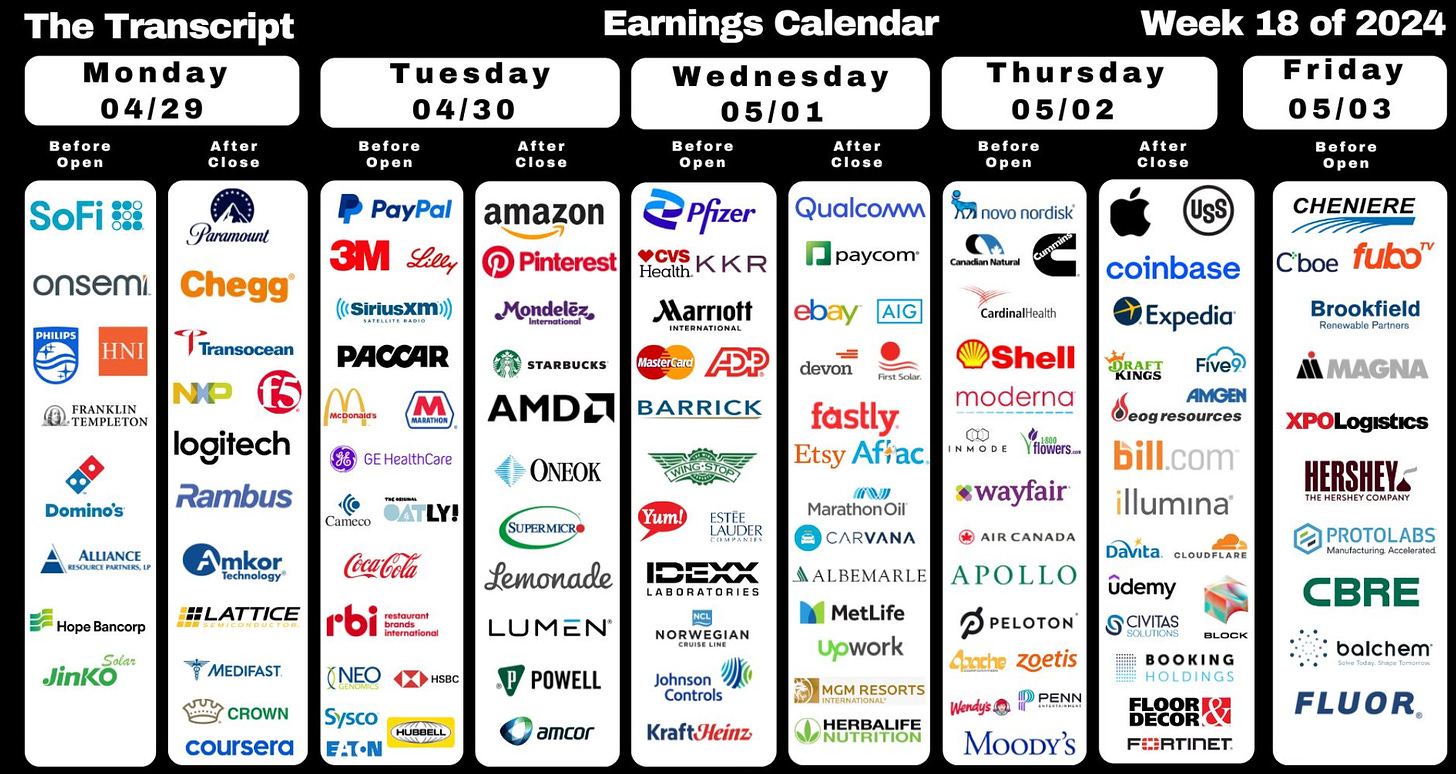
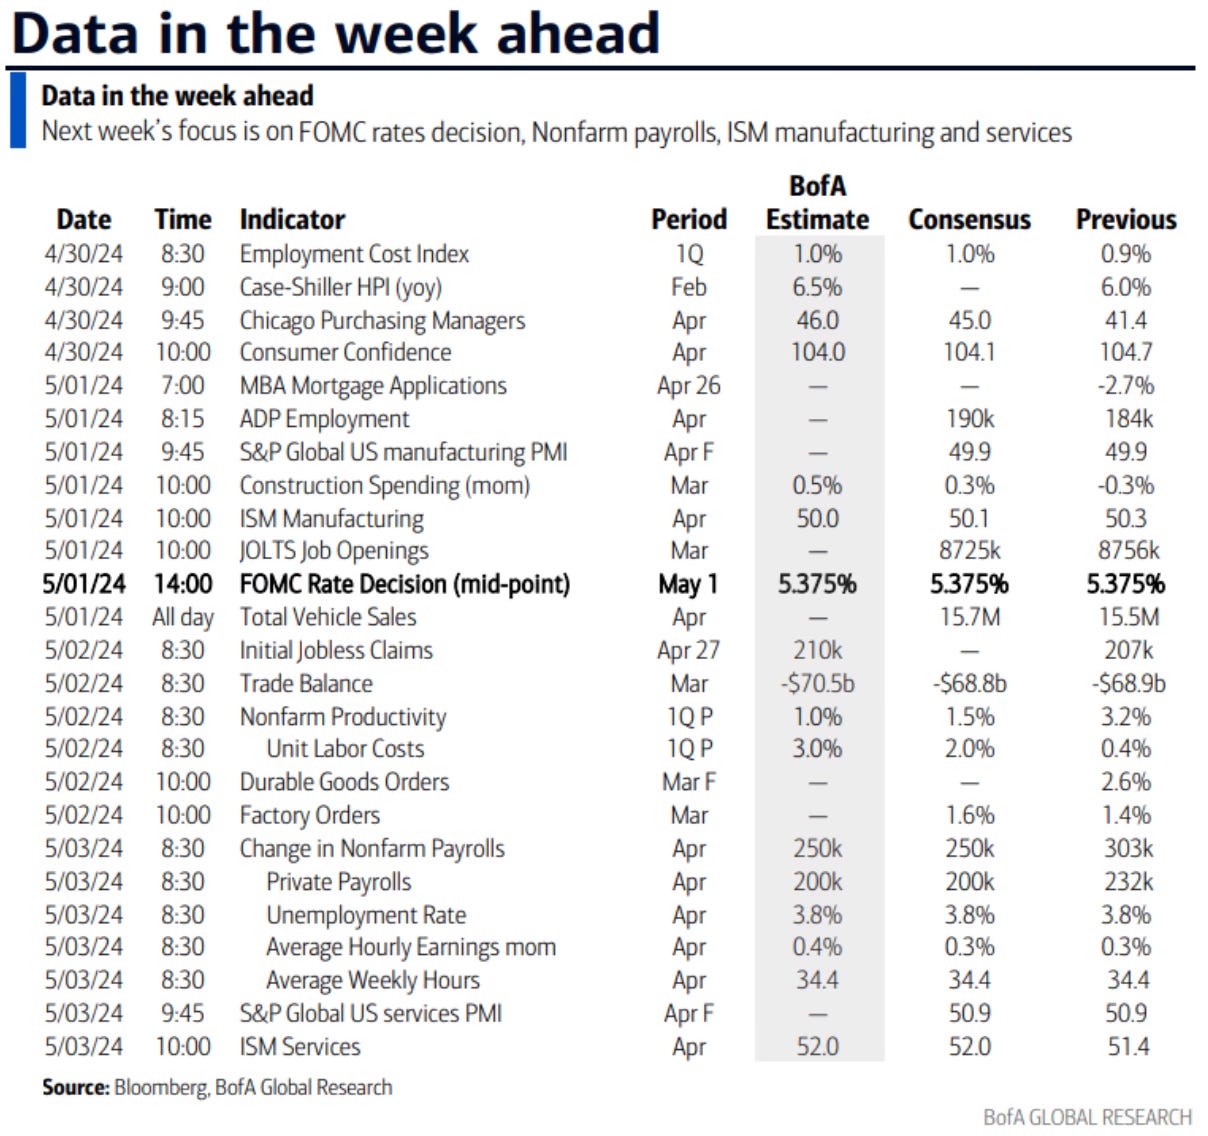
Another big week of earnings is upcoming. Led by Apple and Amazon, 175 S&P 500 companies are reporting.
The Coffee Table ☕
I found this post by Michelle Singletary to be quite helpful. Keep these 10 financial documents forever. Scan and shred the rest. As paperwork continues to buildup it’s nice to know what we should keep and what we can toss.
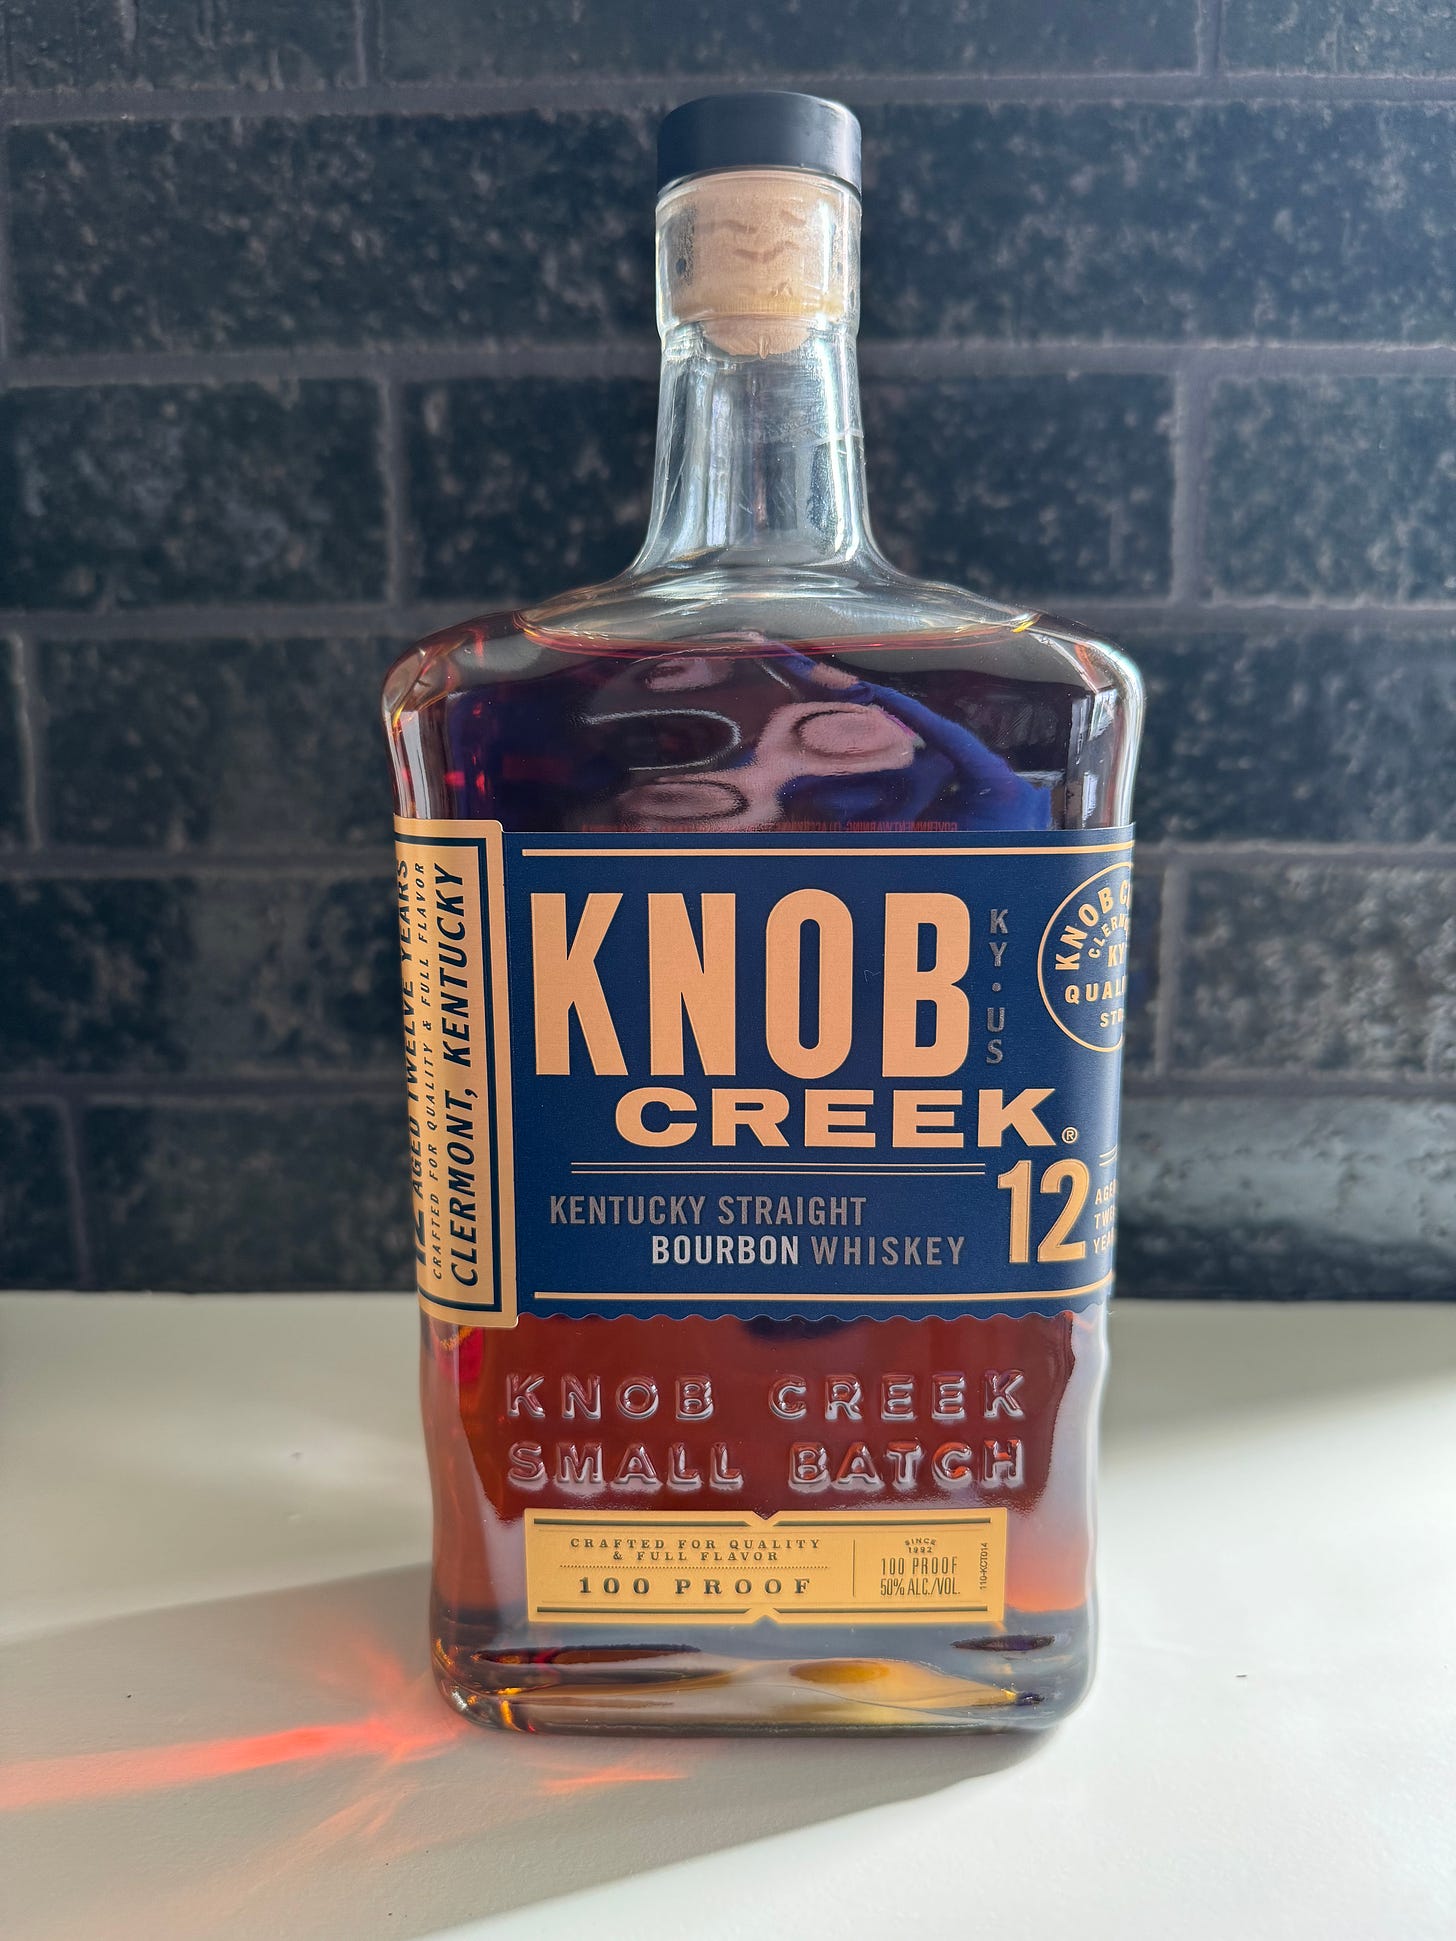
A couple weeks ago I came across a bottle of Knob Creek 12 Year. I had heard really good things about it. To the nose it smelled really rich and creamy. At first taste it came across with a lot of berry and raisin but then turned really oaky. It finished with a heavy oak along with a bit of burn. I’m not a big fan of oak so I wasn’t the biggest fan of this. If you like oaky this may be more your pour.
Thank you for reading! If you enjoyed Spilled Coffee, please subscribe.
Spilled Coffee grows through word of mouth. Please consider sharing this post with someone who might appreciate it.
Order my book, Two-Way Street below.


