Investing Update: Time To Buy Or Wait?
What I'm buying, selling & watching
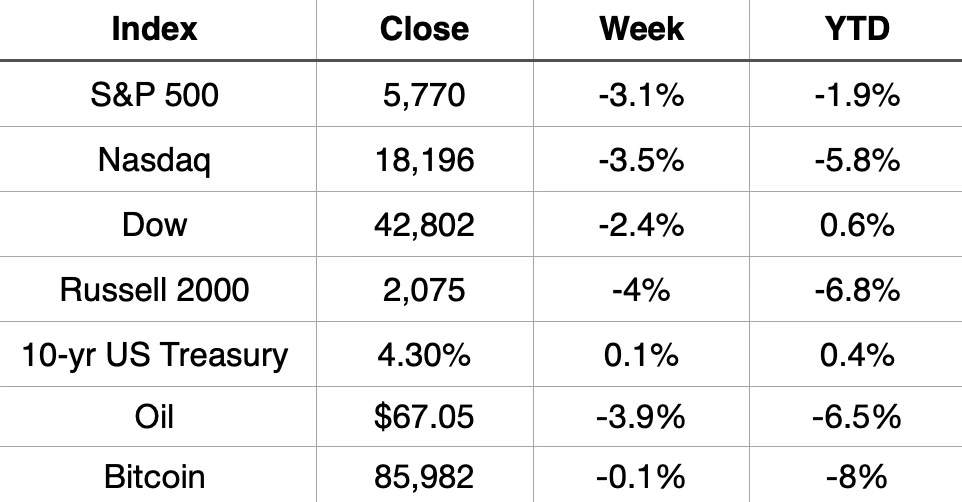
Well that was a good week to get over with. Thursday was the worst day of the year for the stock market. The S&P 500 had its worst week since September, down 3.1%. The Nasdaq fell 3.5% and the Dow fell 2.4%.
Market Recap
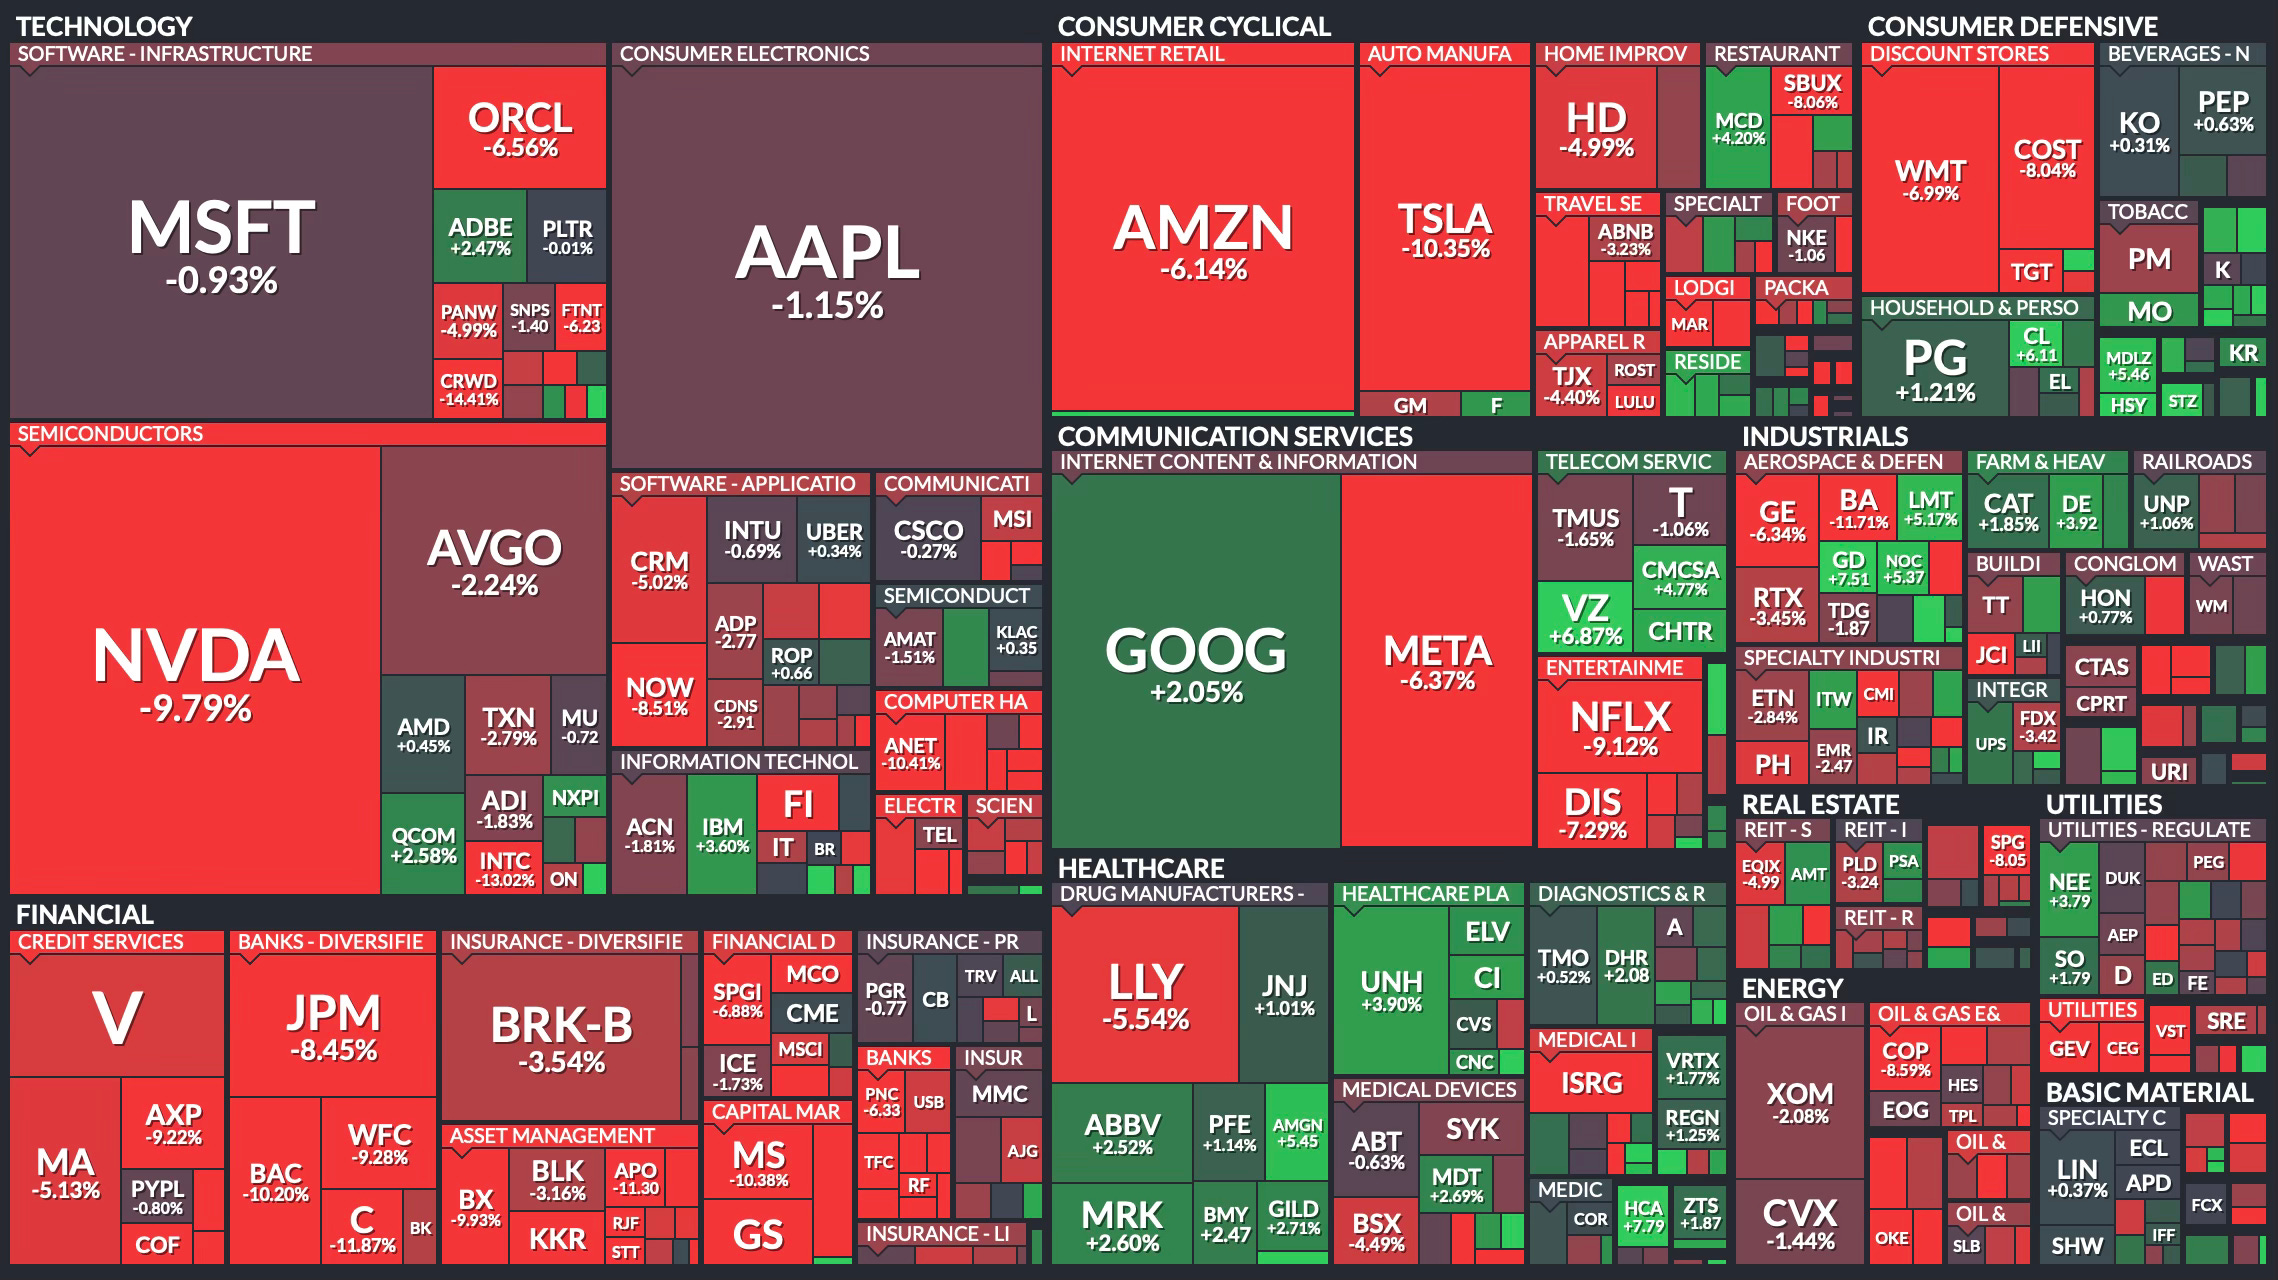
Weekly Heat Map Of Stocks
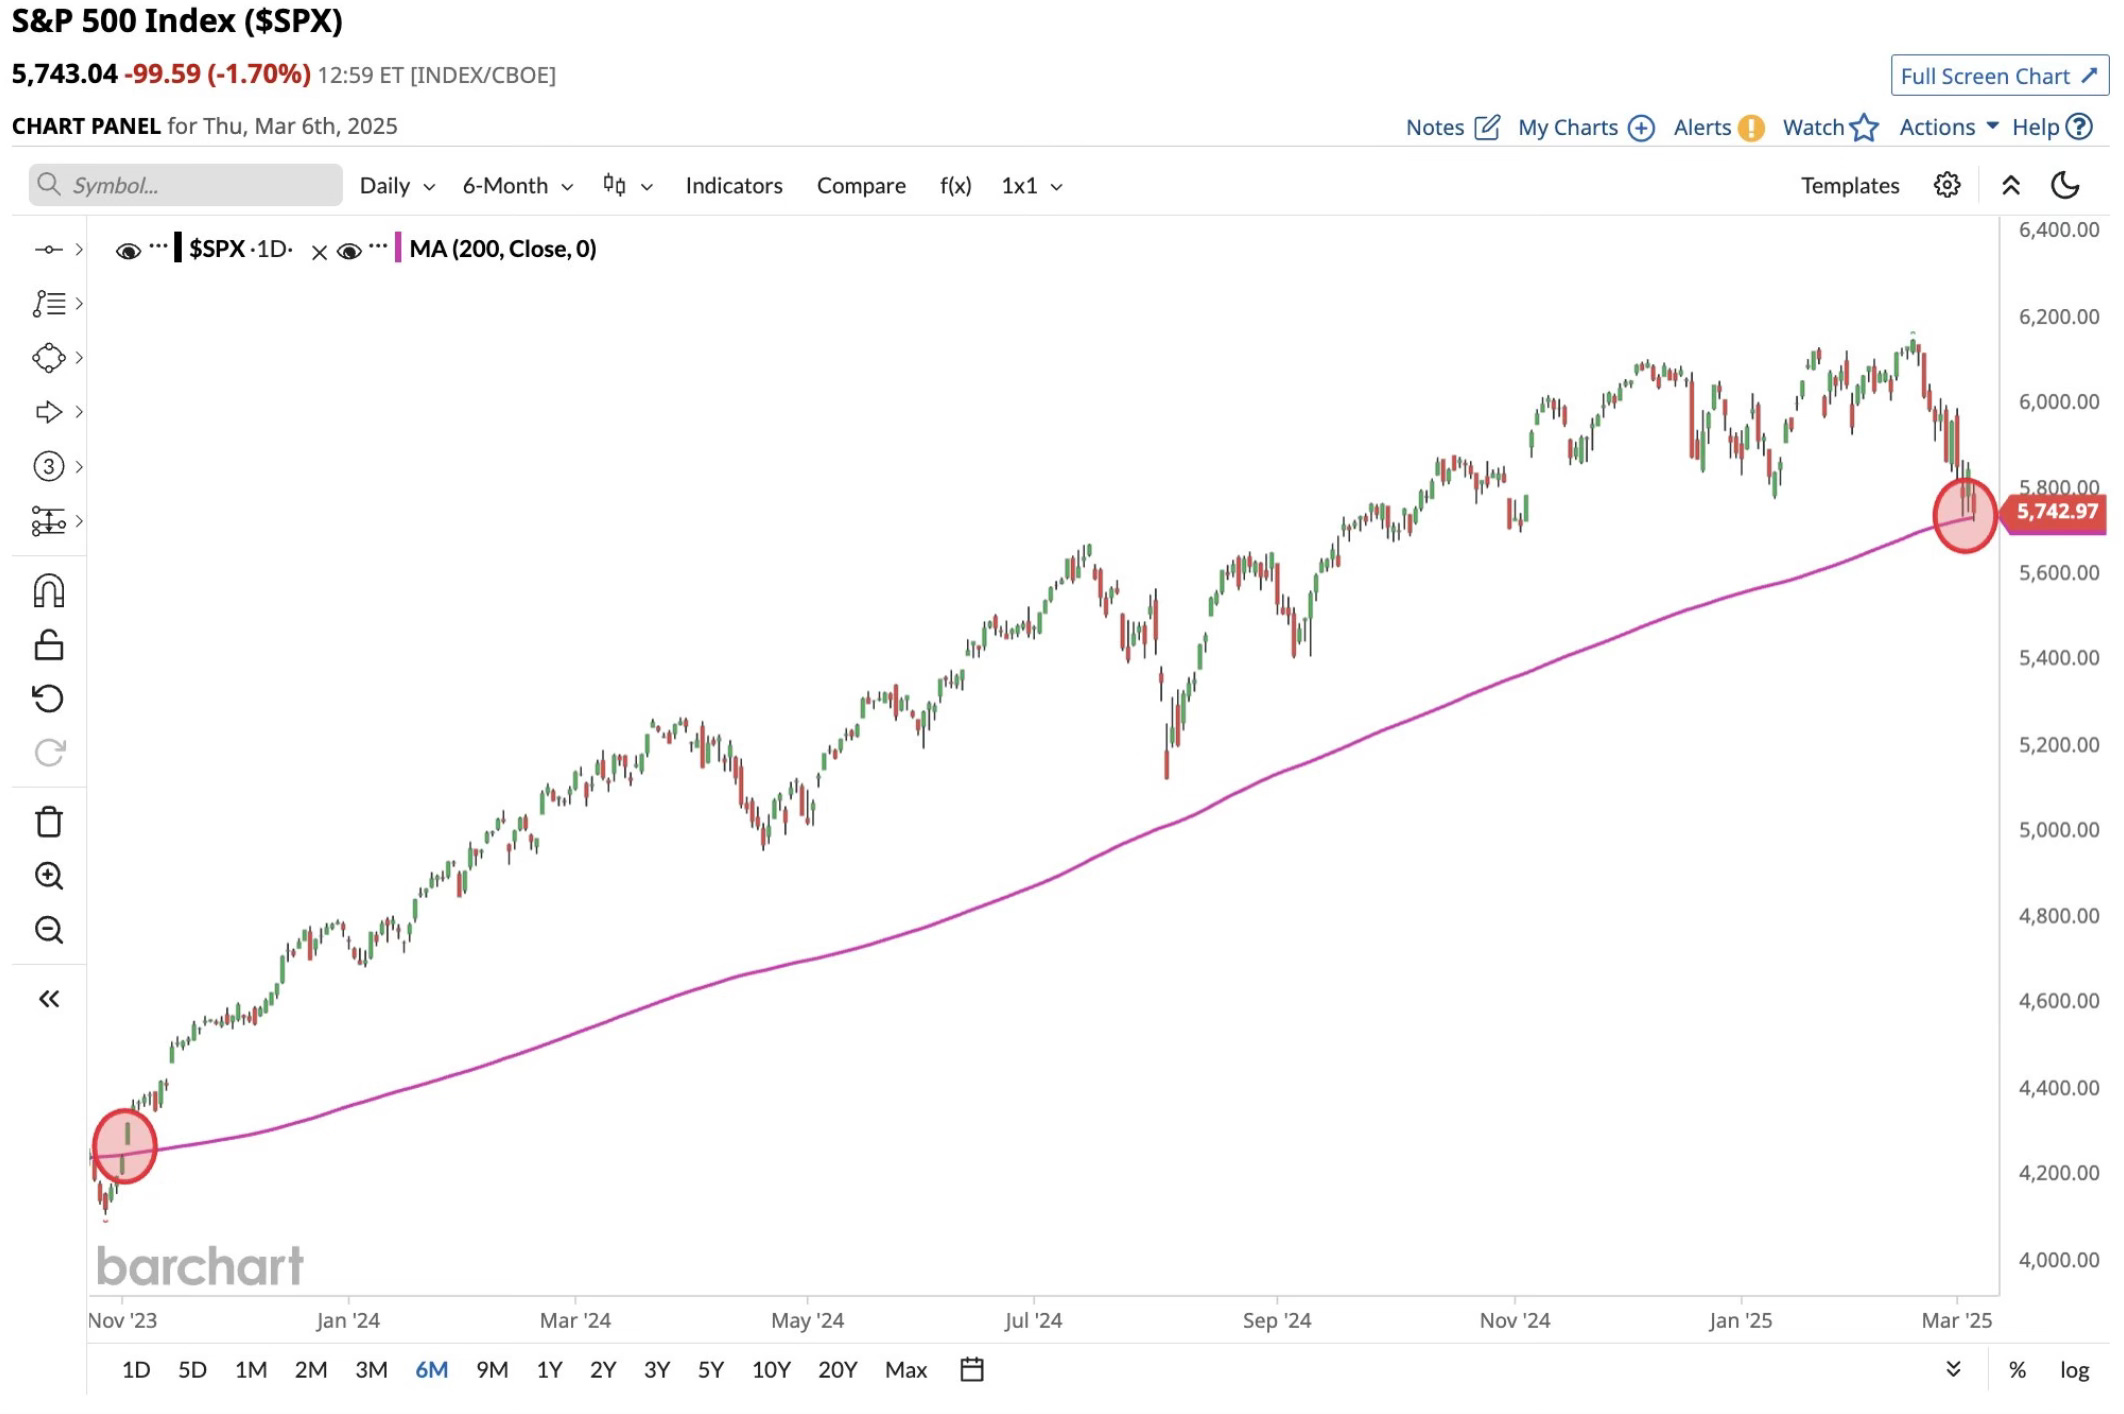
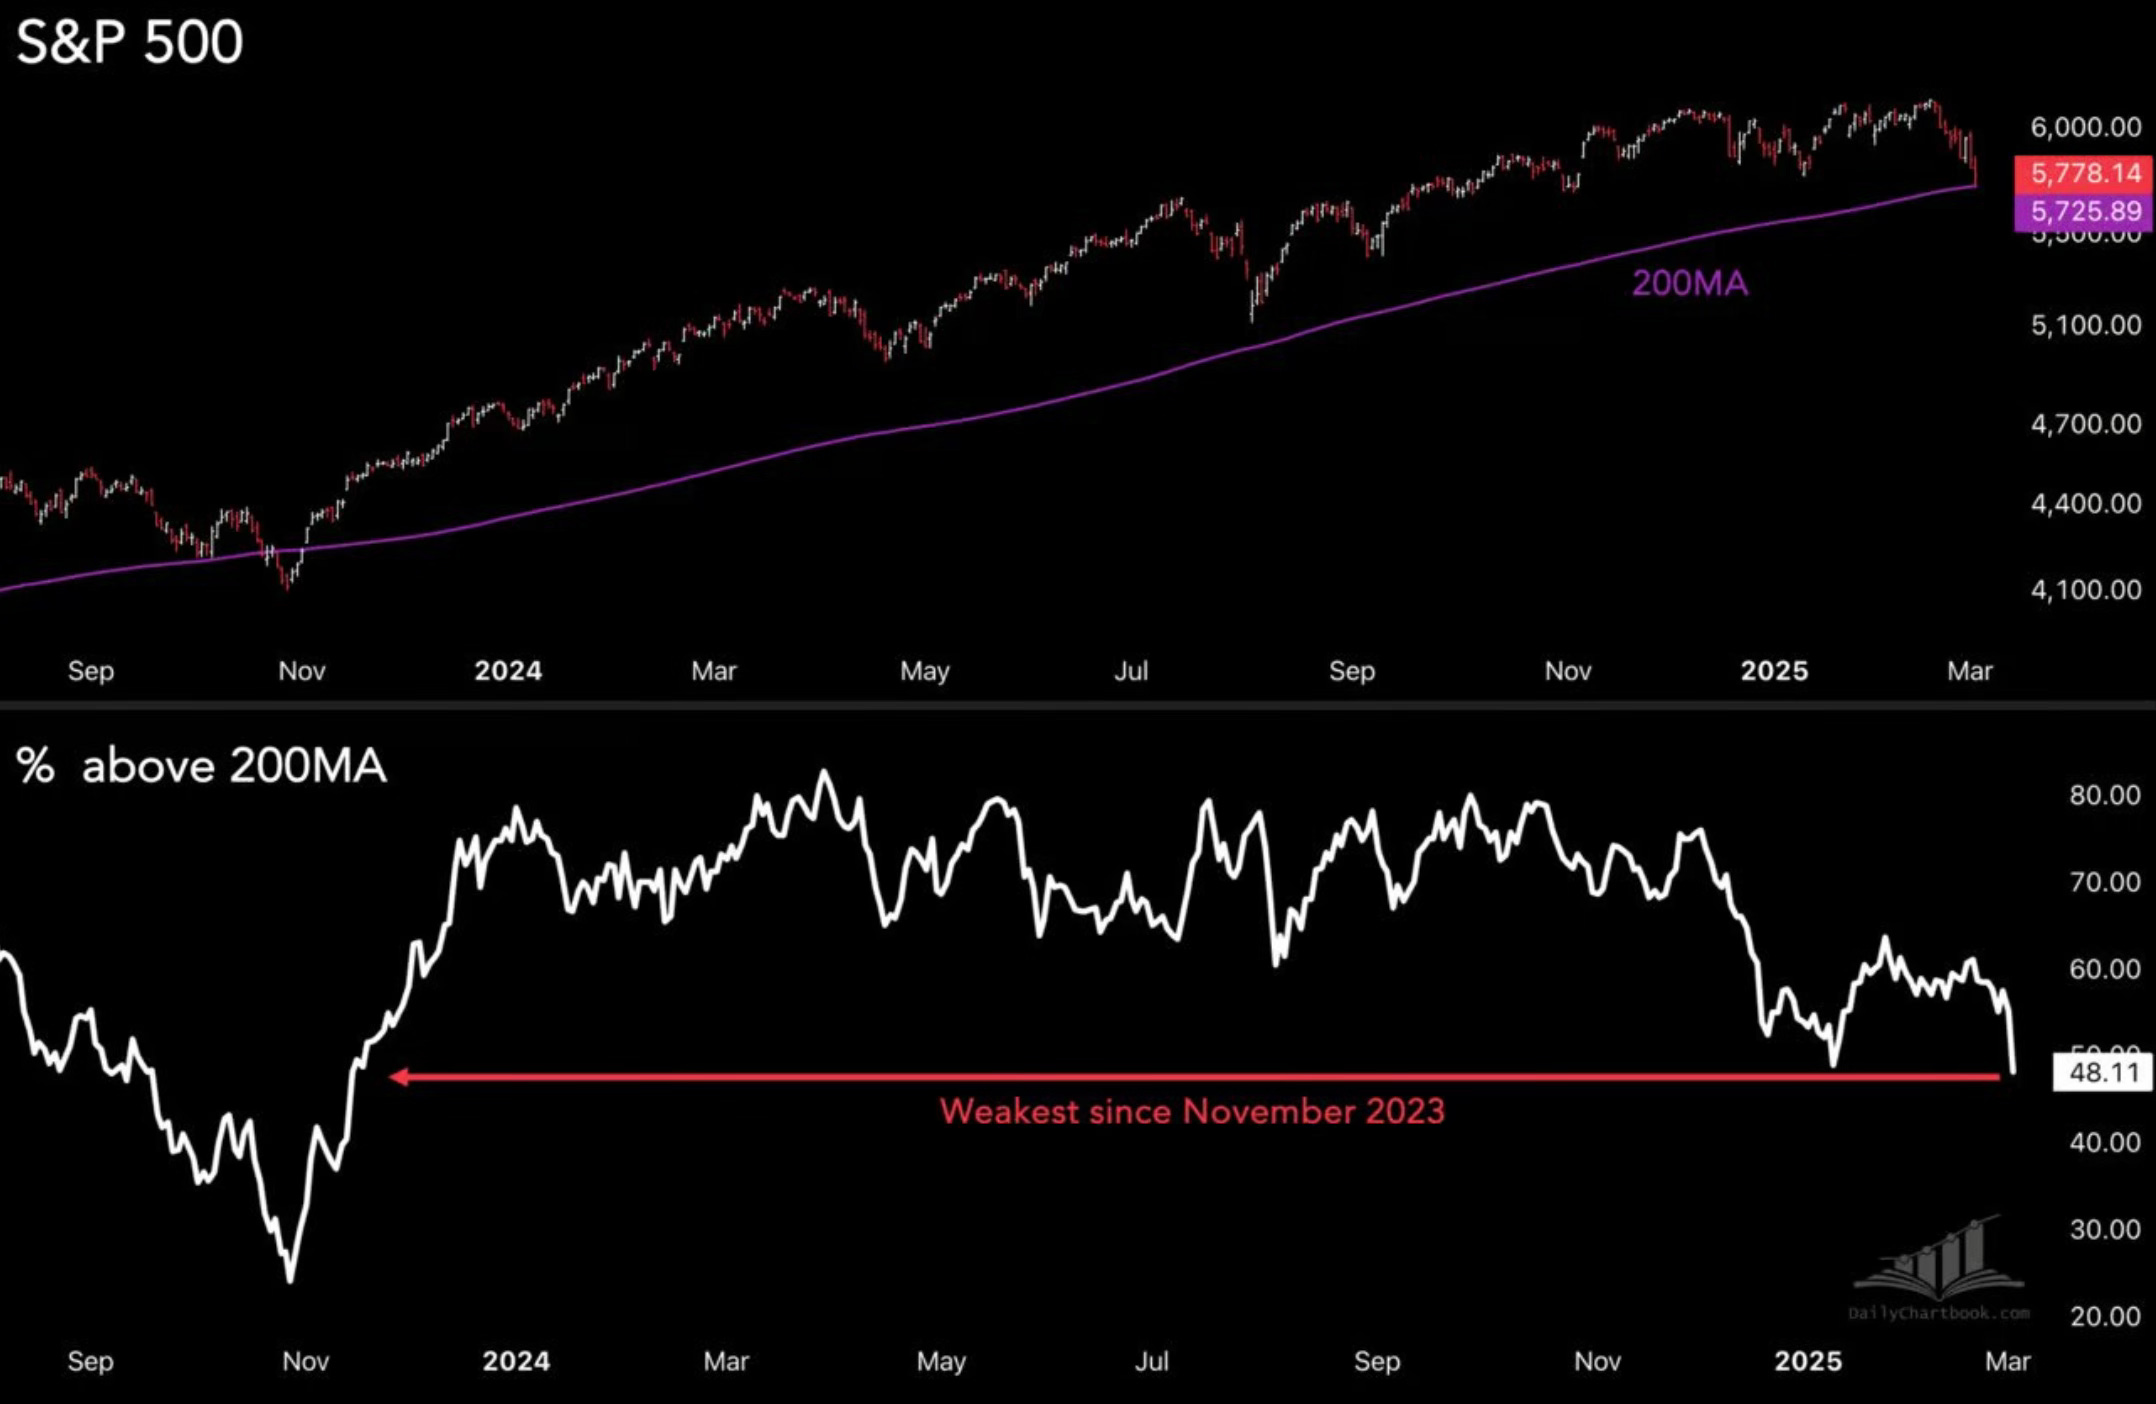
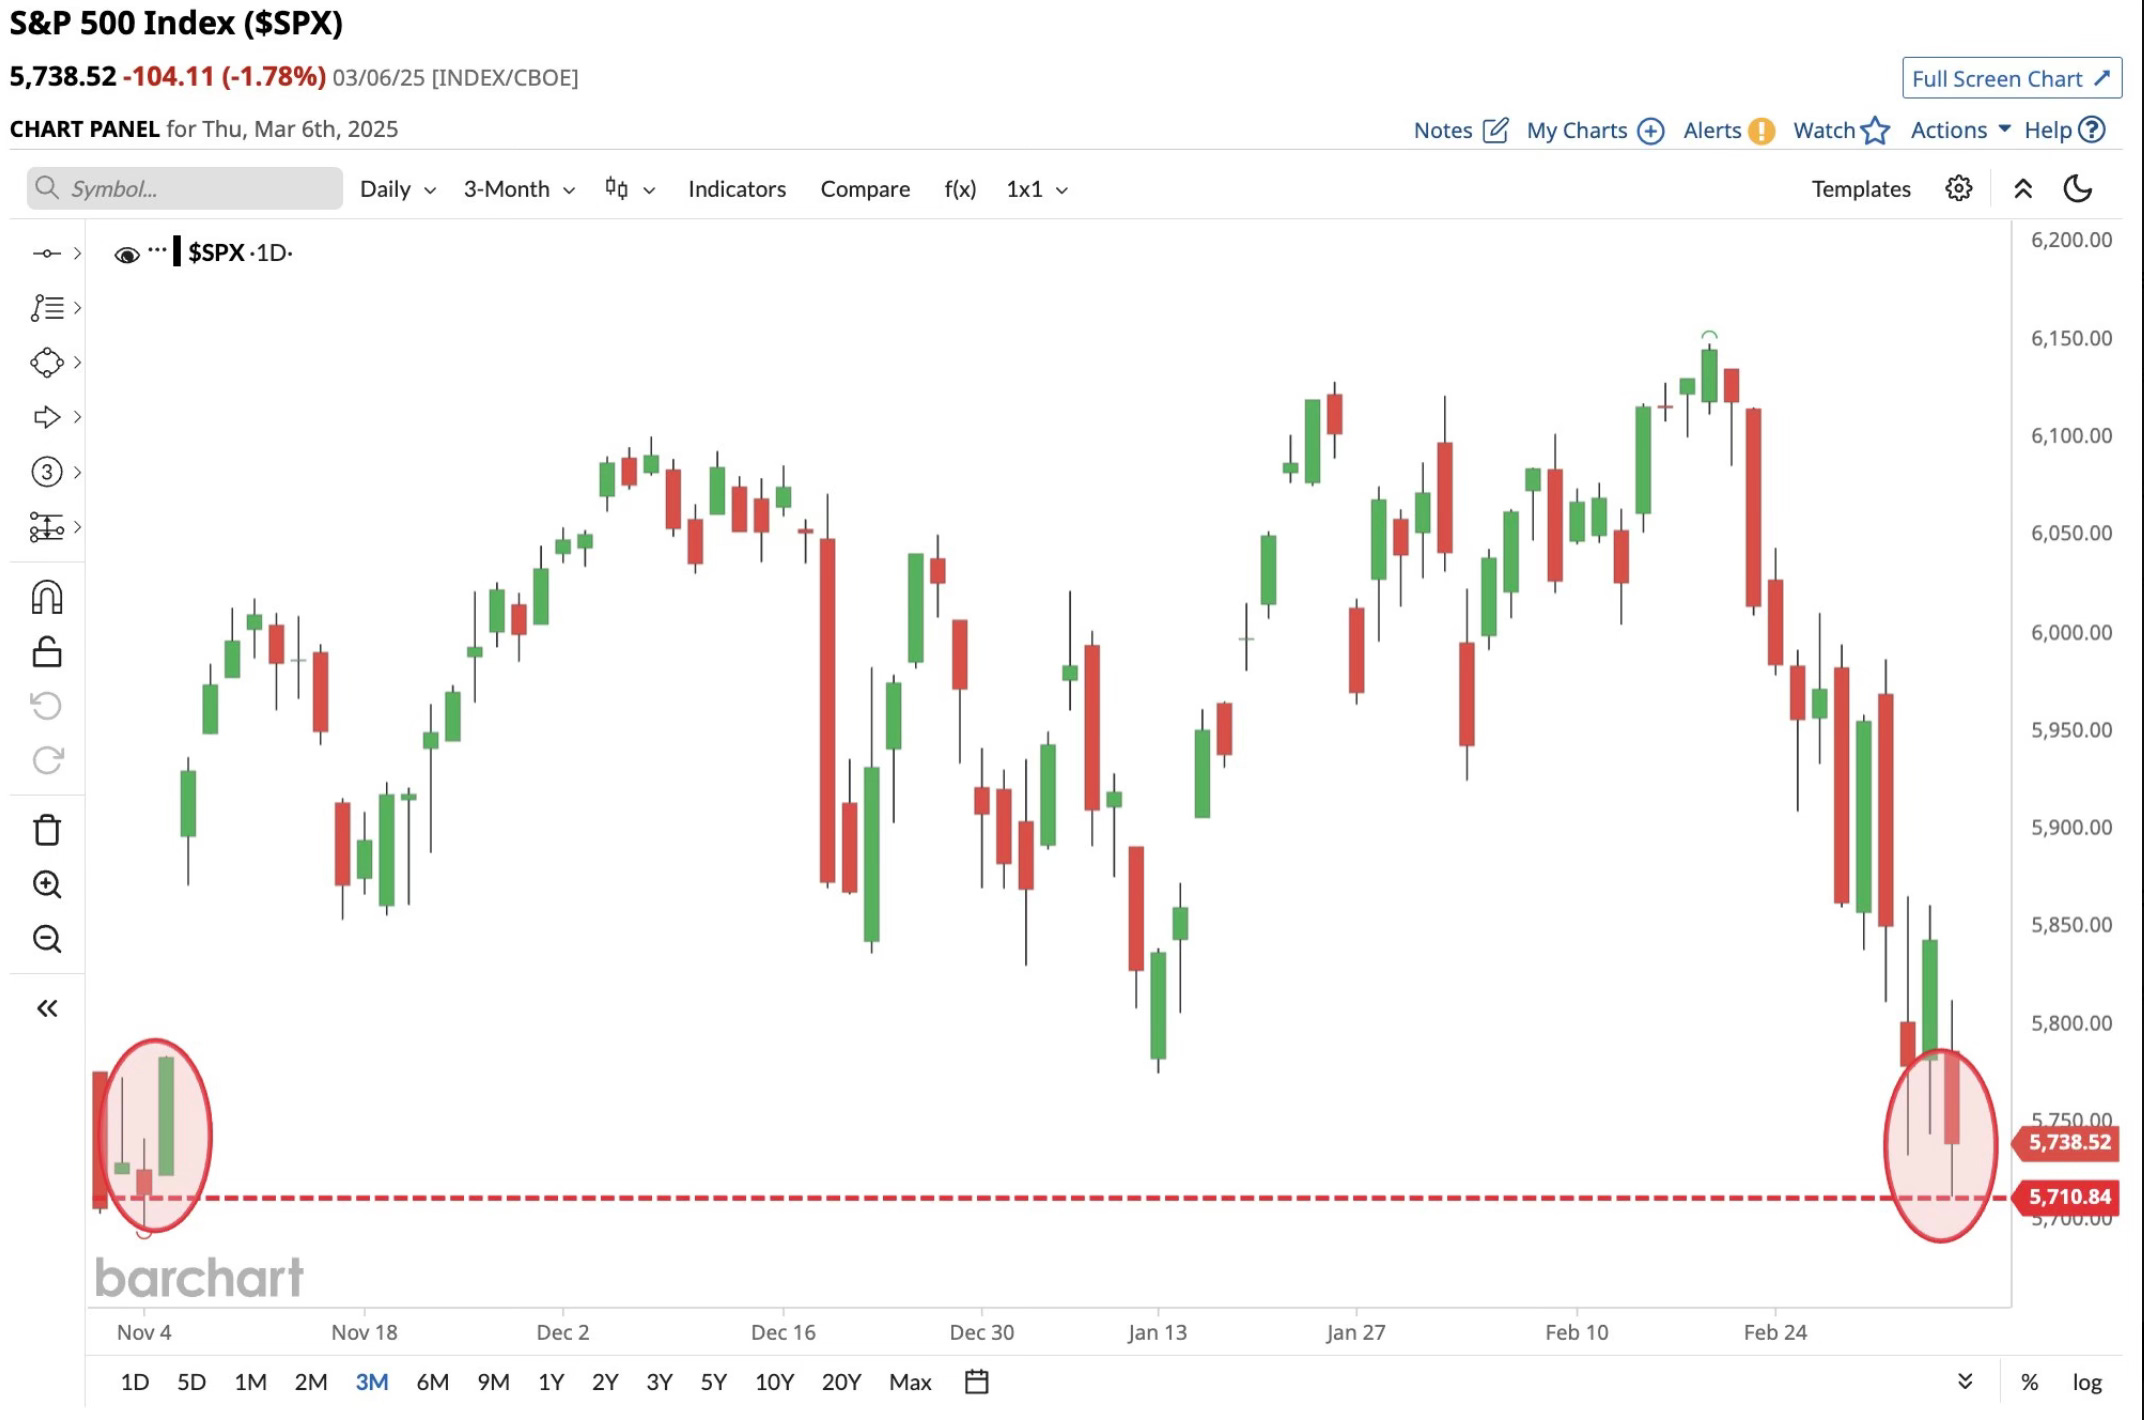
The S&P 500 fell below the 200-day for the first time since November. A 4 month low.
The percentage of S&P 500 stocks trading above their 200-day fell to lowest level since November 2023.
All the gains since the election have been wiped out. Just like that they’re gone.
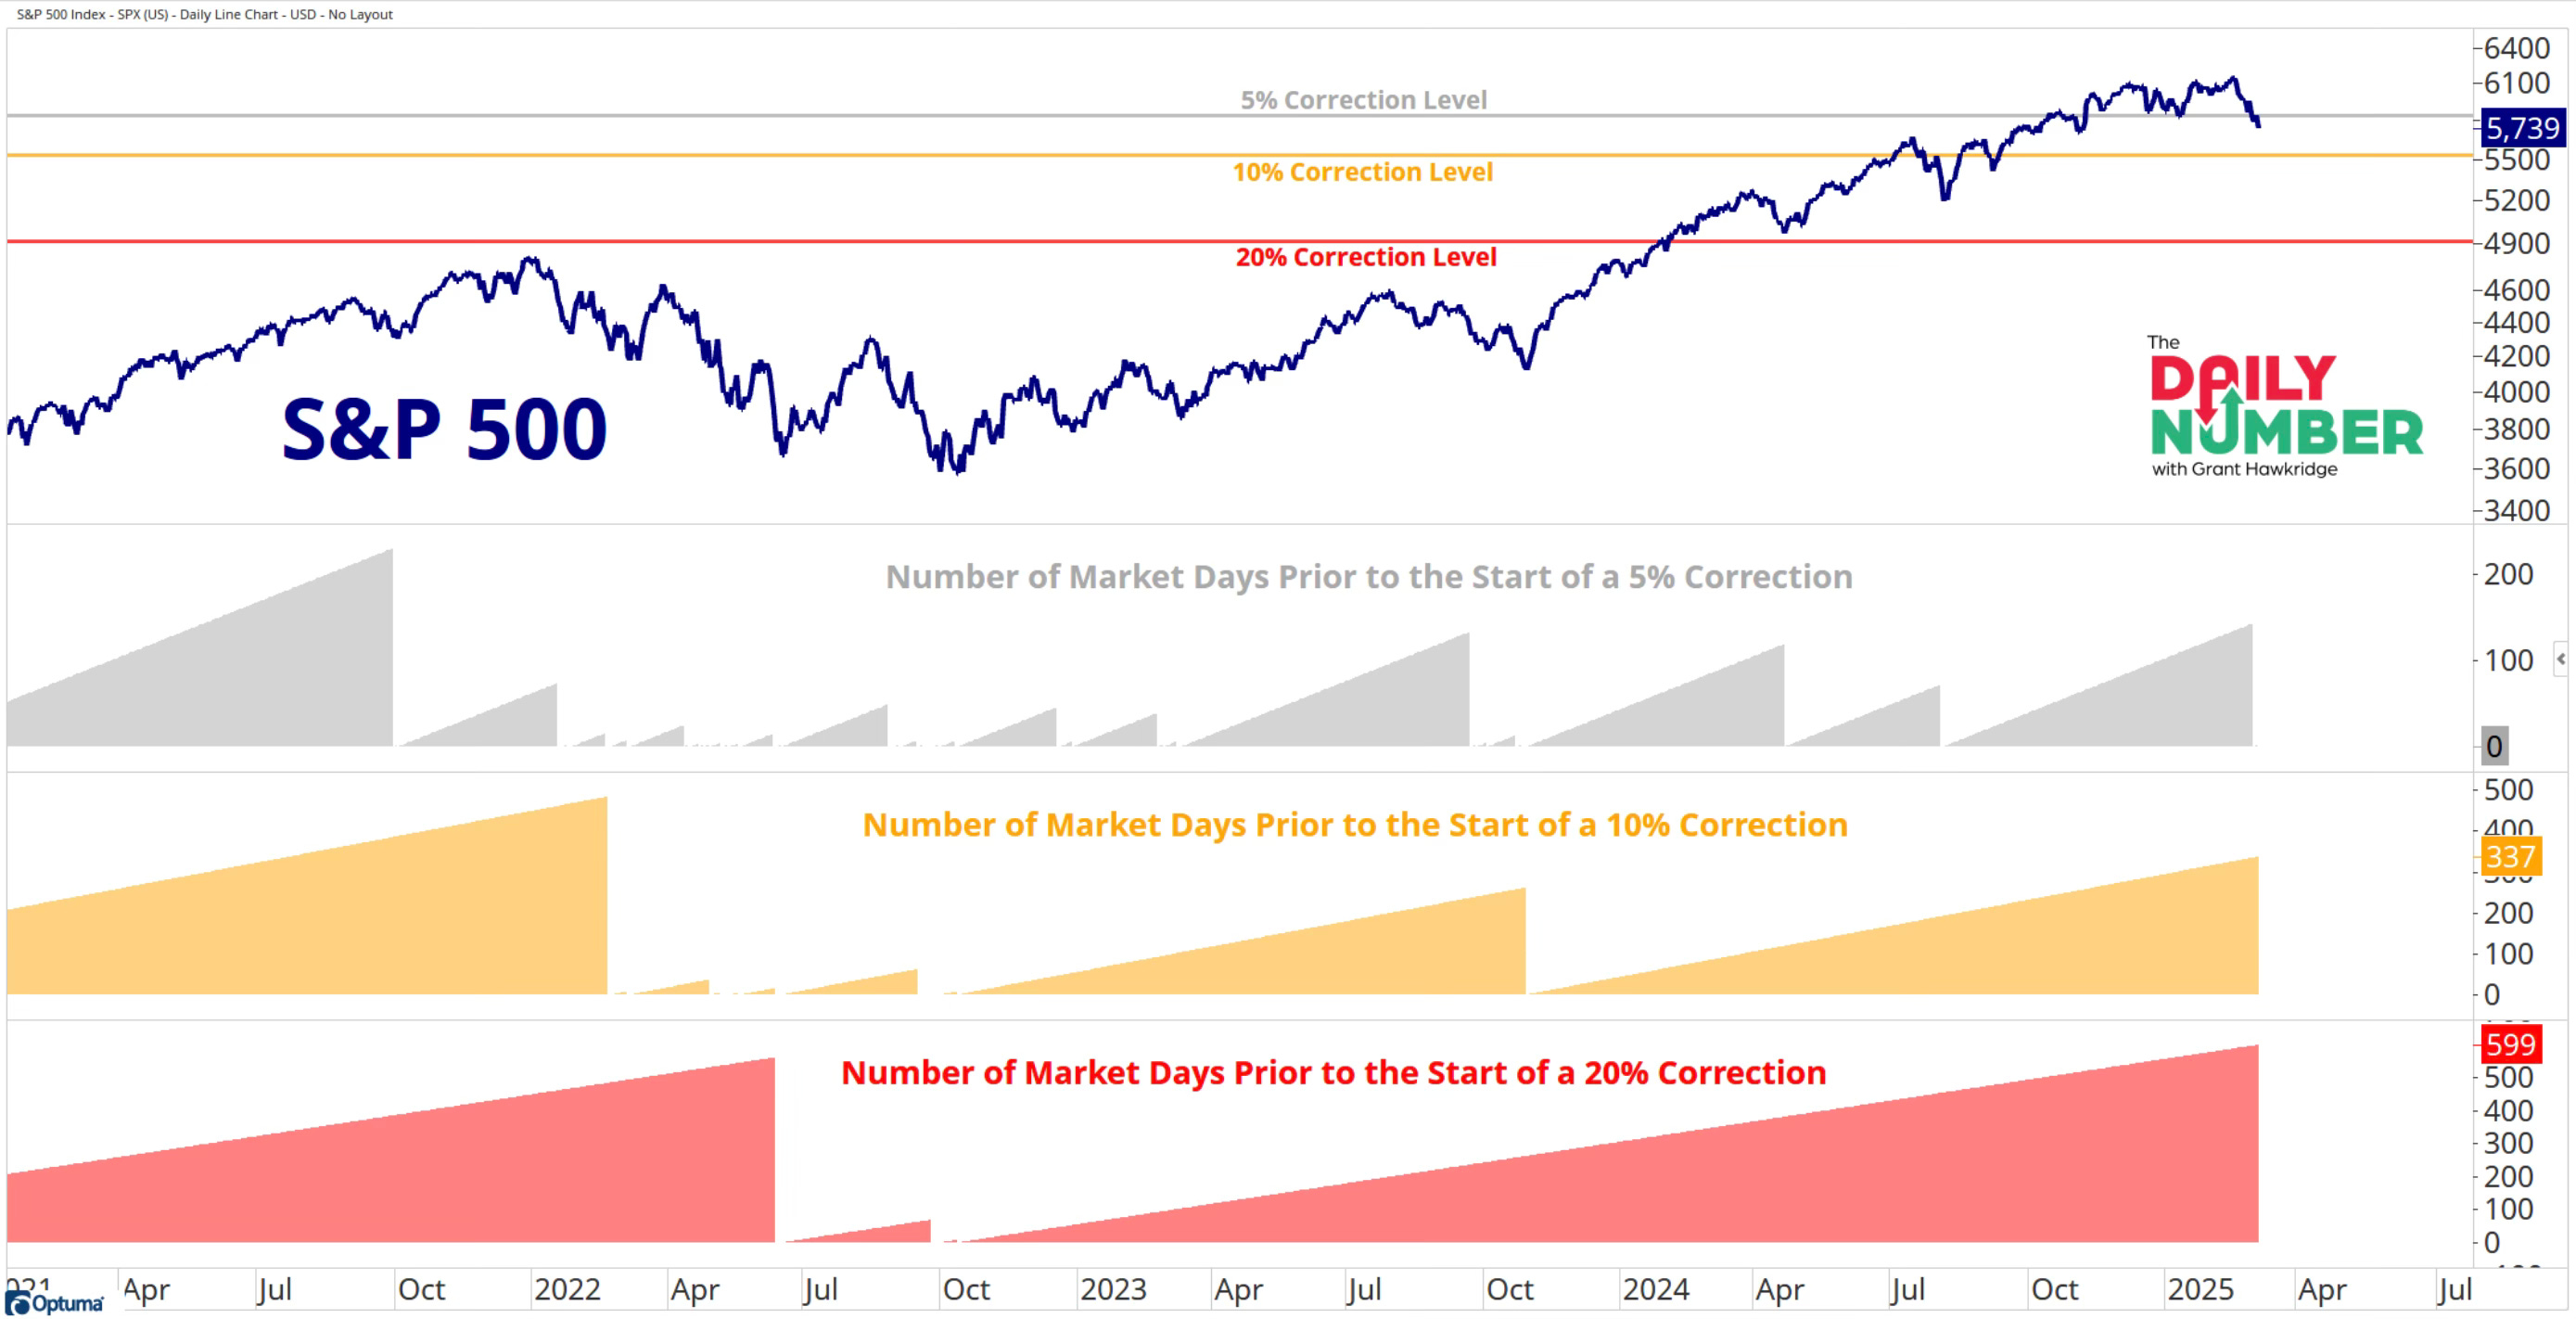
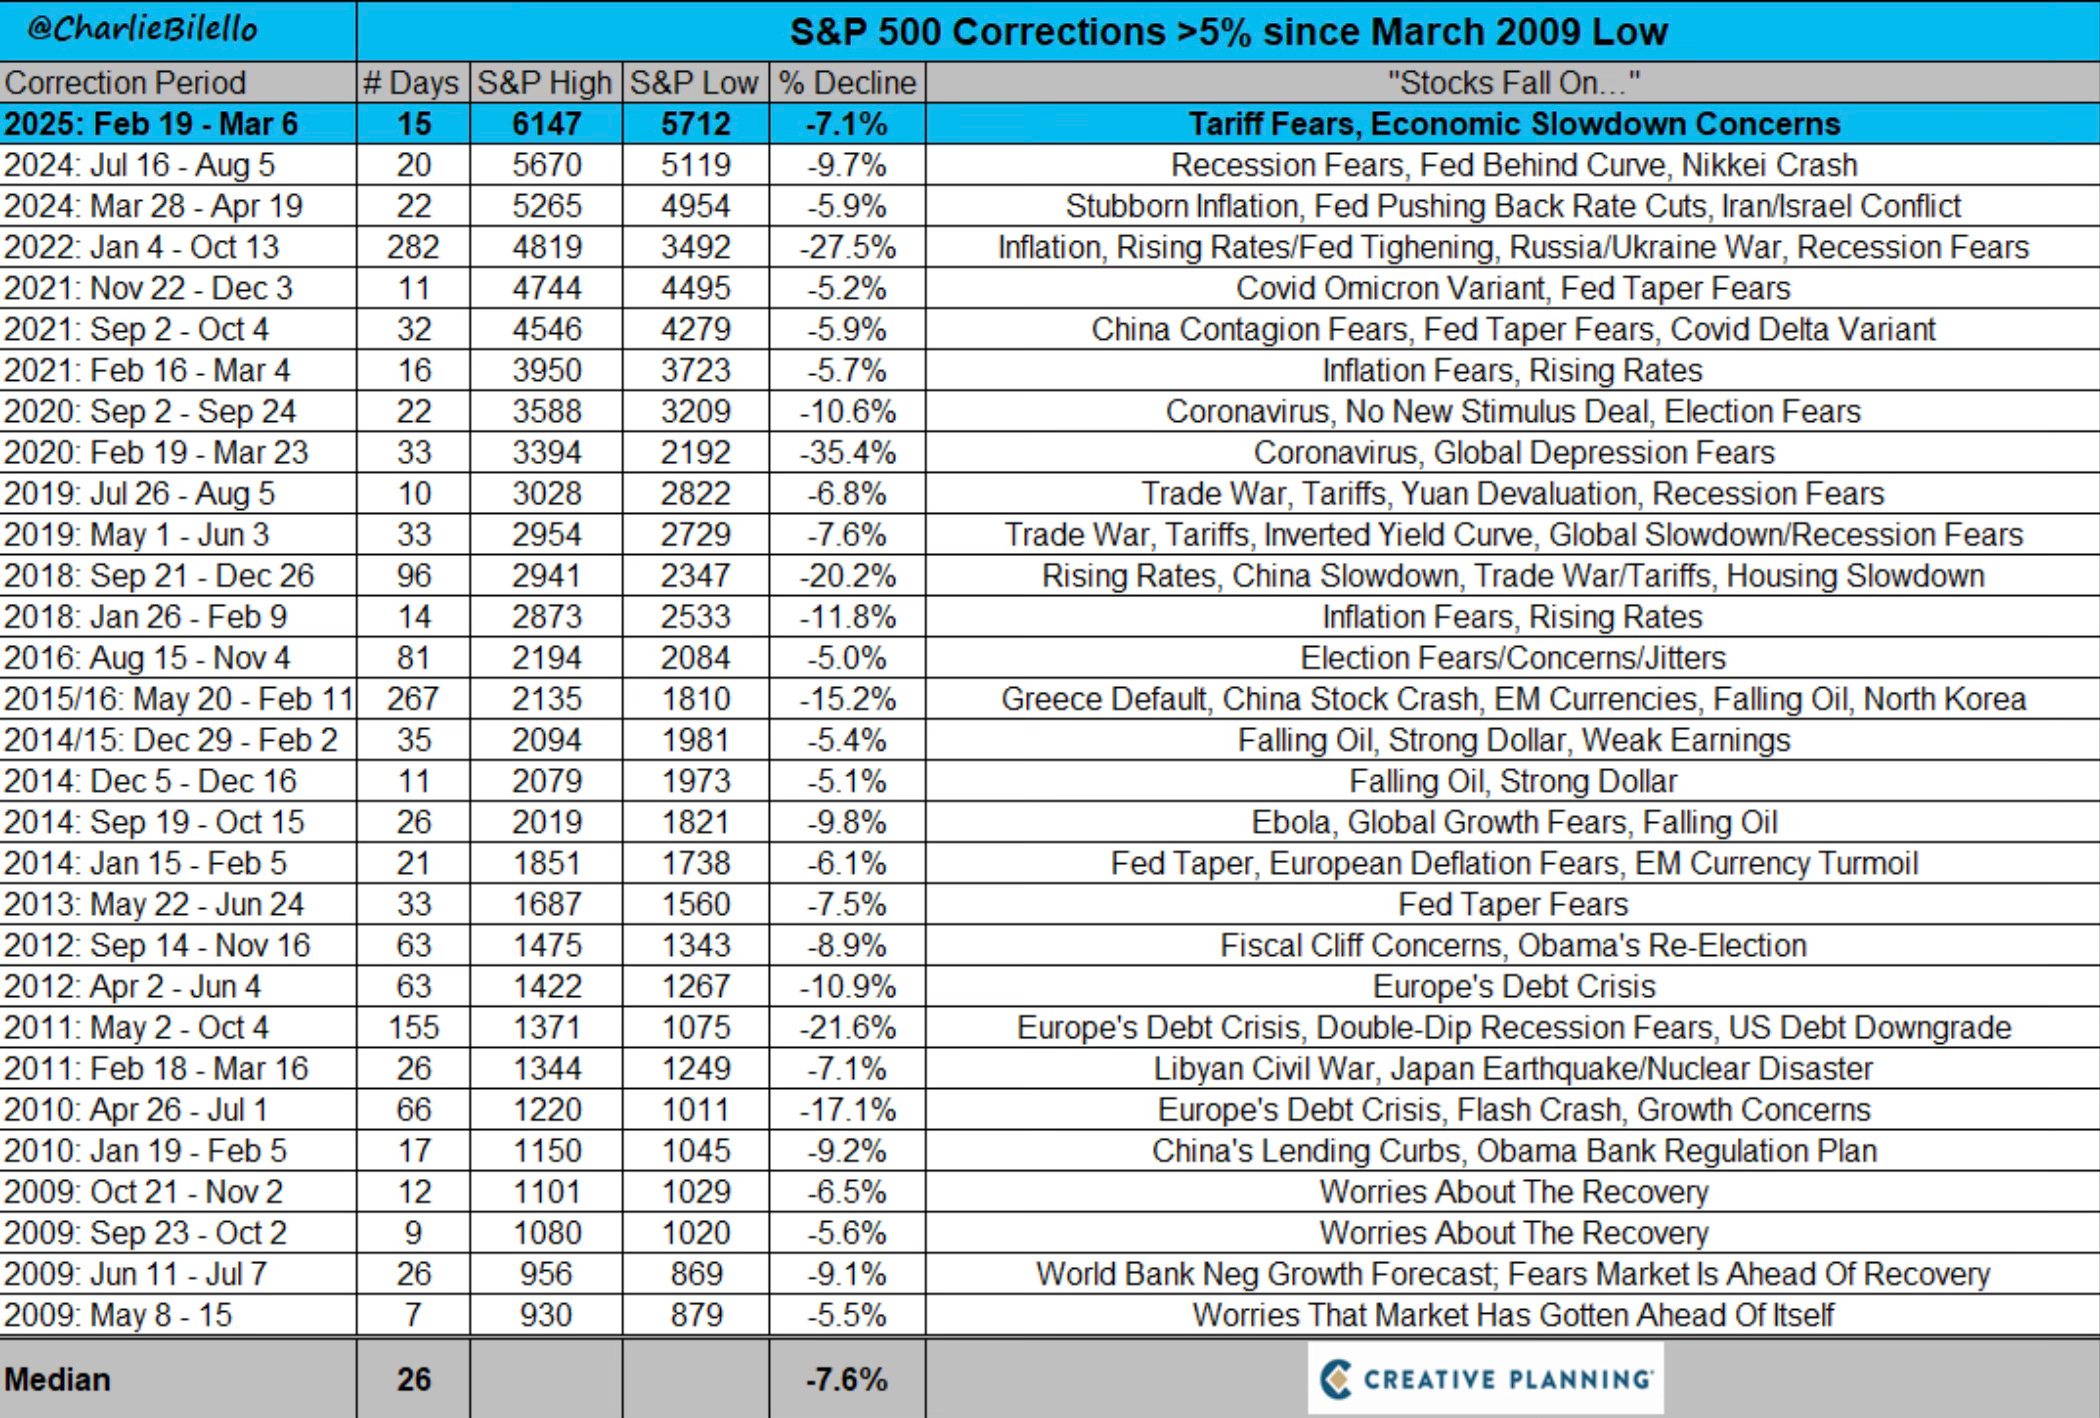
Did you know that it has been 142 days since the S&P 500 has experienced a 5% correction? It last happened in August 2024. That’s 6 months! Investors have been really spoiled with the smooth road and lack of volatility.
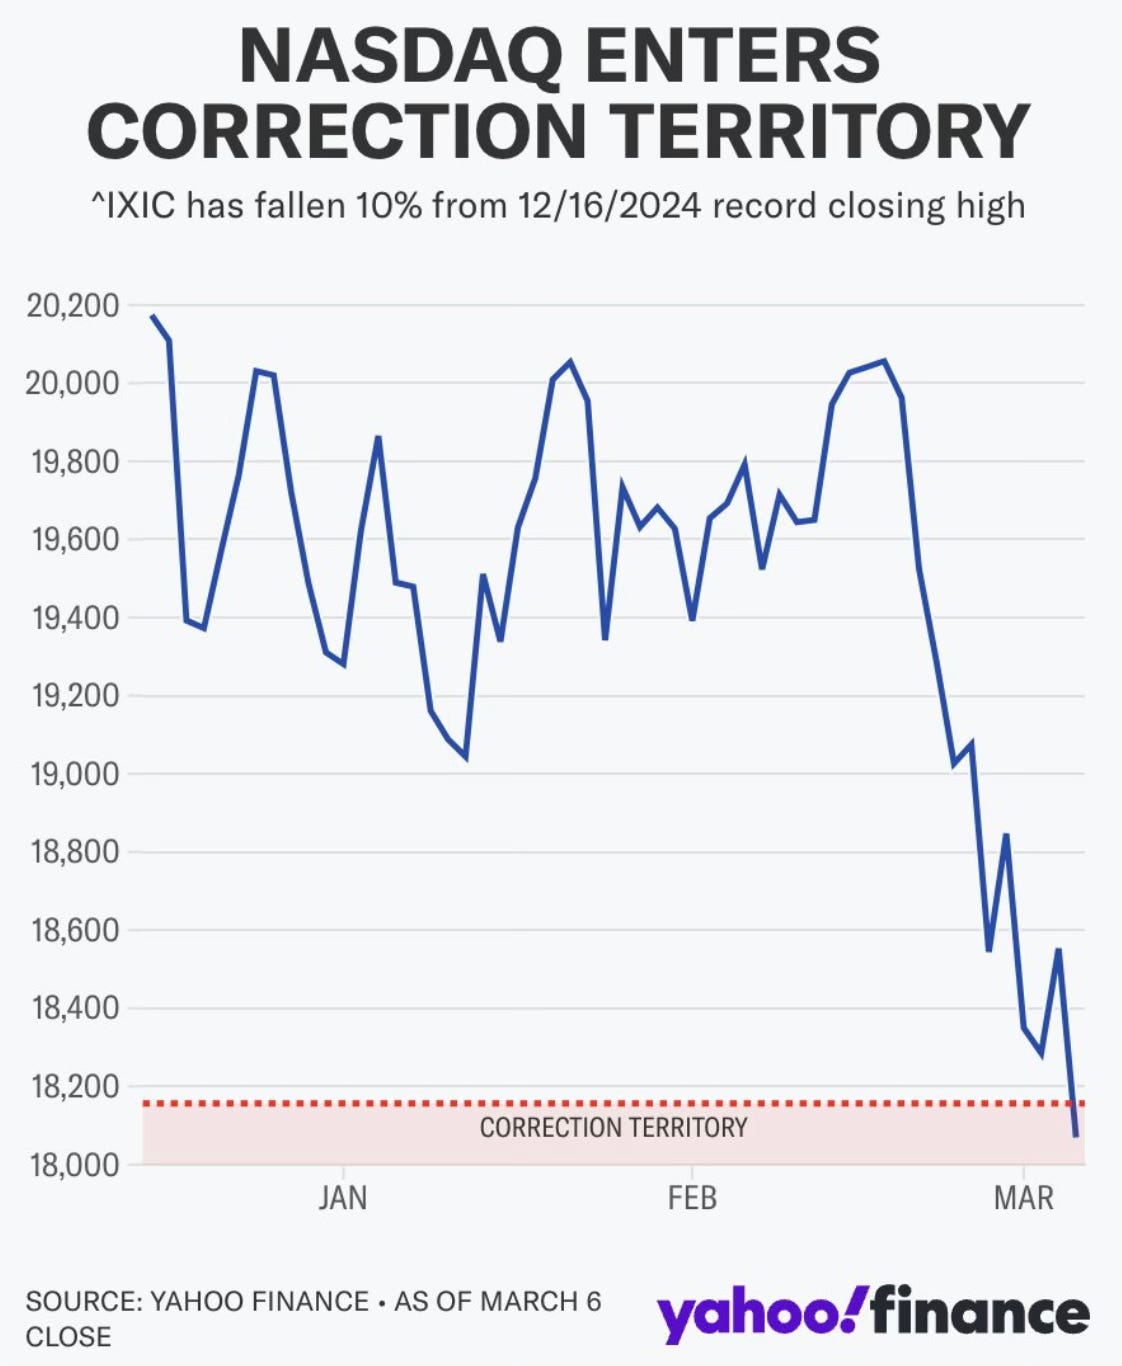
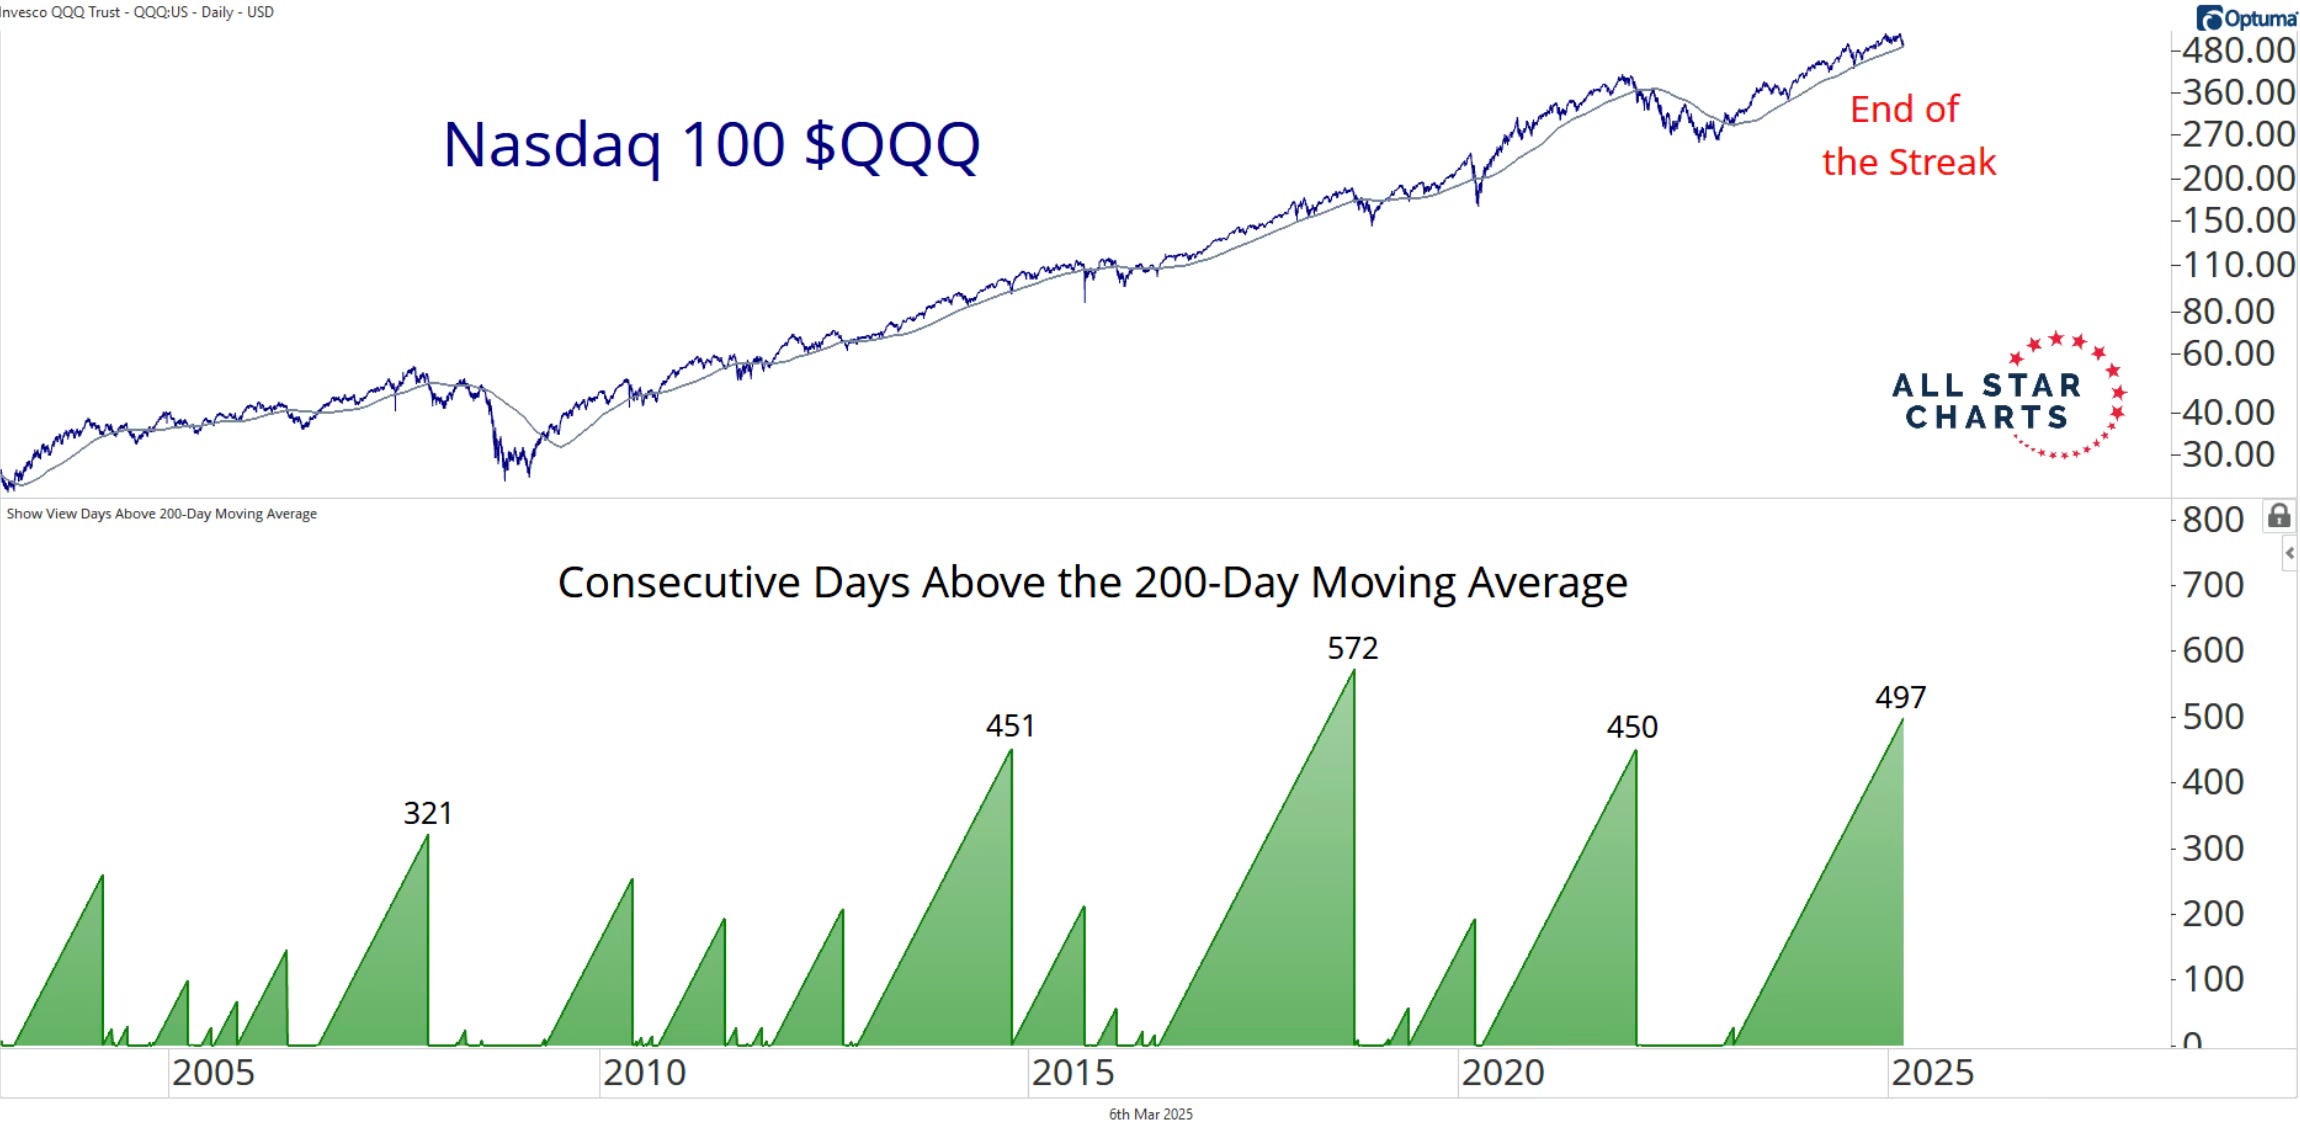
The Nasdaq has now fallen over 10% from its closing high on December 16th. It’s now in correction territory.
This week saw the 2nd longest streak above the 200-day ever for the Nasdaq end. After 497 days, the Nasdaq finally closed below the 200-day. What a streak!
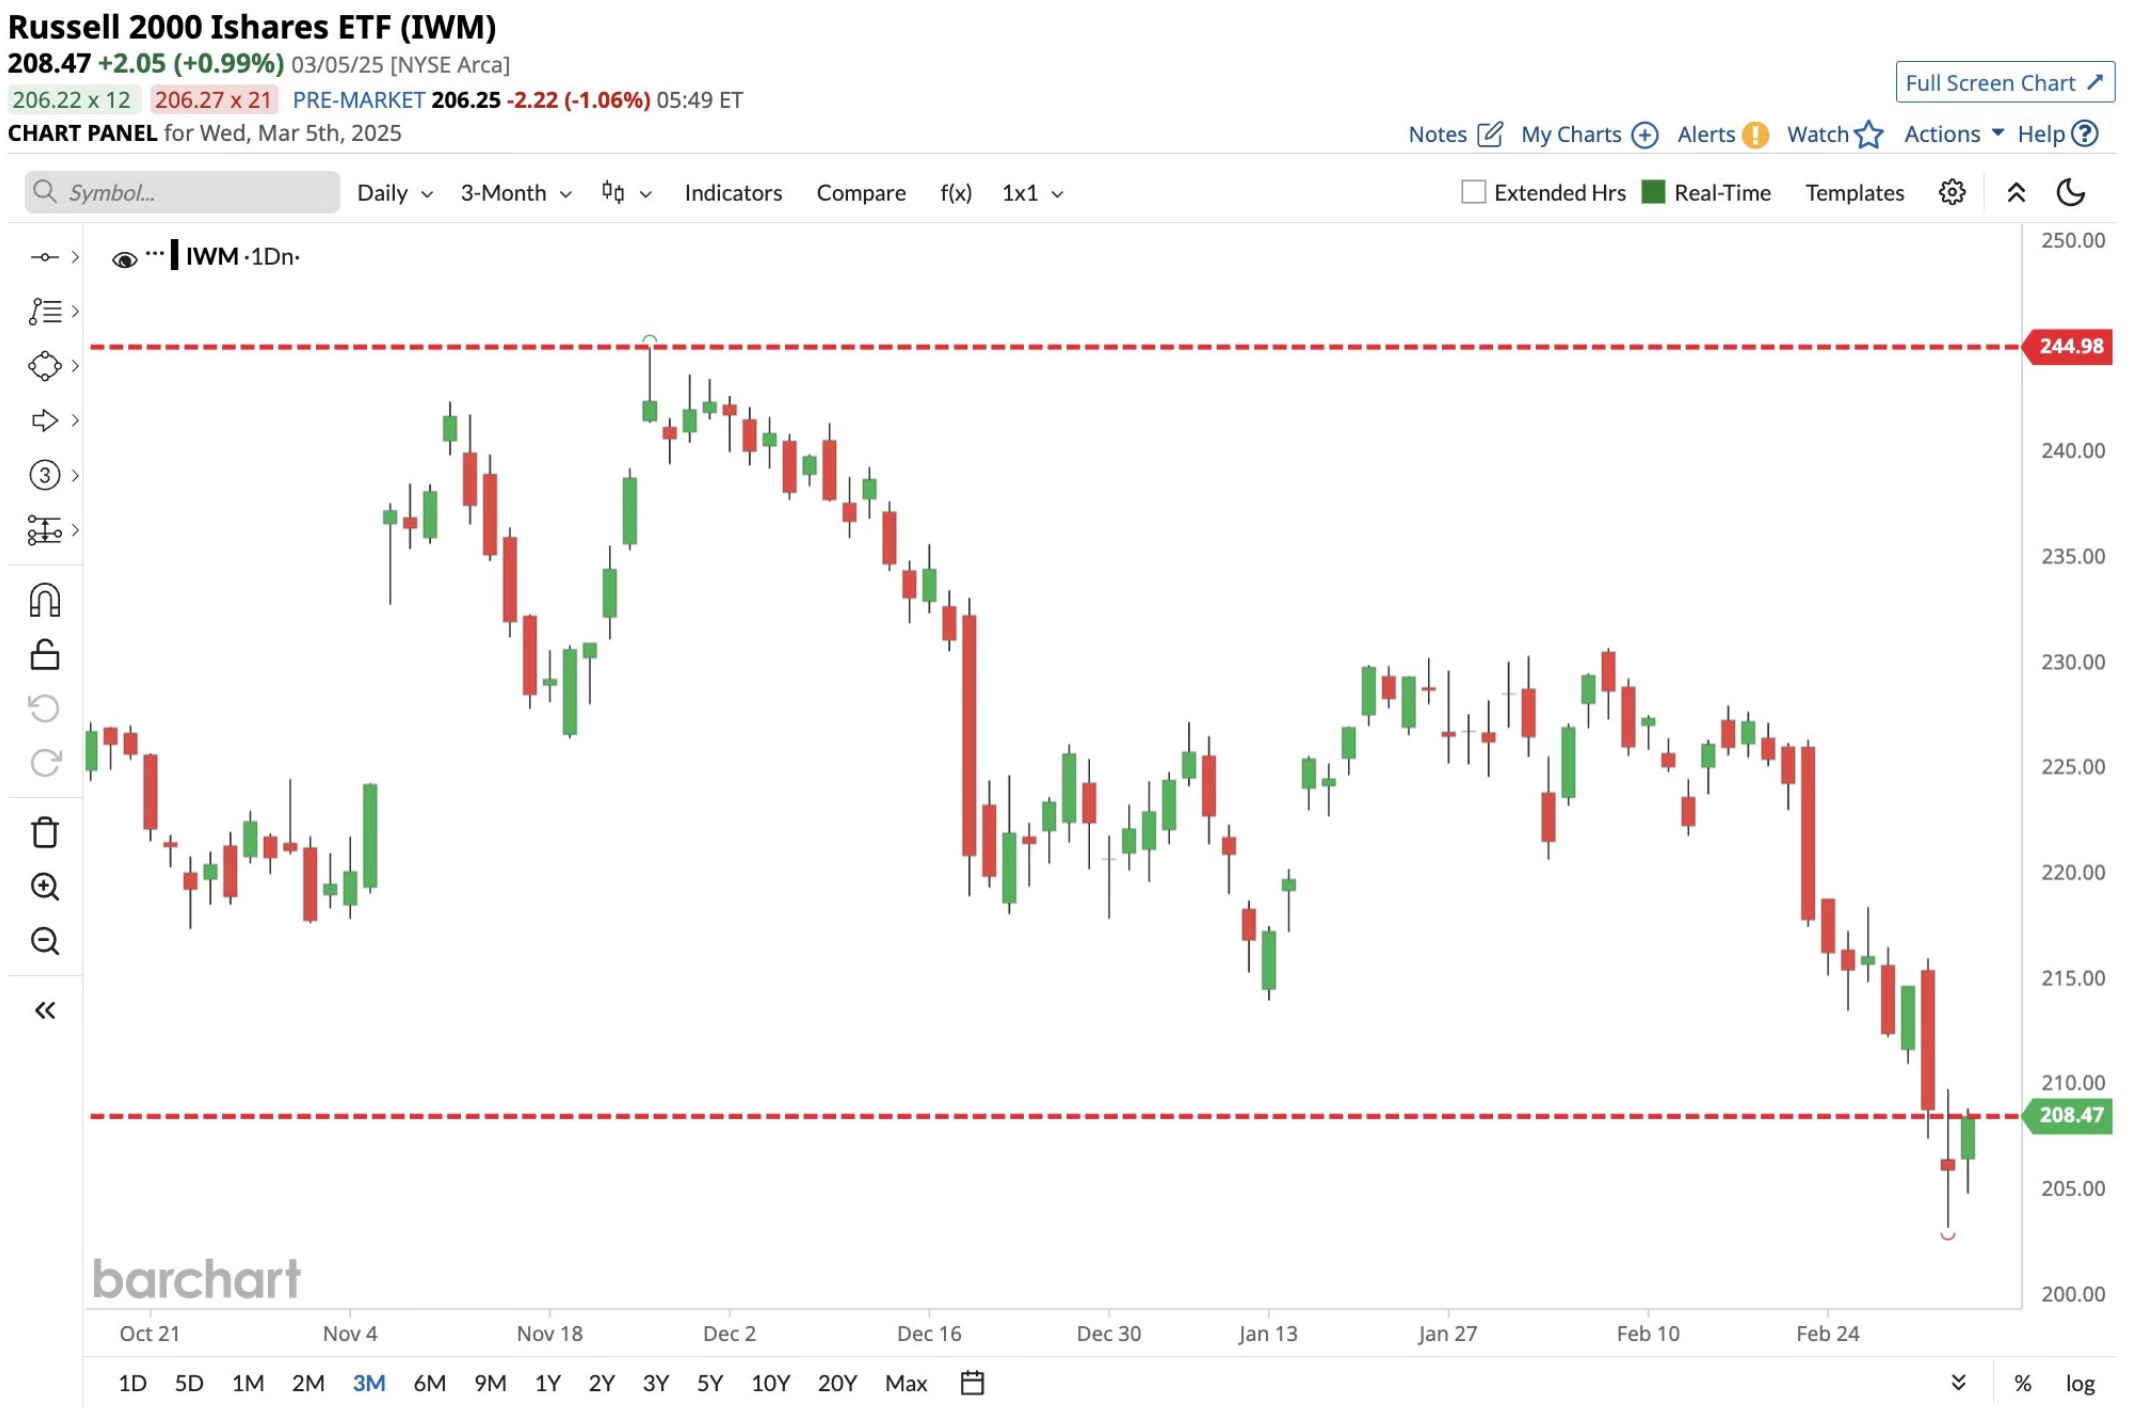
The Russell is down over 15% from its high in late November.
Like I said, it was a good week to get over with. A lot has changed in just over a weeks time. The S&P 500 finds itself in the midst of an over 7% correction from the February 19th high.
Doe this mean now is the time to put money to work and buy? Or is there more downside ahead? More on that in a bit.
What To Expect In March
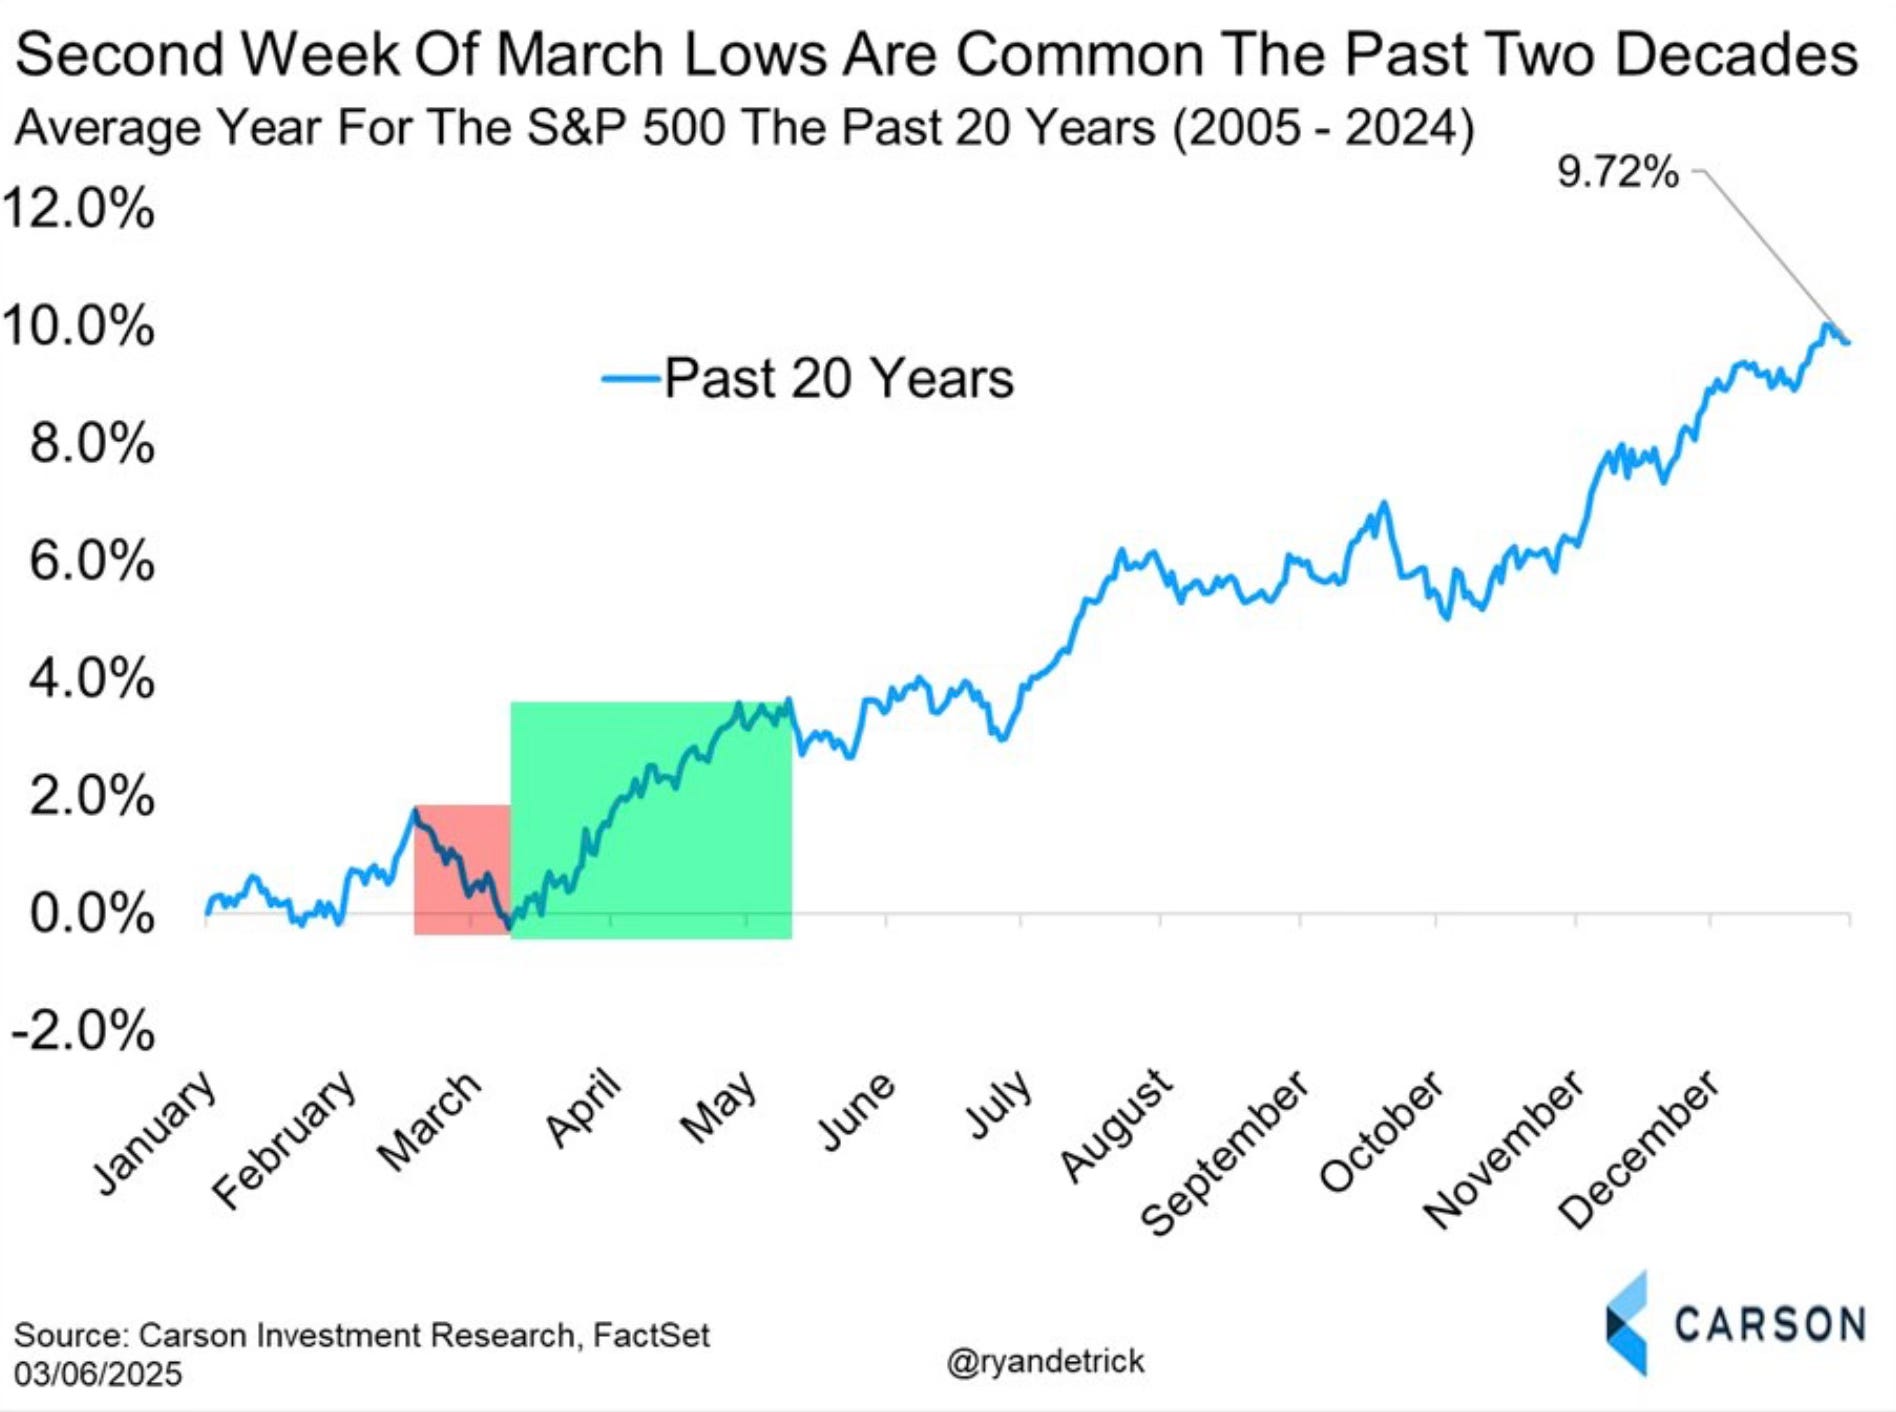
March tends to be a green month but especially come mid-month around St. Patrick’s Day. That’s when the green really shines.
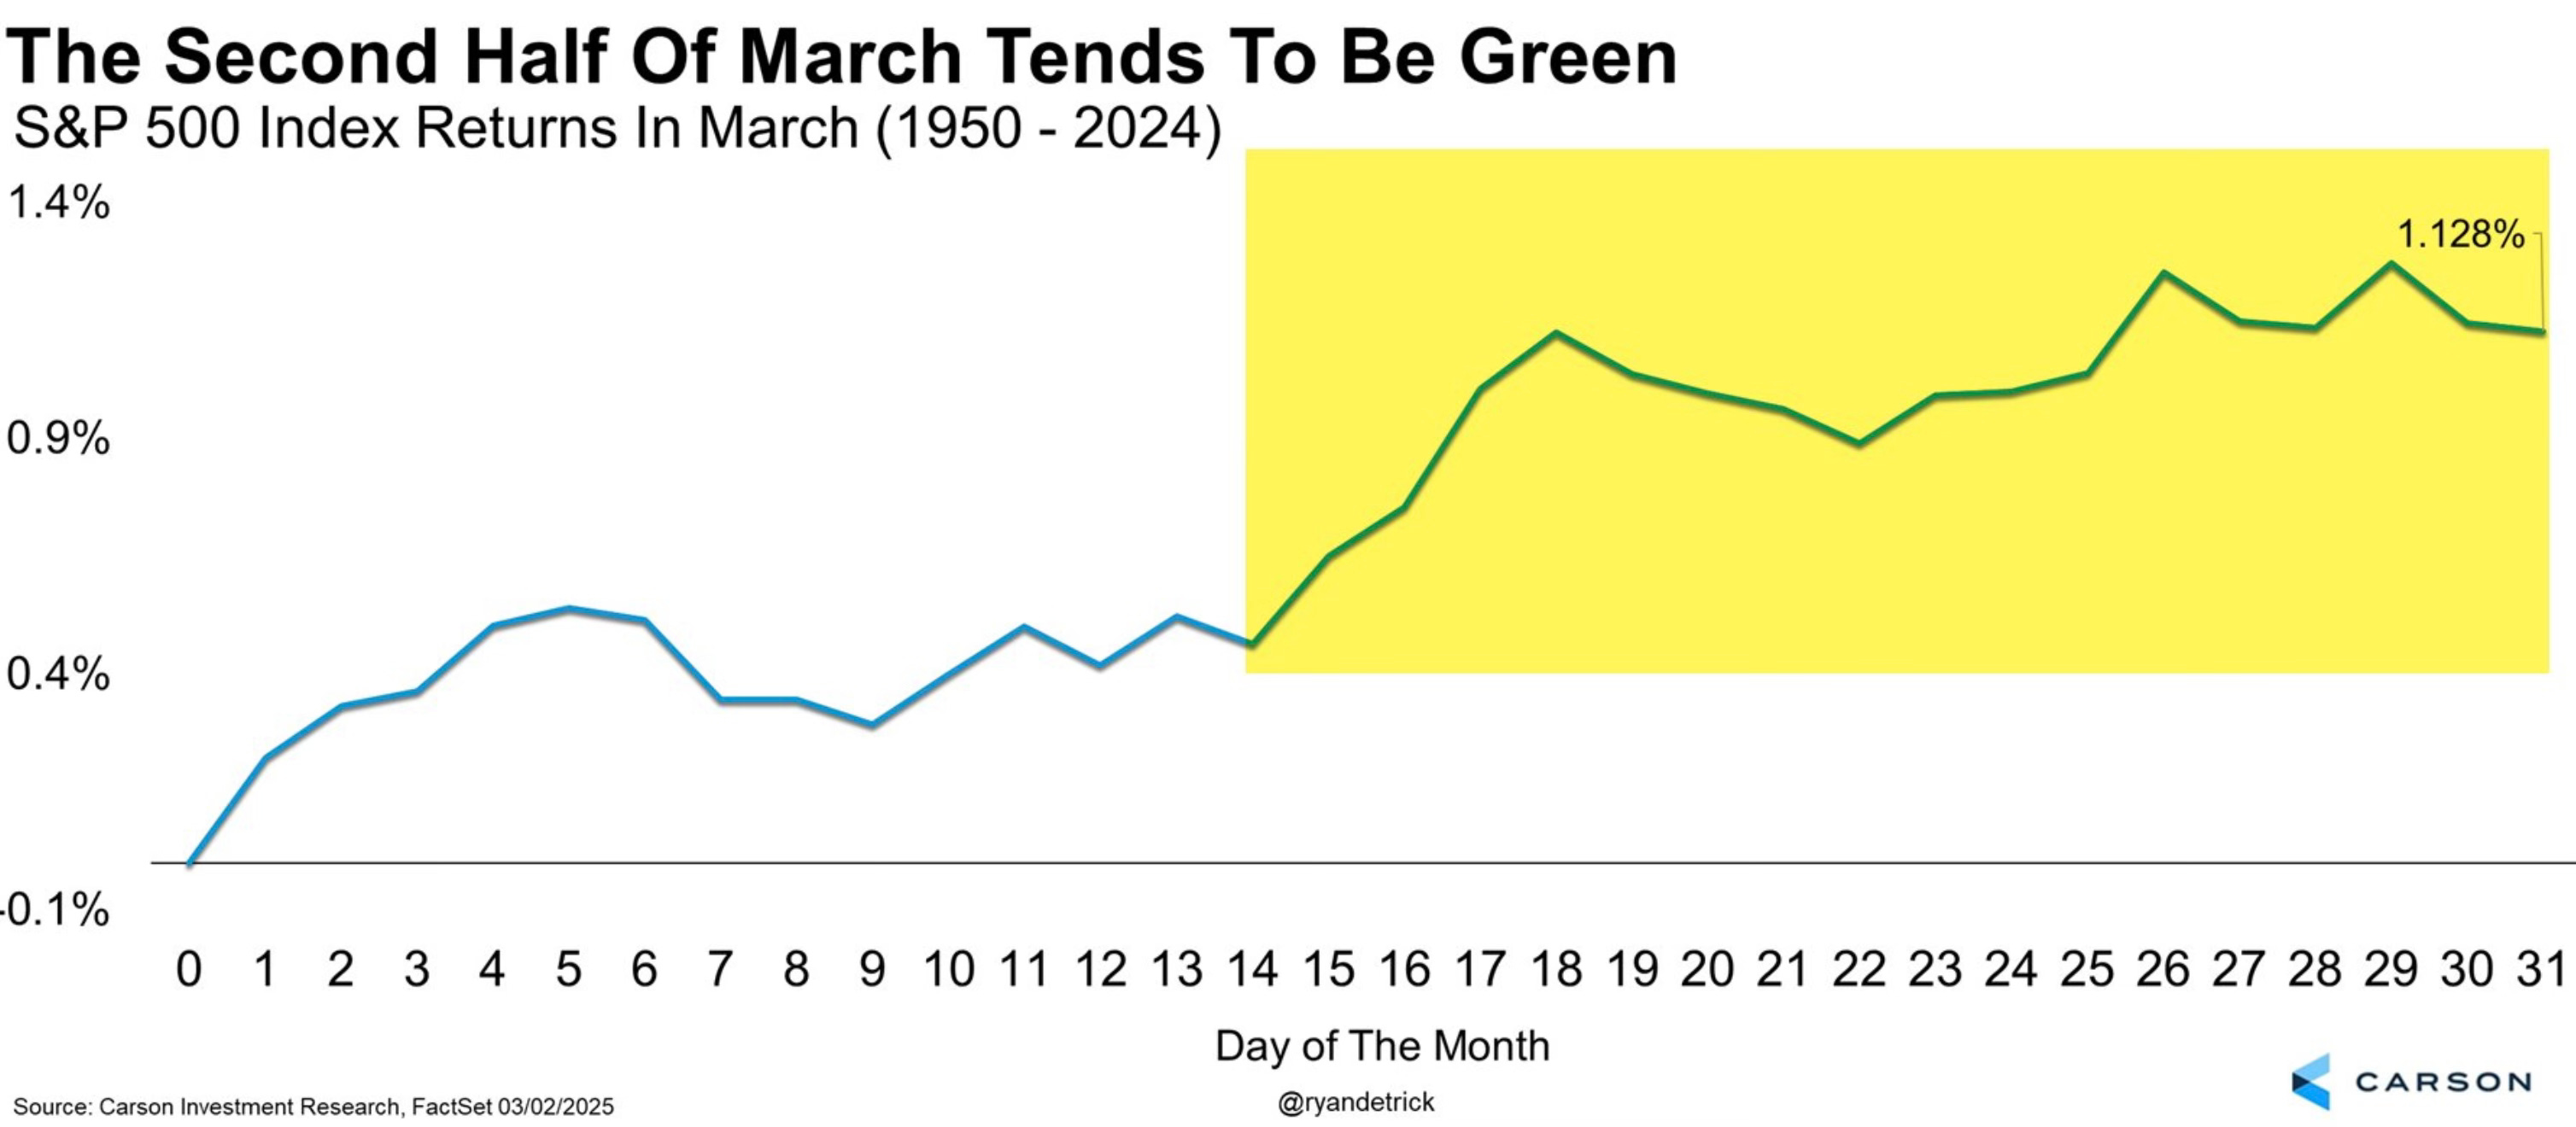
Now this area of weakness that we’ve had in the second week of March isn’t uncommon. The late February into early March weakness we’ve actually seen over the last 20 years is playing out yet again. You can see that this point in March has been the lows over the past two decades.
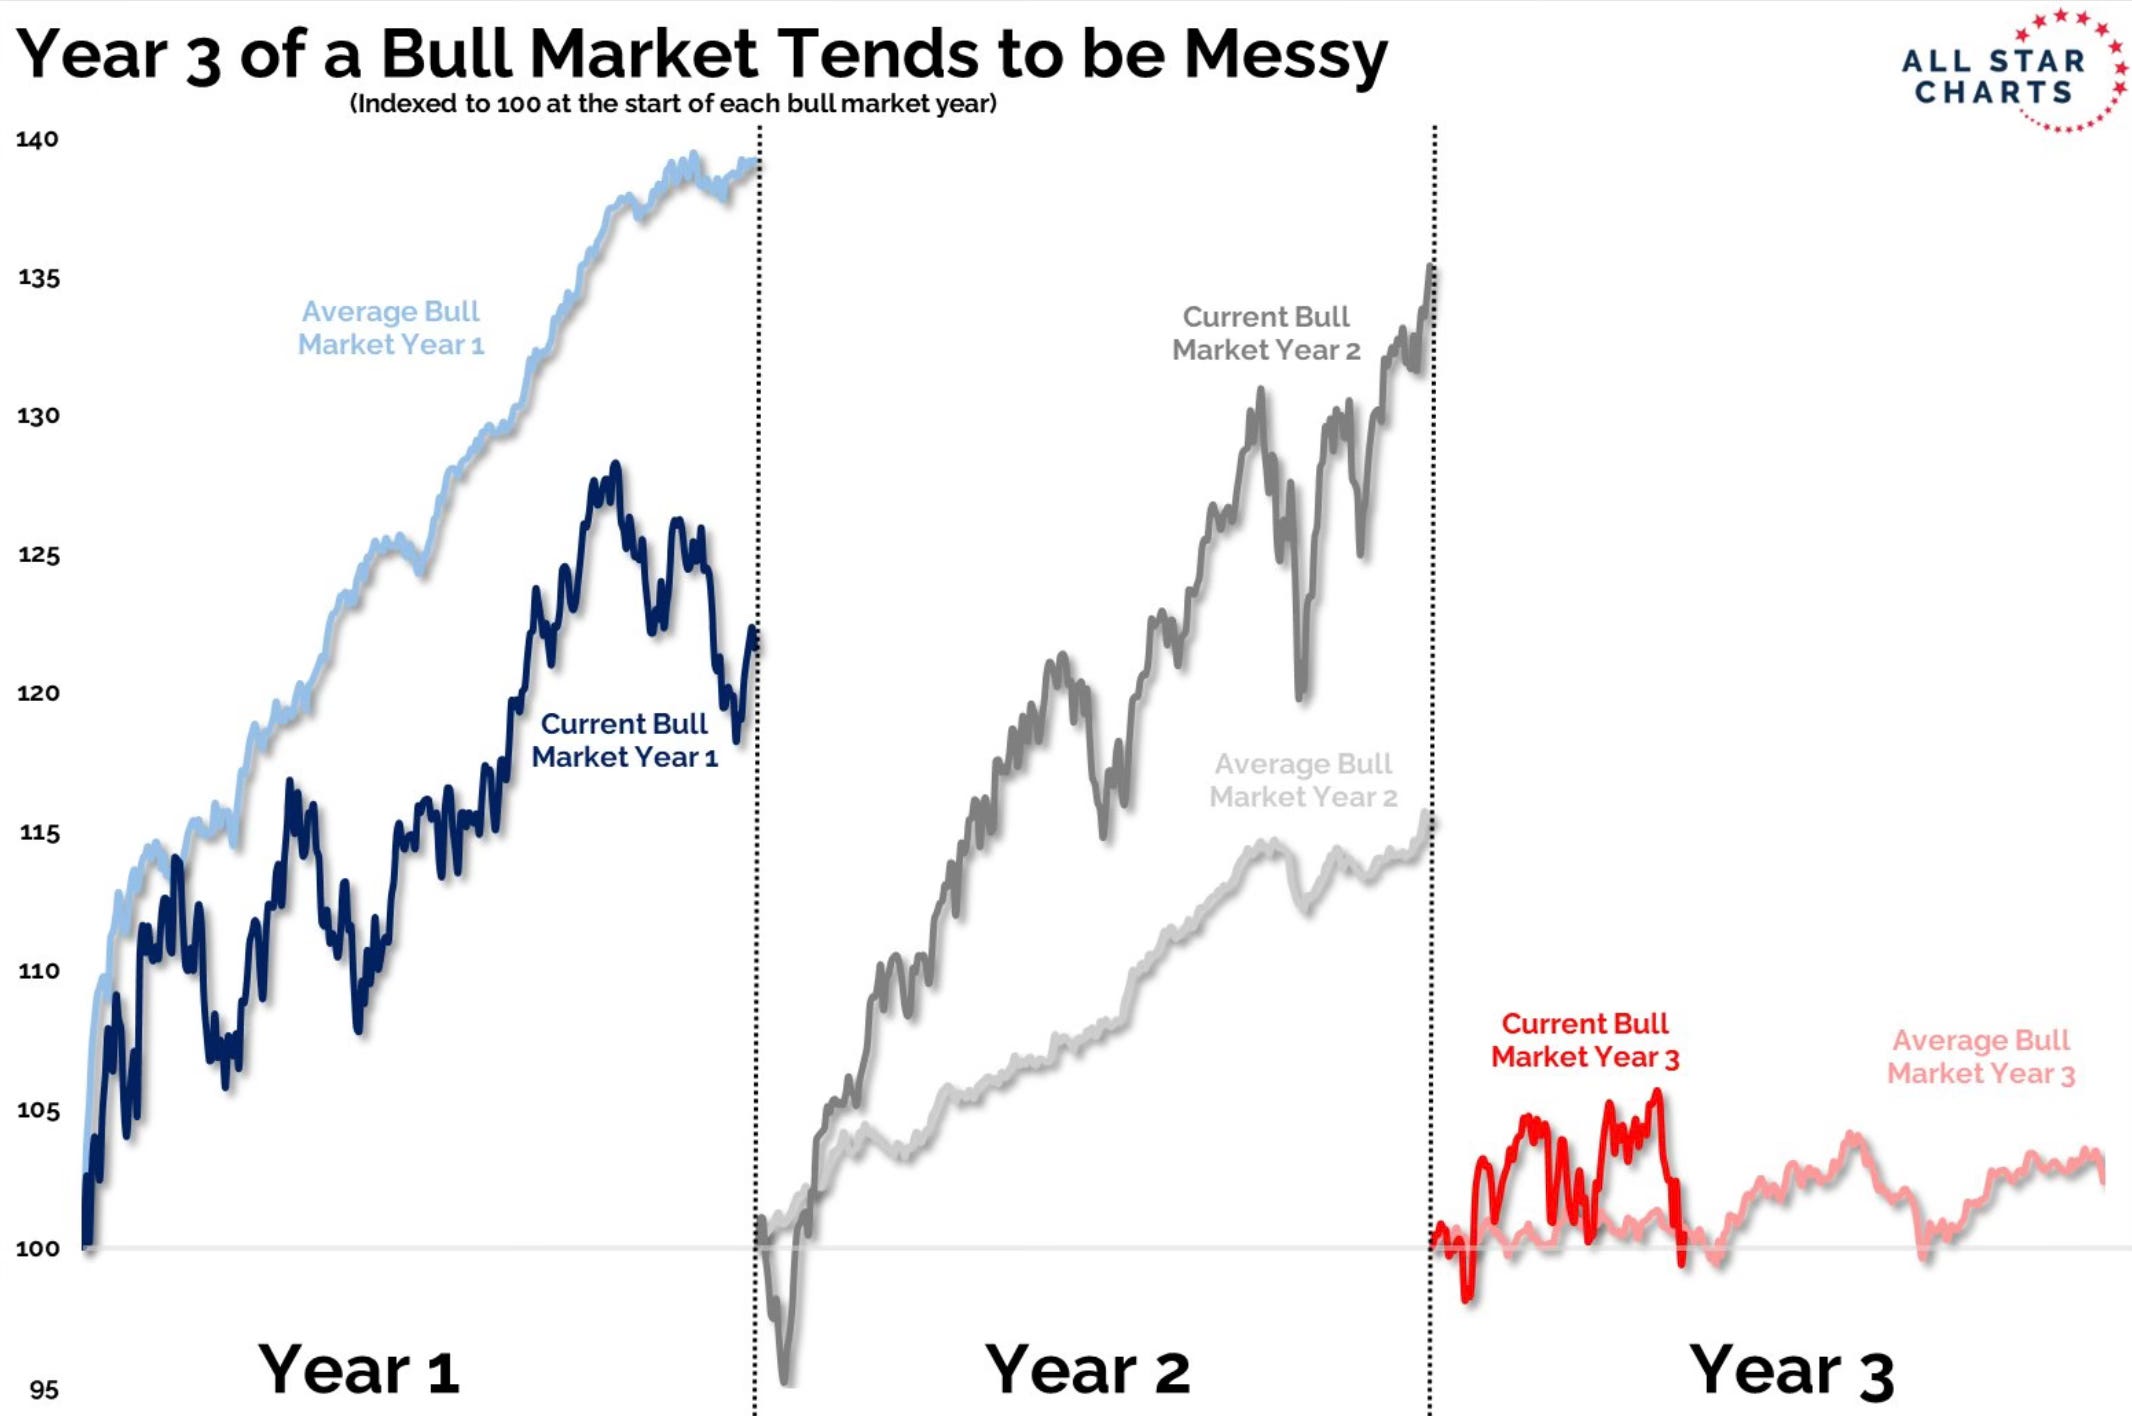
Don’t forget what this point in the 3rd year of a bull market usually brings. A lot of choppiness. I mean technically this should be expected at this point in the 3rd year of a bull market.