


Investing Update: Time To Buy These Stocks
What I'm buying, selling & watching
Wednesday saw the Fed leave interest rates unchanged. The forecast for two rate cuts in 2025 remained unchanged. That propelled the S&P 500 to have its best day since July.
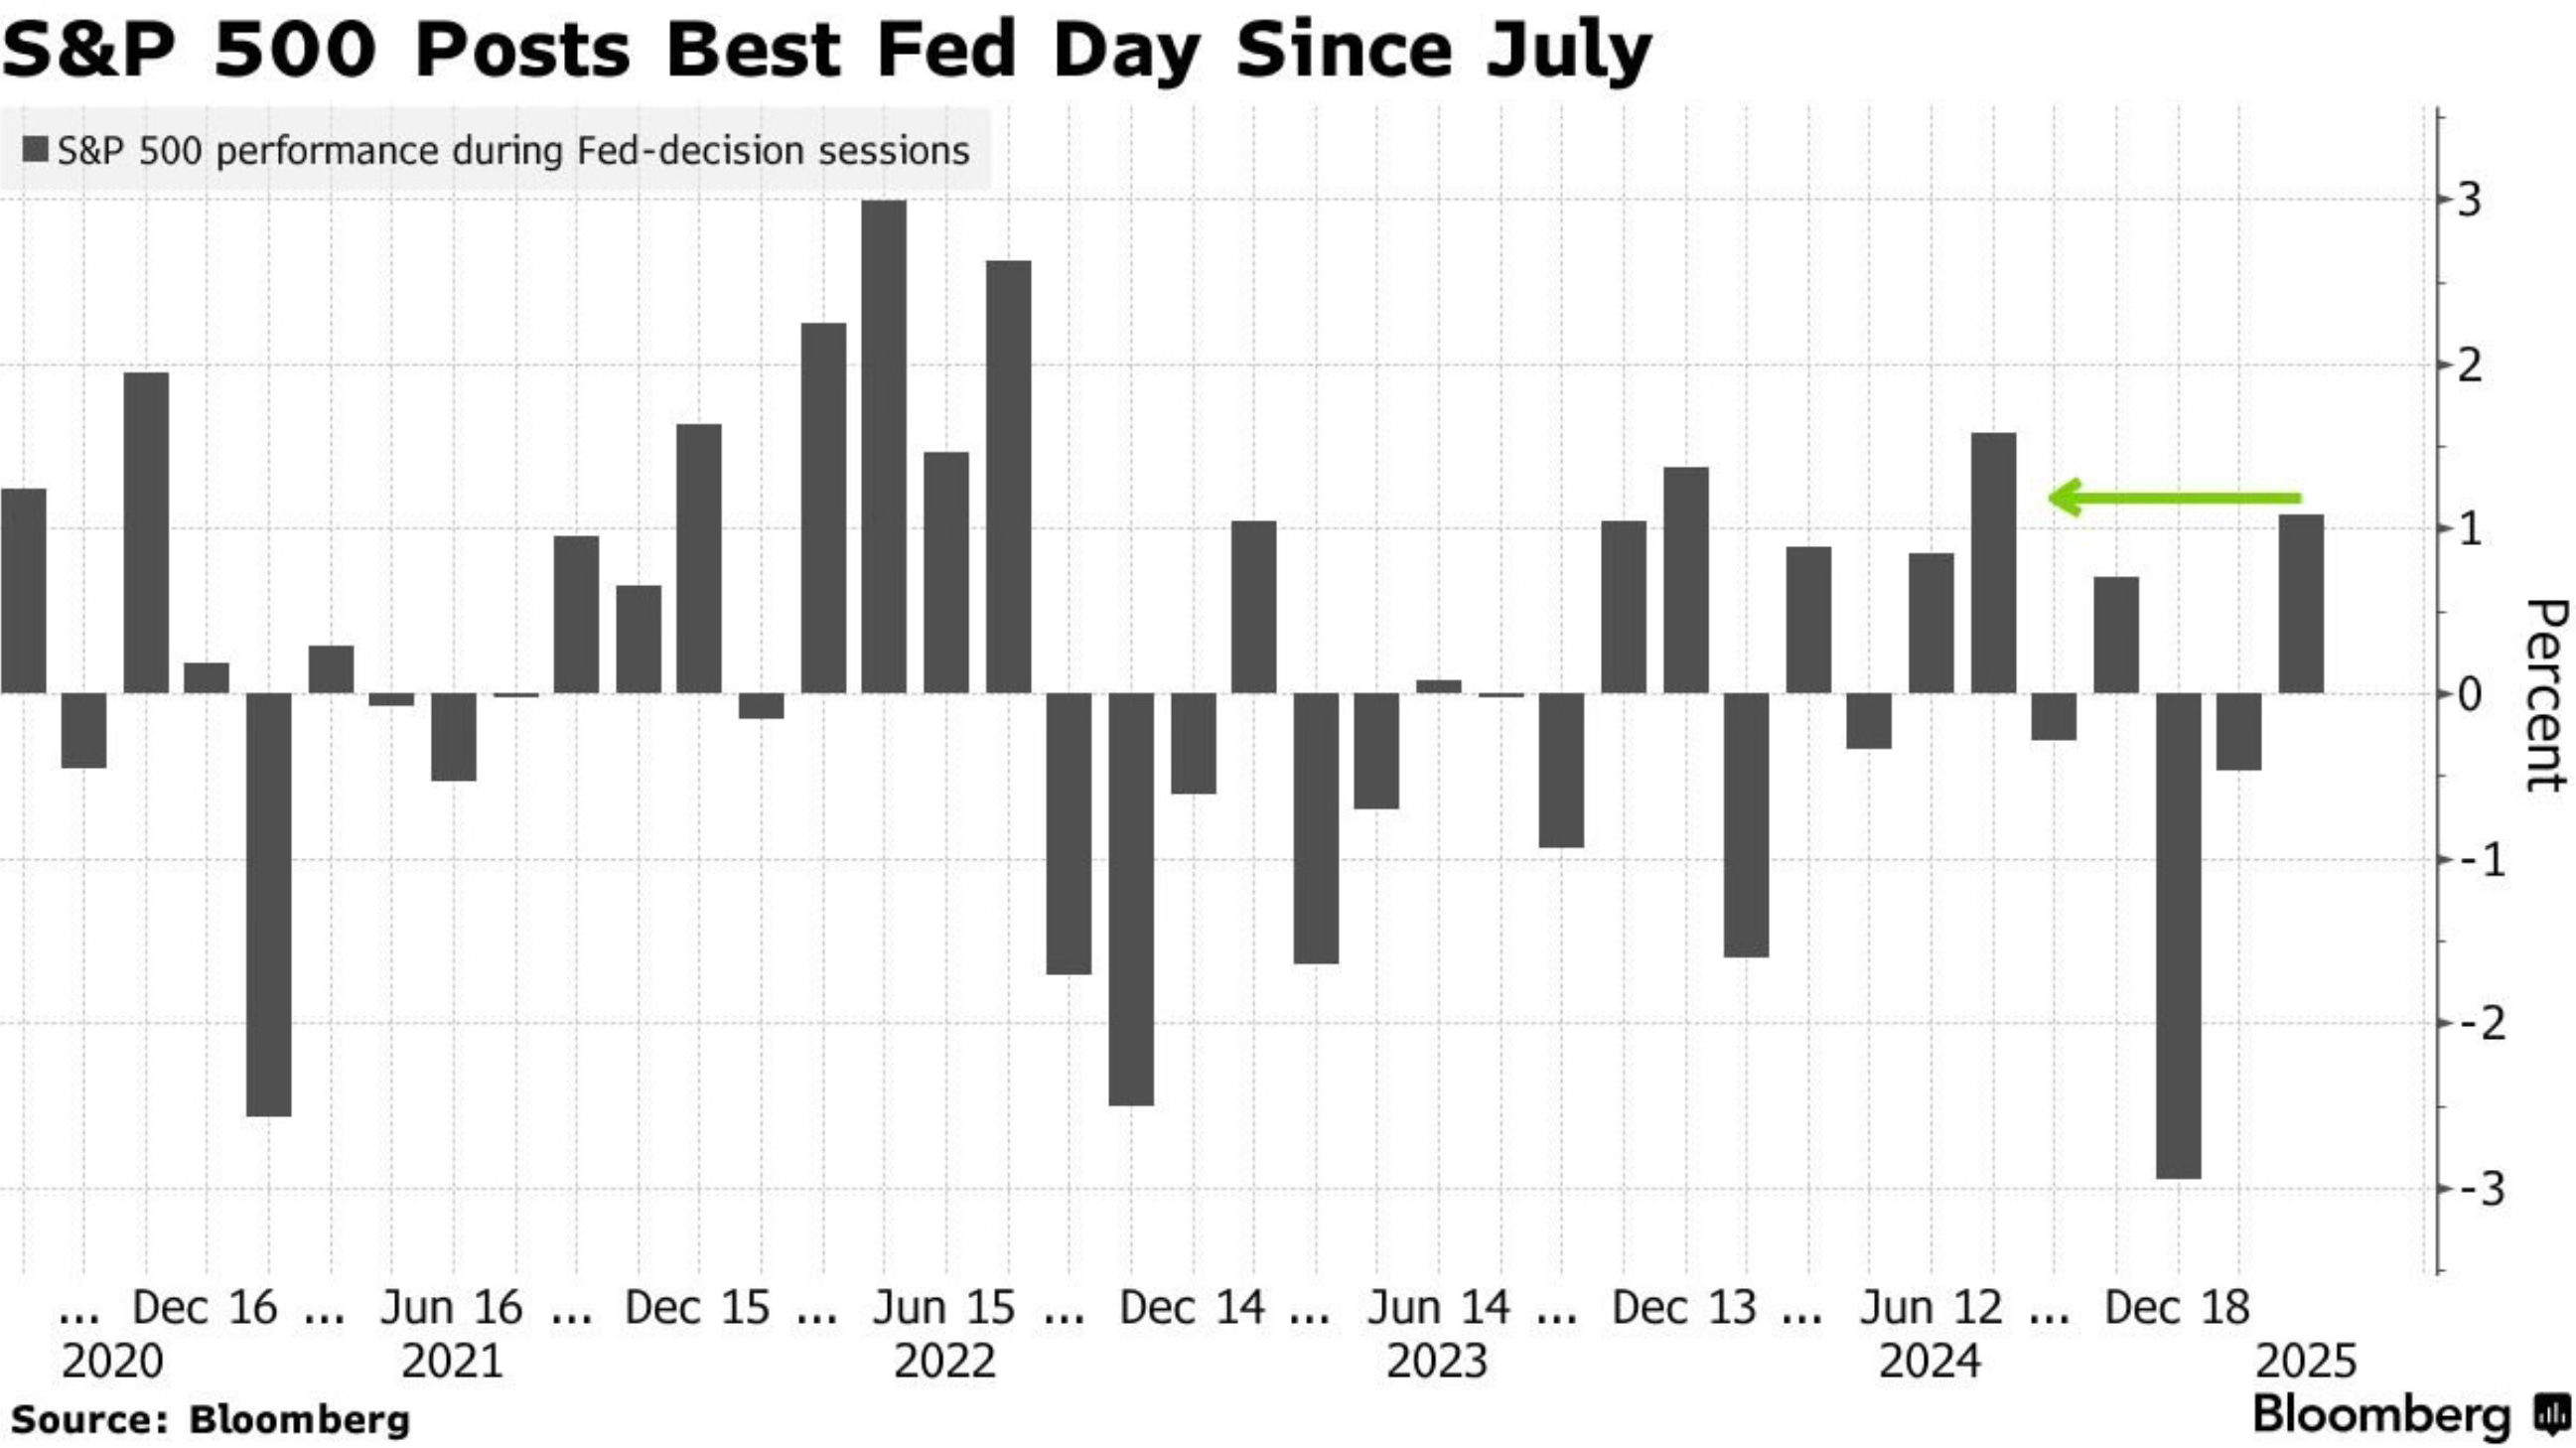
That pushed stocks to finish the week in the green. That snaps a 4-week losing streak for both the S&P 500 and the Nasdaq. The Dow is close to turning positive for the year.
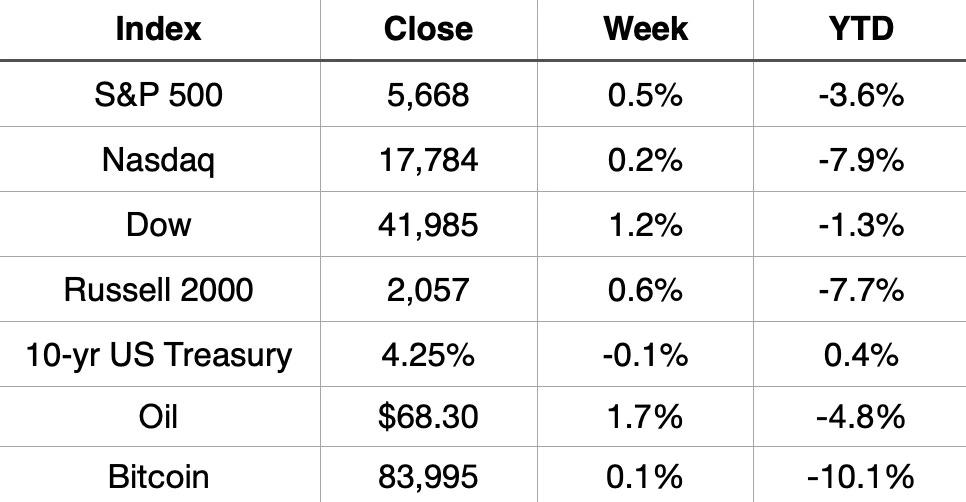
Market Recap
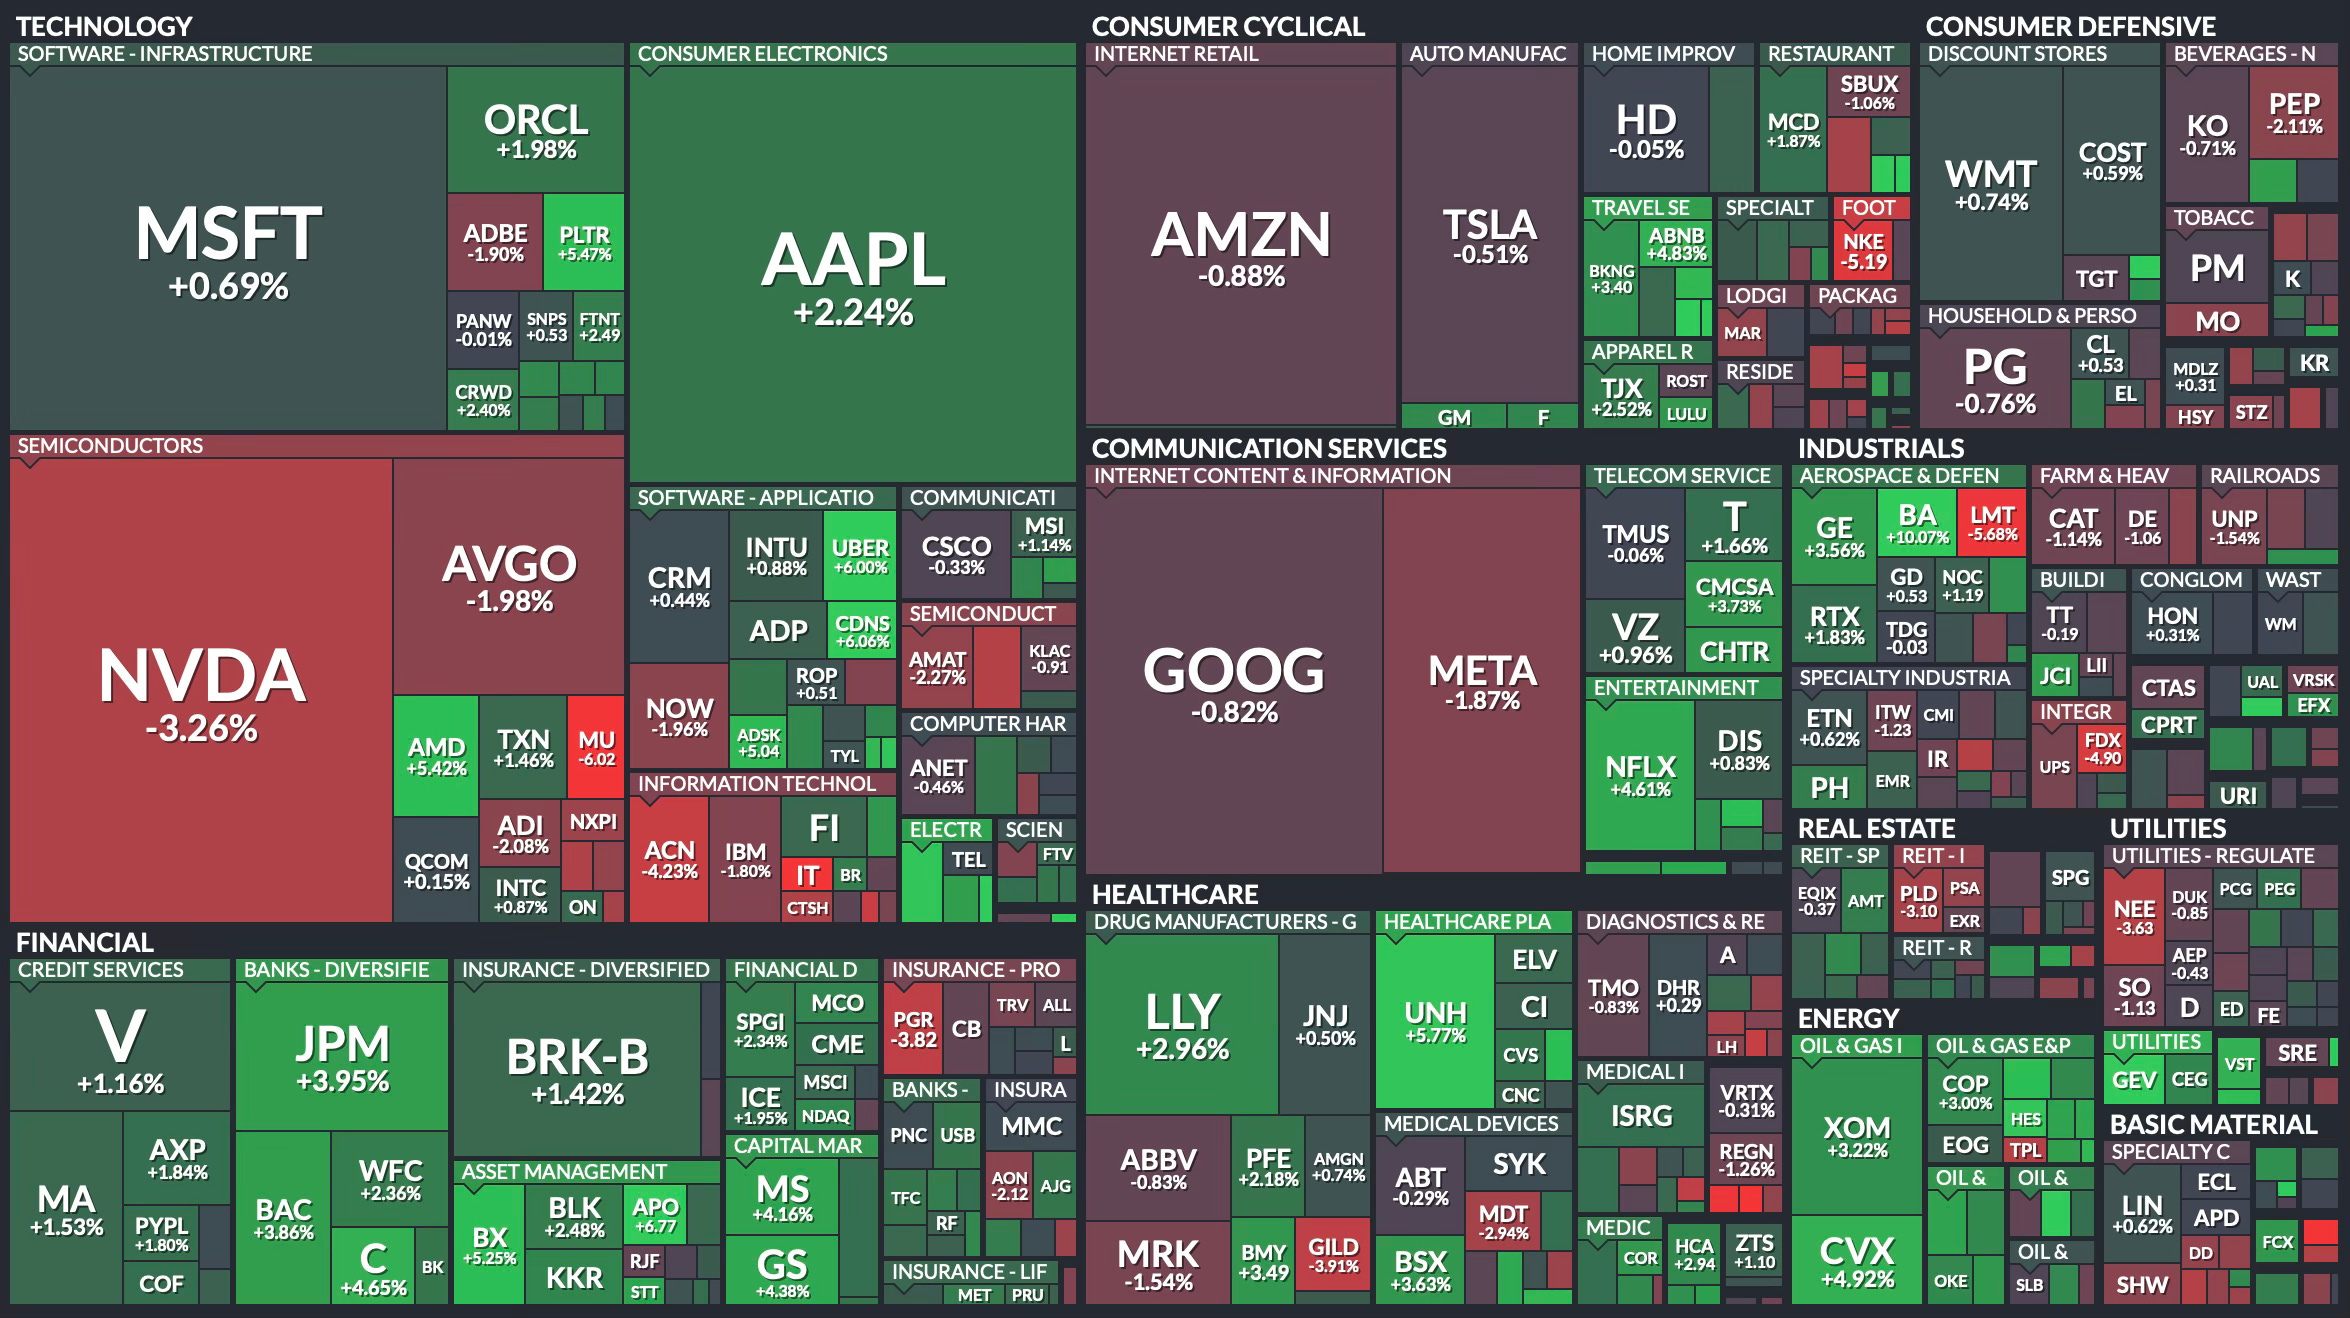
Weekly Heat Map Of Stocks
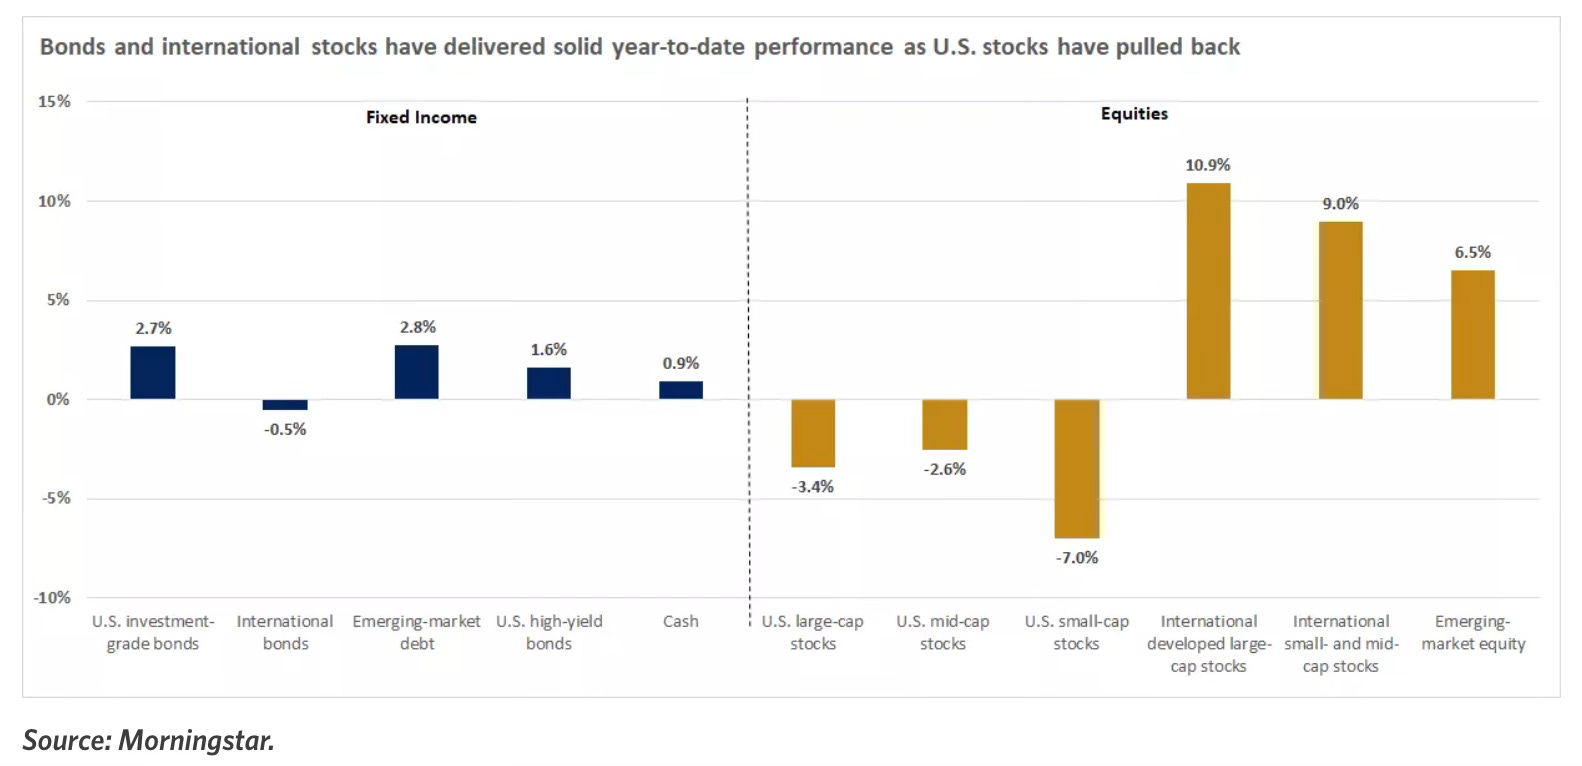
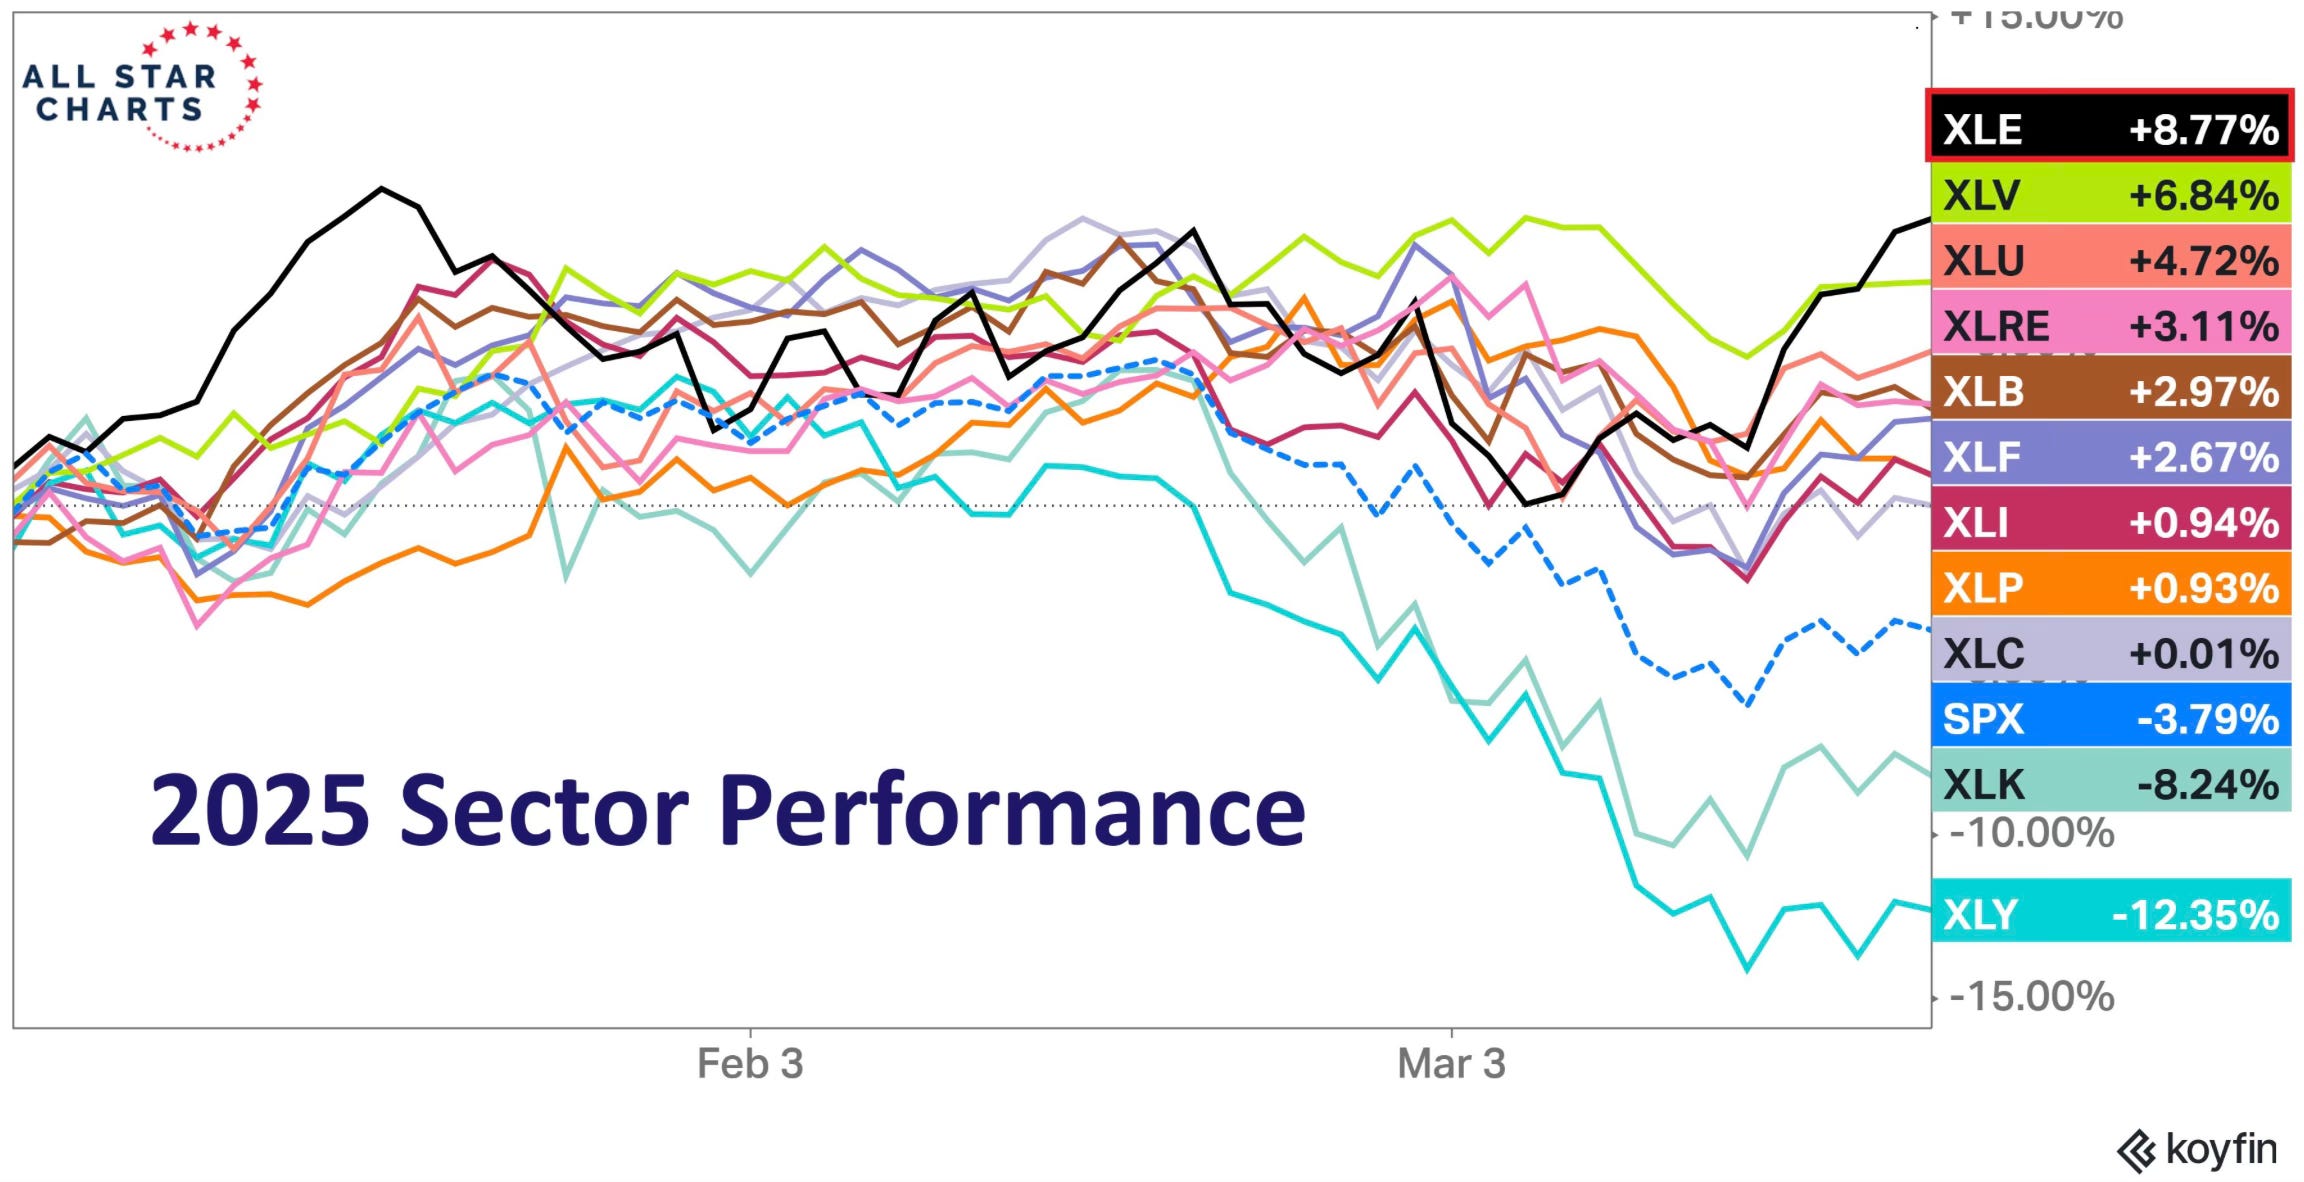
YTD Performance
Through the first 48 trading days of the year, the S&P 500 was off to its 18th worst start in history.
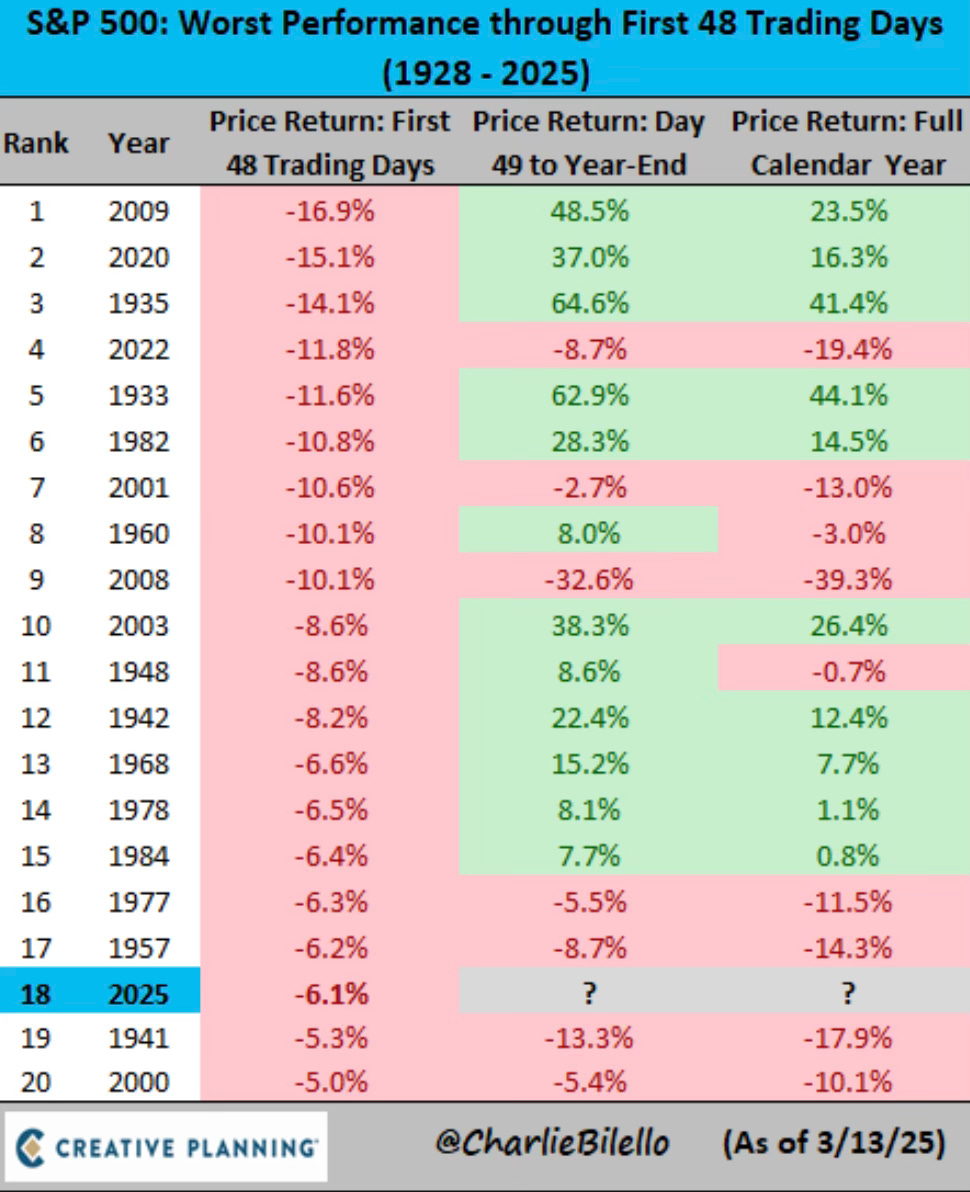
The thing to notice on this chart is that of those 17 years that started worse, in 10 of them the S&P 500 actually finished the year green. A bad start to a year, really means nothing for what could happen for the rest of the year.
Yes, the red in Grant Hawkridge’s chart has grown. Meaning that the percentage of S&P 500 stocks below both their 200-day and 50-day has been increasing.
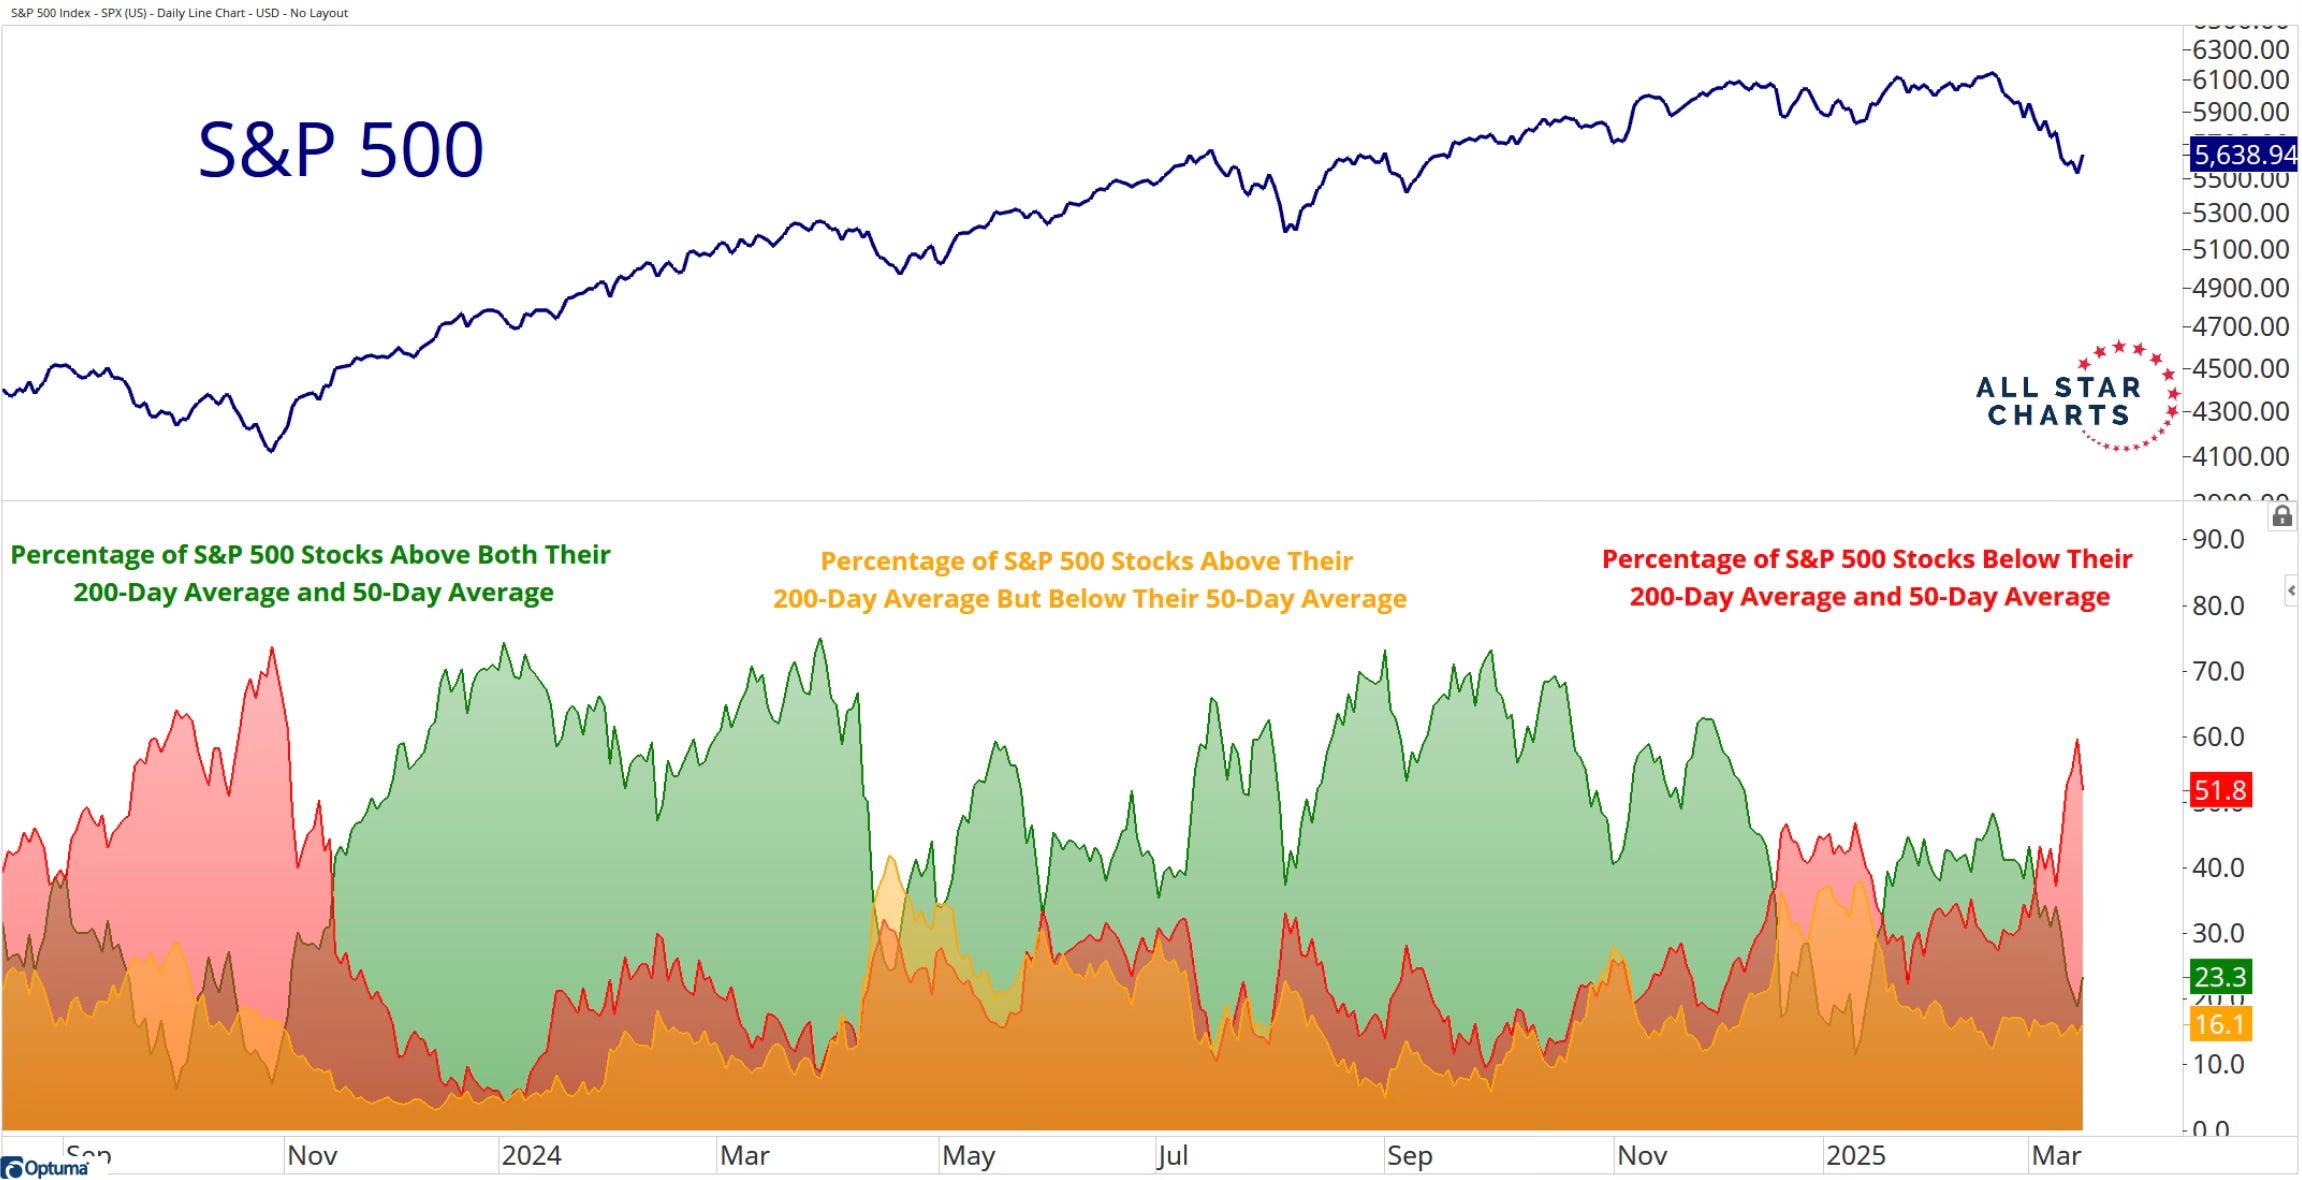
But a mid-week rally has shown that the market may just be rebounding from the tariff scare. The volatility and unknown about tariffs are now priced in. The markets also liked what the Fed had to say. That was evident as the reversal happened right after the Fed decision.
Then what happens if there is a tariff deal before April 2nd? I think the red in Grant’s chart above will be replaced by a lot of green.