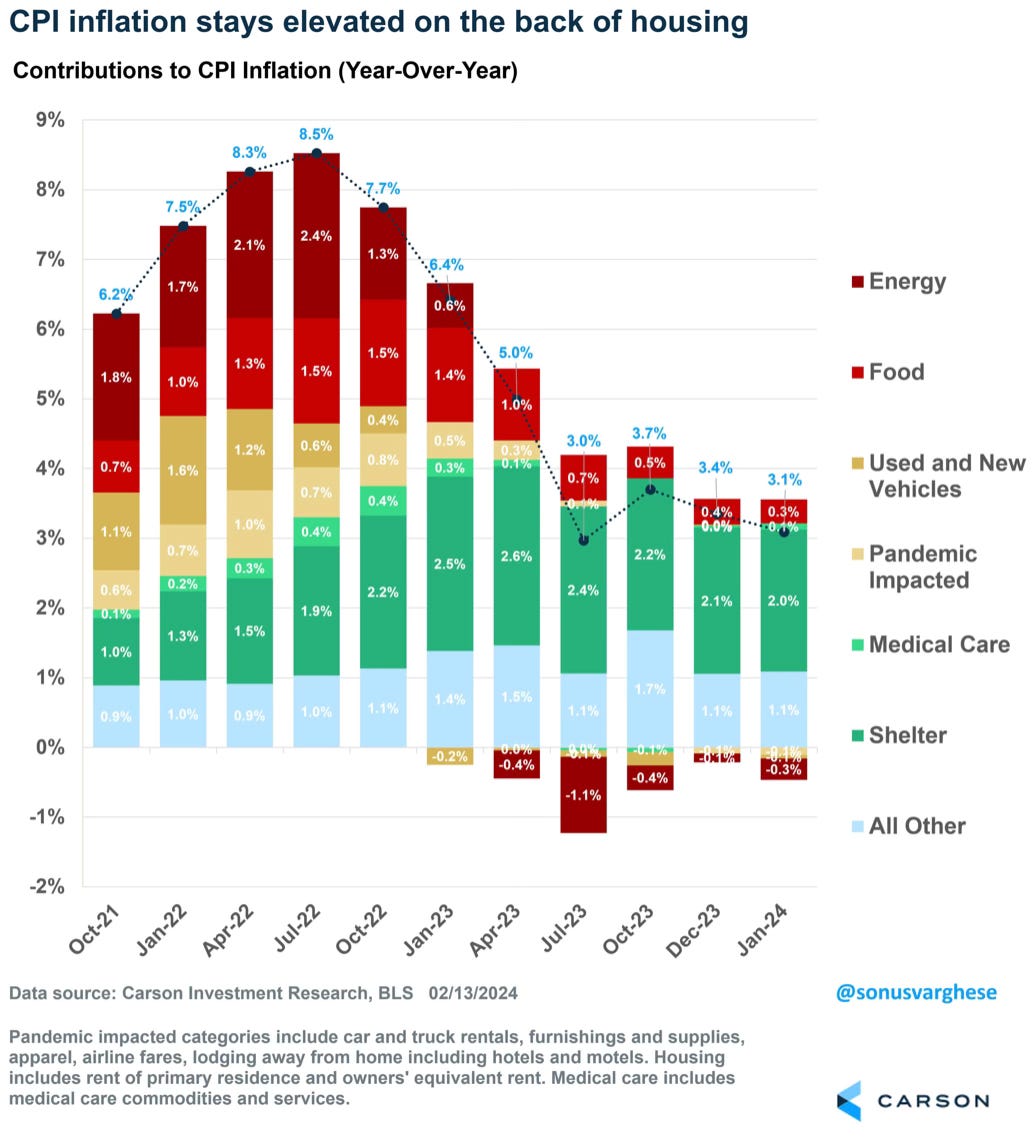
This week we received the January CPI inflation number which was hotter than expected. It came in at 3.1% while the forecasted number was 2.9%. The number is lower than December’s 3.4% but it still remains elevated. Housing continues to be sticky.
The retail sales number this week also came in weaker than expected. They were estimated to have a drop of 0.3%. Instead they tumbled 0.8% in January. That’s down from a 0.4% gain in December. That also broke a 9 month winning streak.

Despite these two bumps in the road as well as the continued higher treasury yields, the stock market continued its resilience.

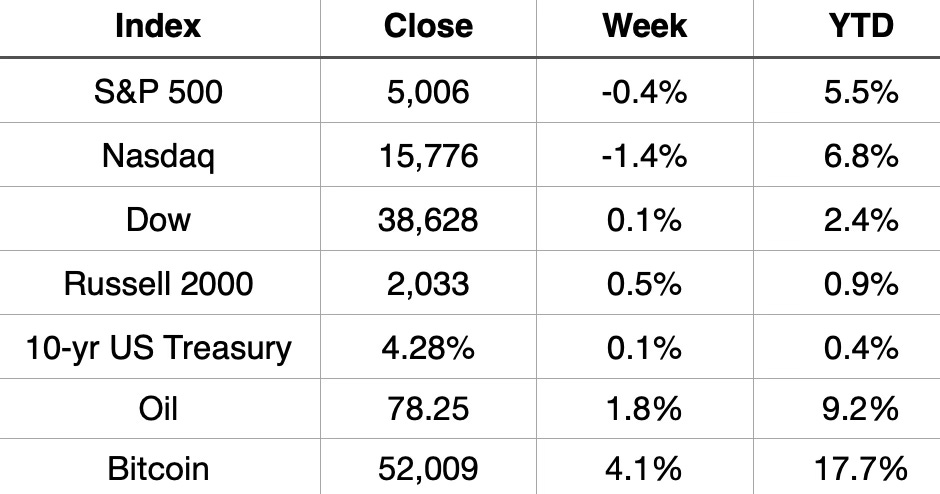
The week finished down slightly but it’s only the 2nd negative week in the past 16 weeks.
Market Recap
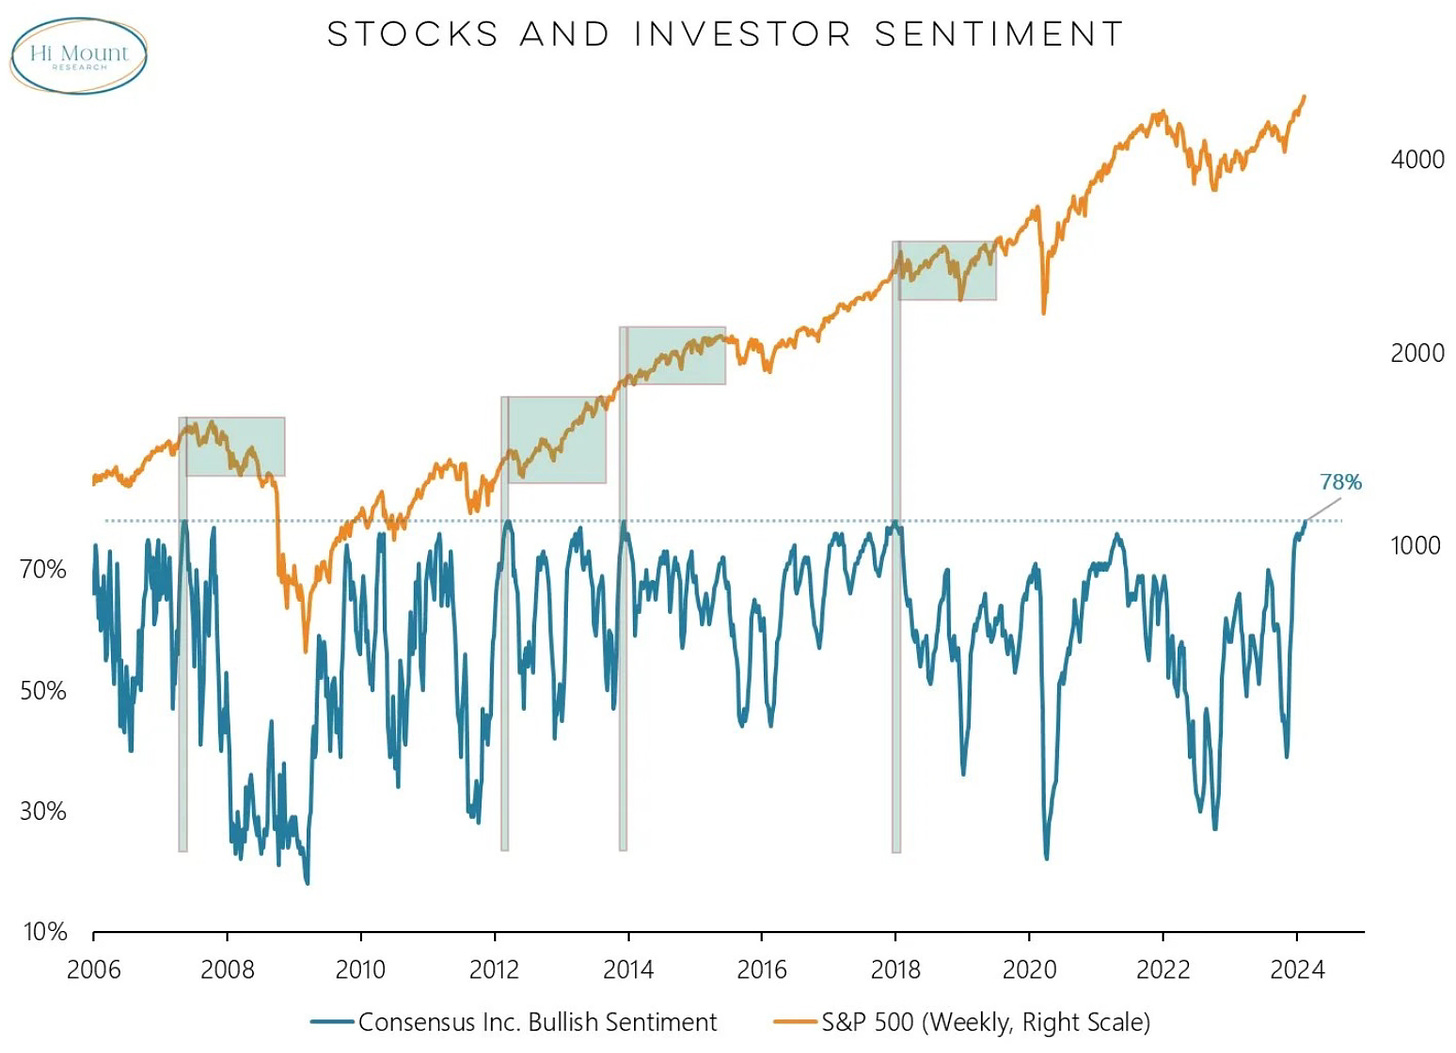
Sentiment continues to remain very strong. Consensus bullish sentiment matches the highest level in 20 years.
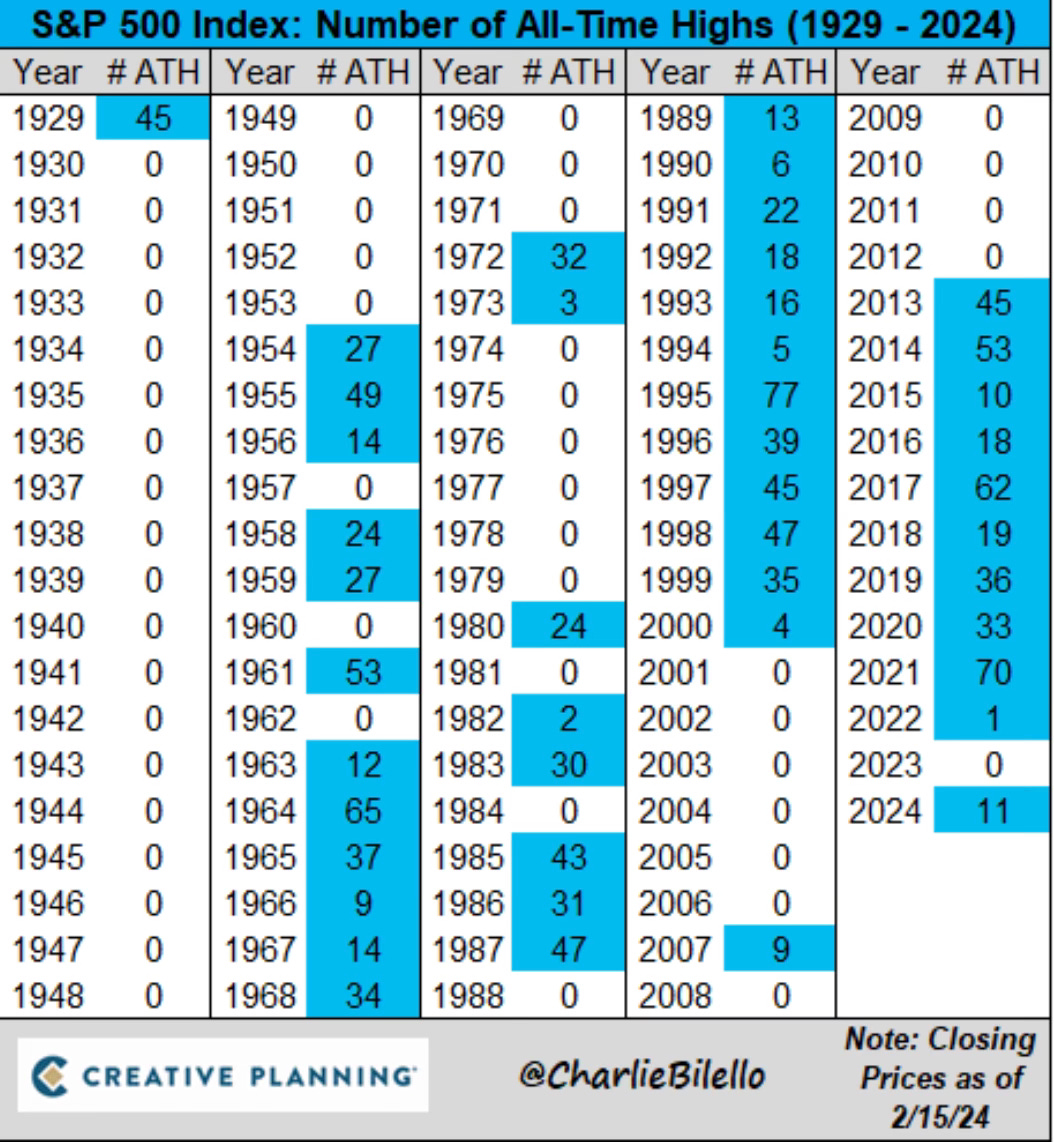
Each week we see more new all-time highs. After only seeing one all-time high in 2022 and 2023, there have already been 11 new all-time highs in 2024. And we’re only 7 weeks into the year!
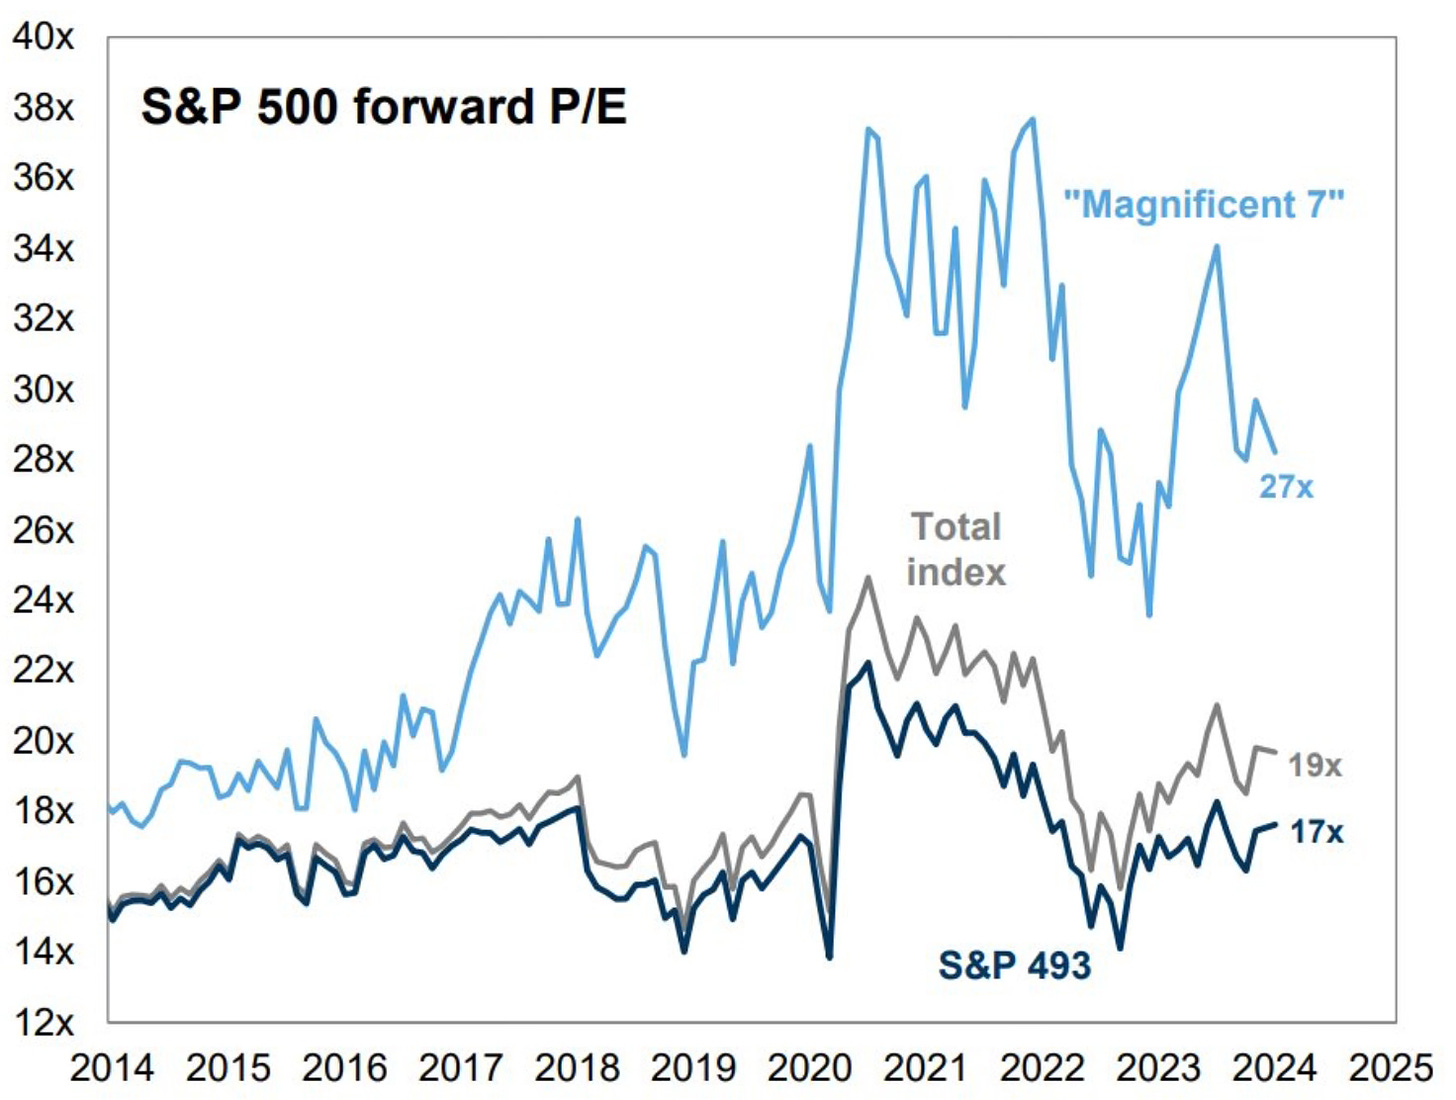
It’s hard not to believe in further gains when you look at the historical S&P 500 forward P/Es. The measures of the Mag 7, S&P 493 and the total index do not look overly expensive at all.
A Look At Job Cuts
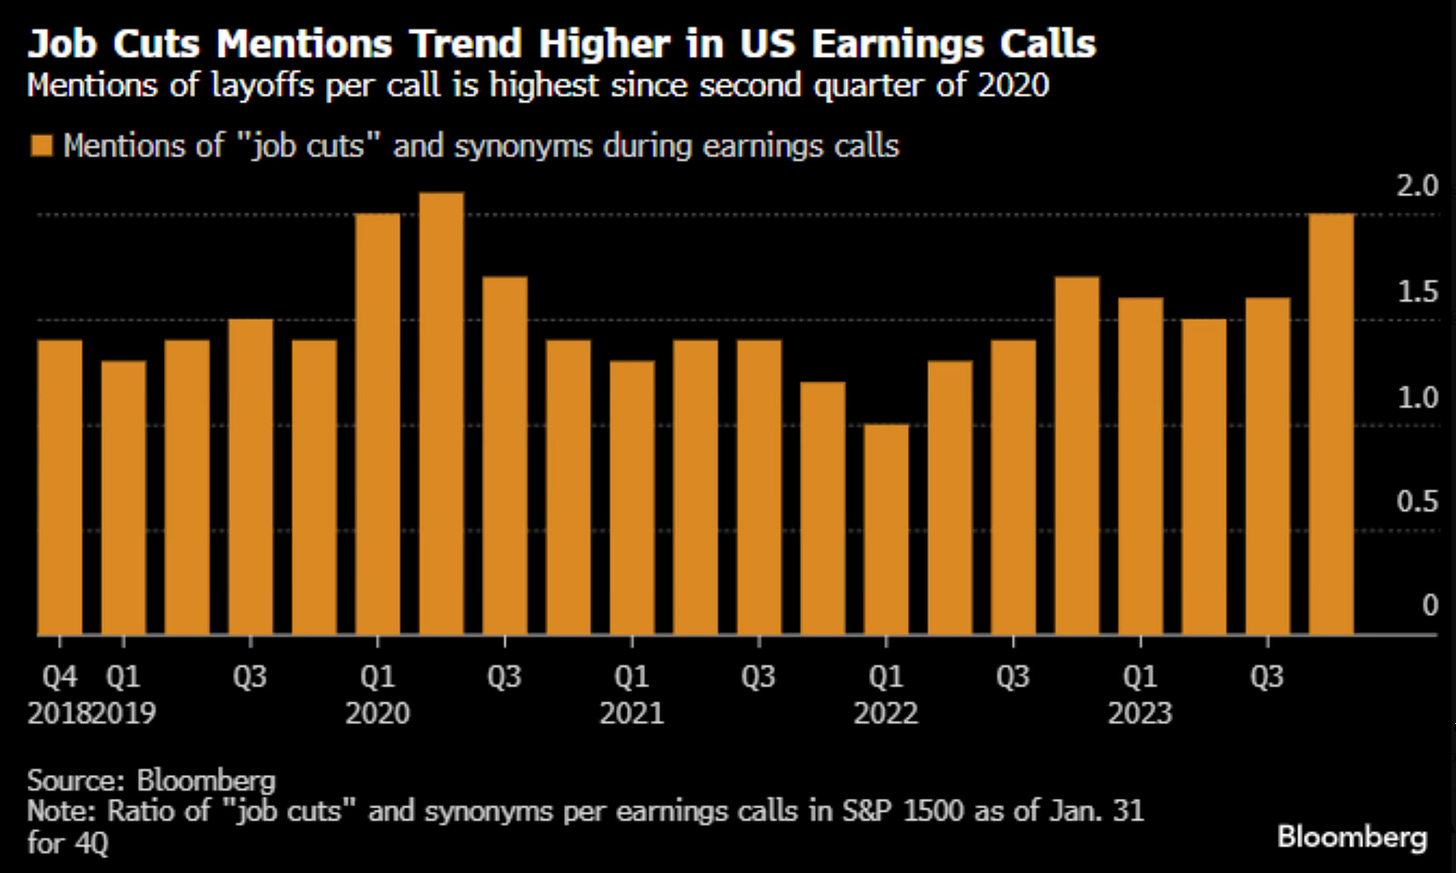
We’ve been hearing about job cuts in the news to start 2024. The mentions of job cuts on earnings calls have been up 100% from Q1 2022. This has intensified the calls for an economic breakdown and that a recession could still be looming.
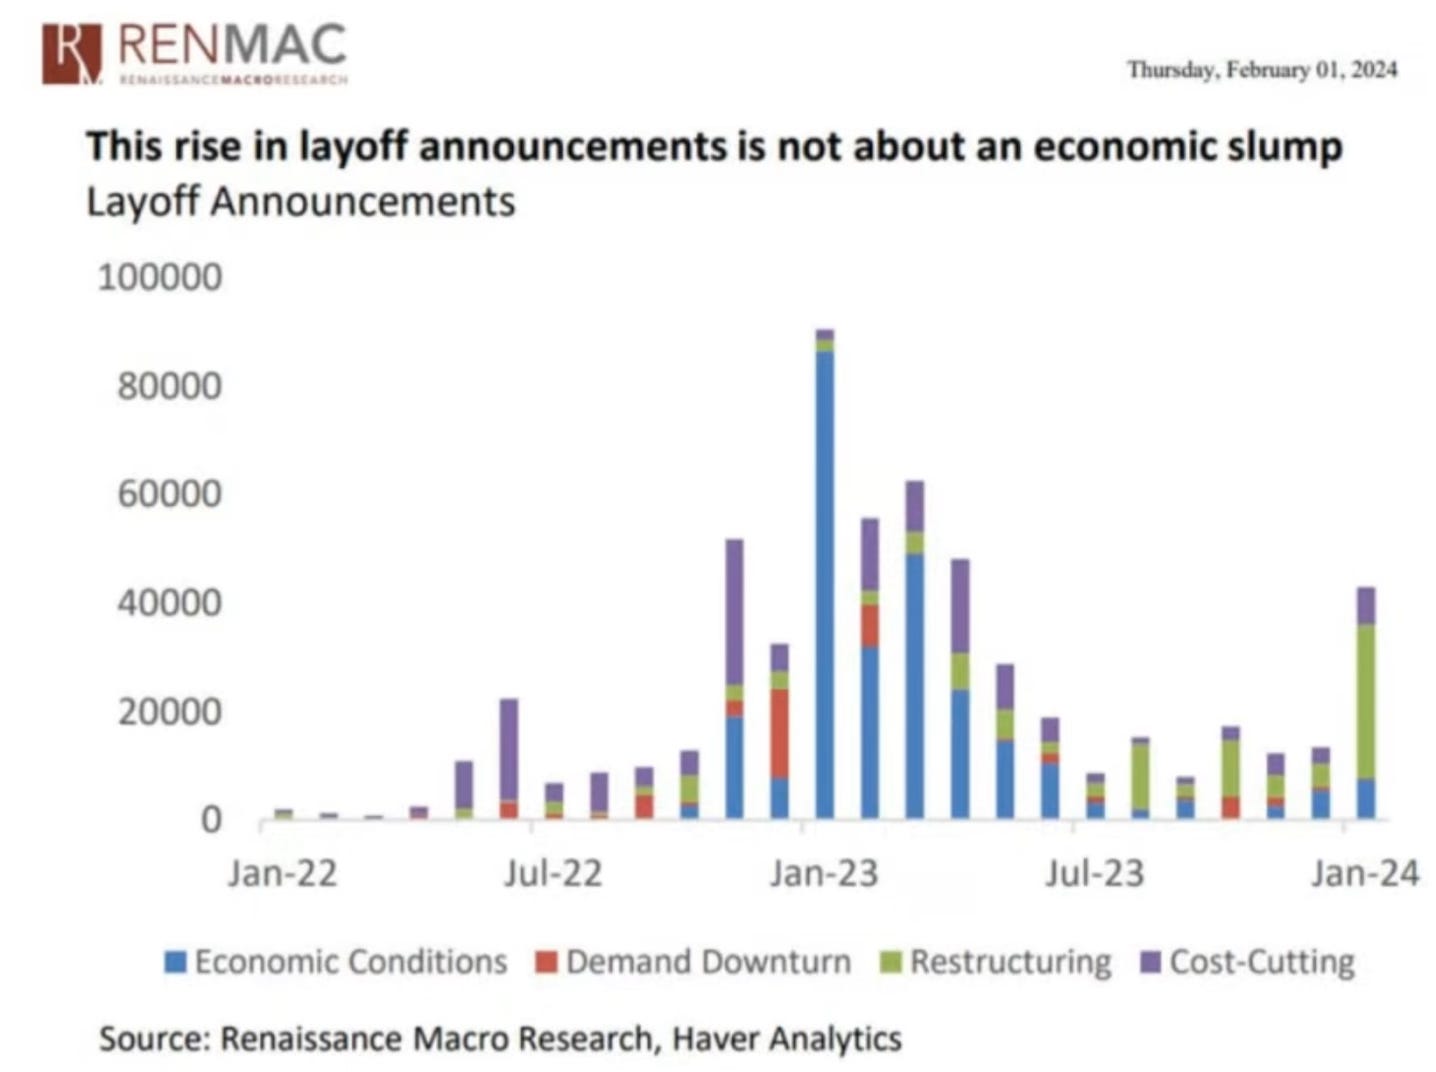
The reasons for job cuts was spelled out by Neil Dutta who shows in this chart that the rise in layoffs isn’t about an economic slump. It’s about restructuring and cost cutting. You can see the earlier layoff periods where it was due to economic conditions. This time it isn’t about that. At least not yet.
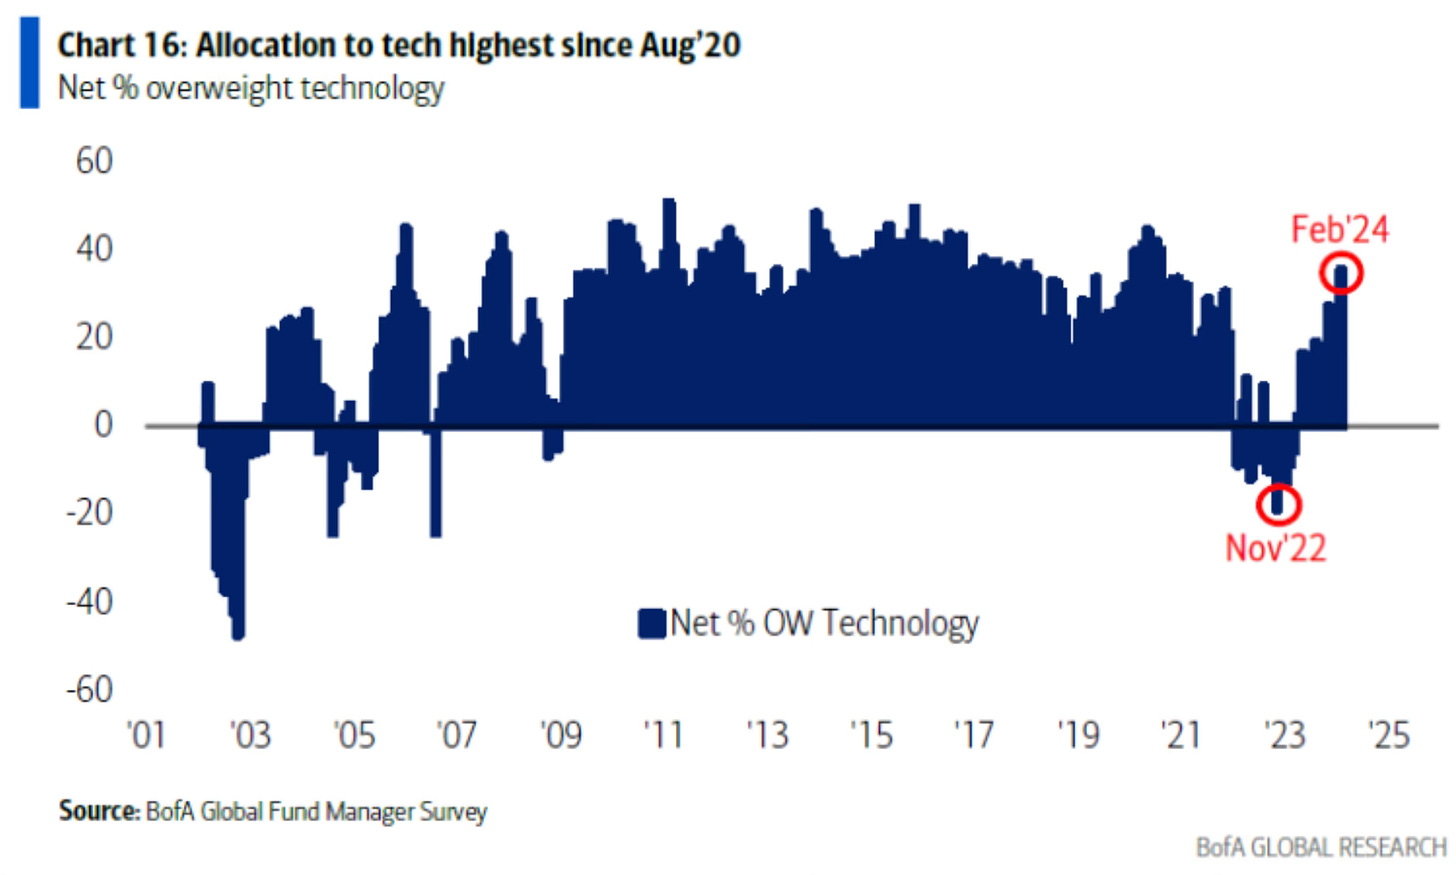
All In On Technology Stocks
The love for technology stocks just continues to rise. The allocation to tech stocks is the highest since August 2020. We’re seeing the crowd all moving into tech now.
This also includes hedge funds. They’re also reaching allocation level highs.
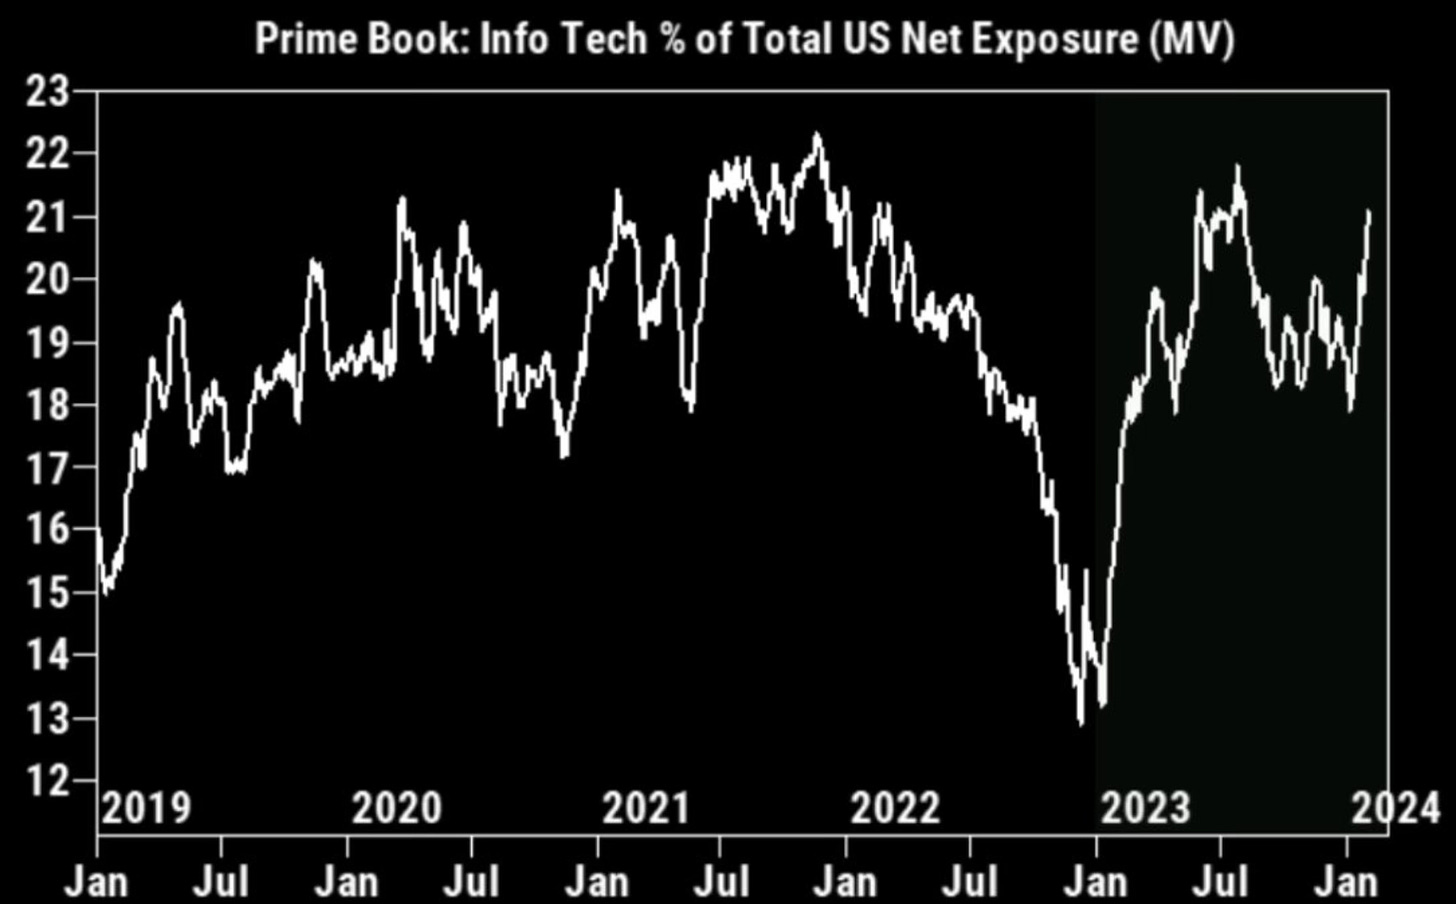
The boat is getting crowded. When this happens it’s usually a sign that you want to start getting on the opposite of the boat. Following consensus and going with the crowd isn’t usually a winning strategy.
Strength Or Weakness?
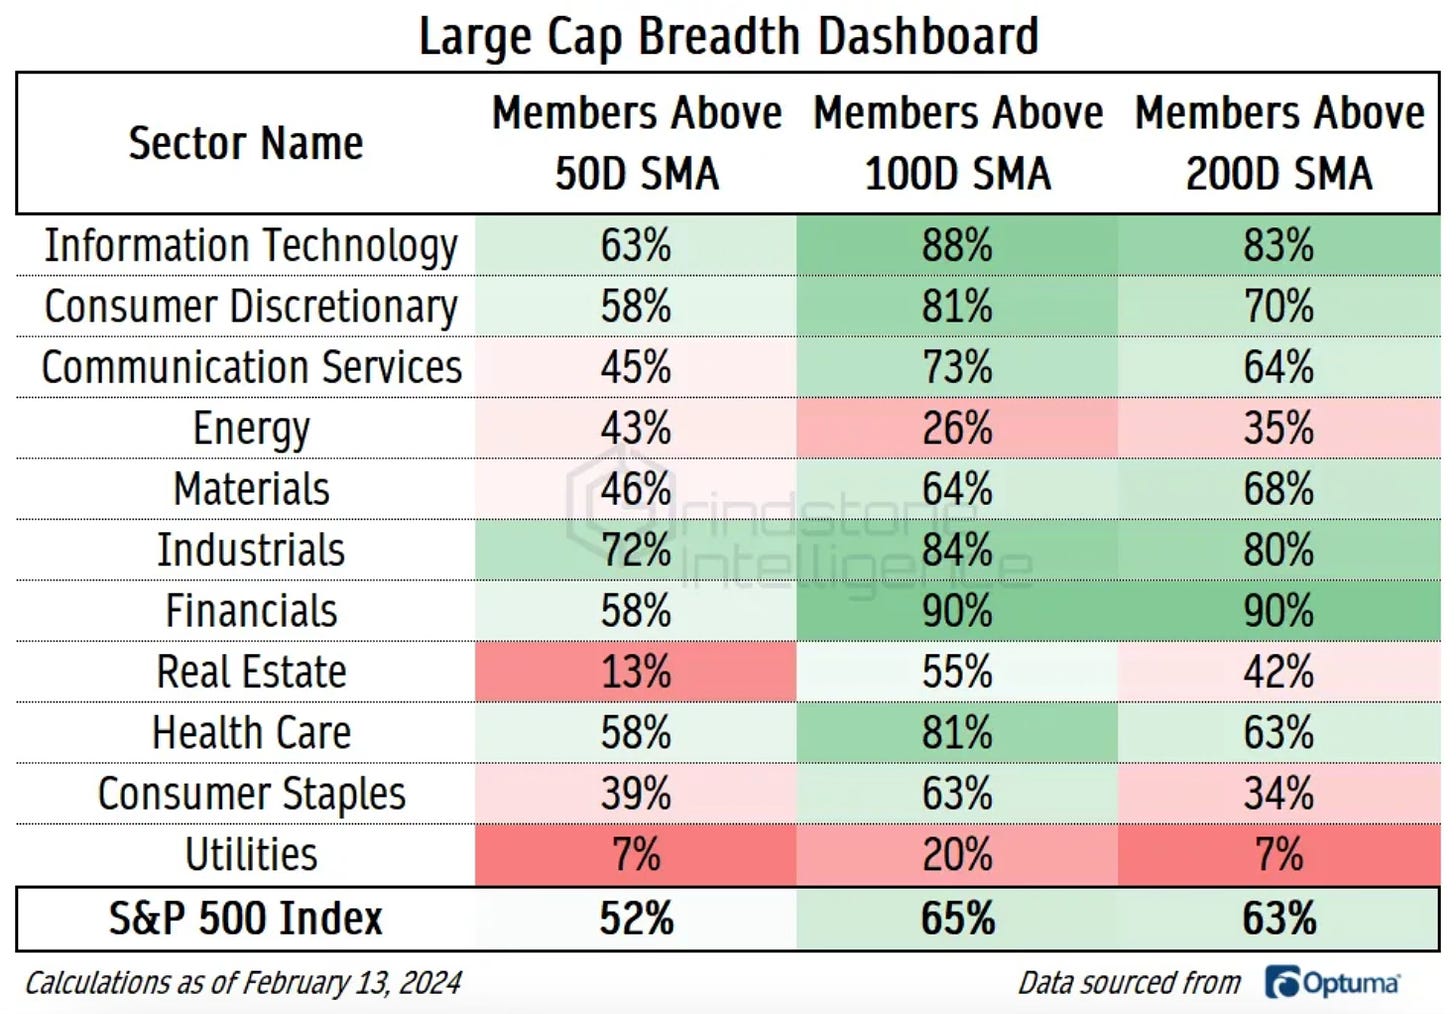
There are both positives and negatives to where breadth is at. The risk-on areas are still strong. The long range trends are in still intact. The surprise to me is the strength that is coming from industrials. A good chart from
.
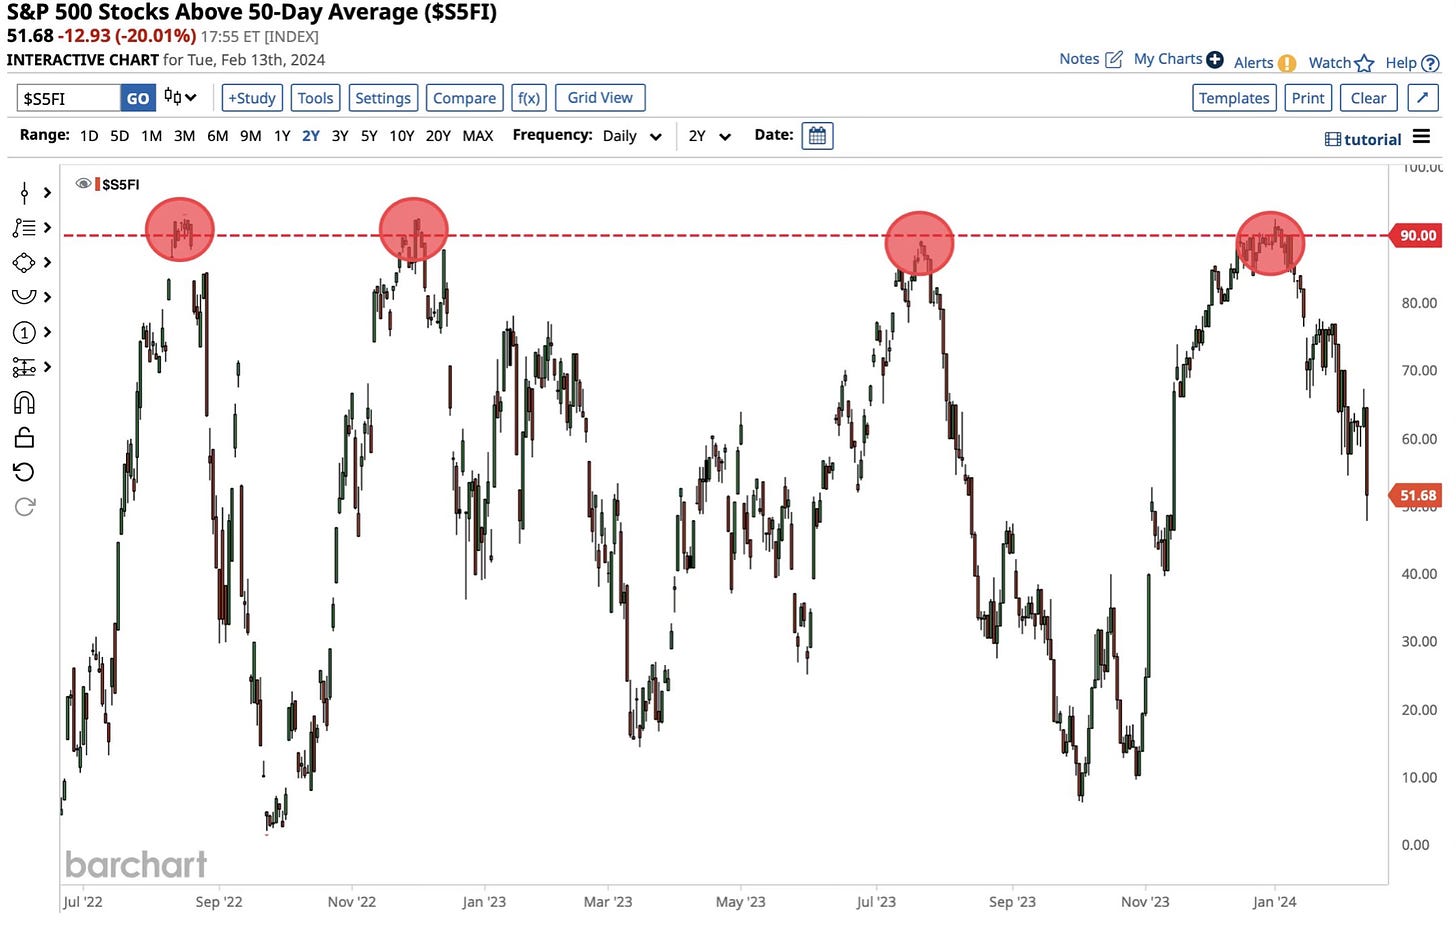
With only 52% of stocks in the S&P 500 trading above their 50-day MA, the trend is pointing lower. The ceiling looks to be 90% and then it bounce down off those levels usually signaling a path lower.
Apple Breaking Down?
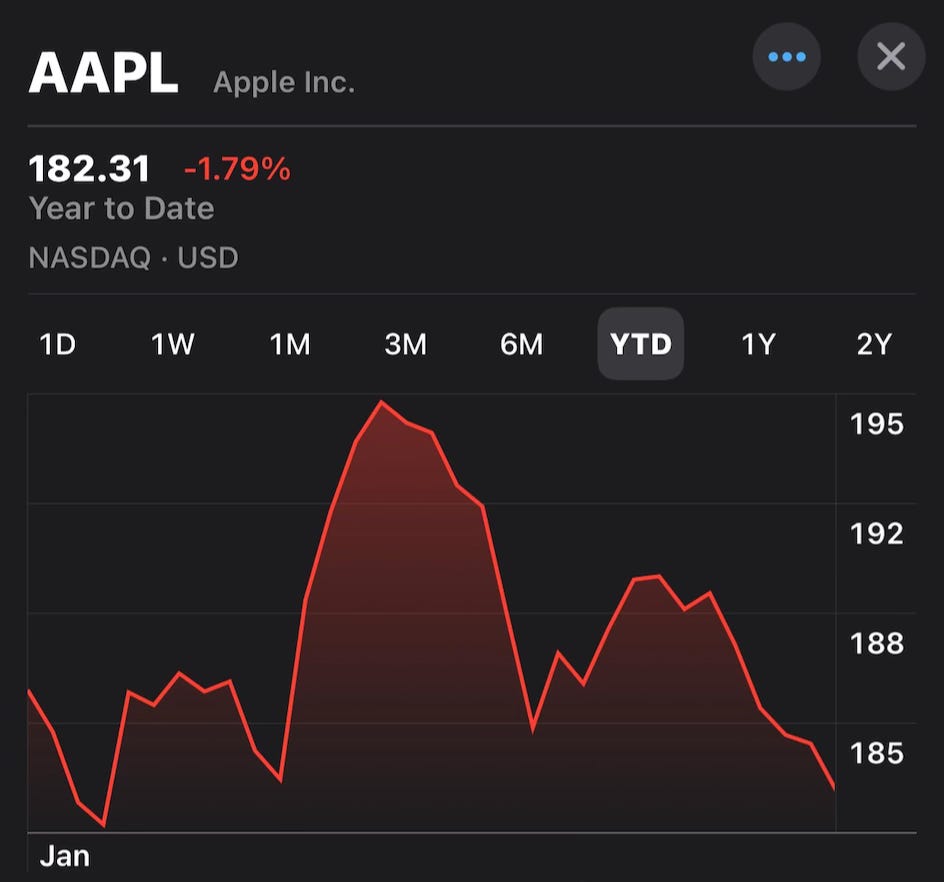
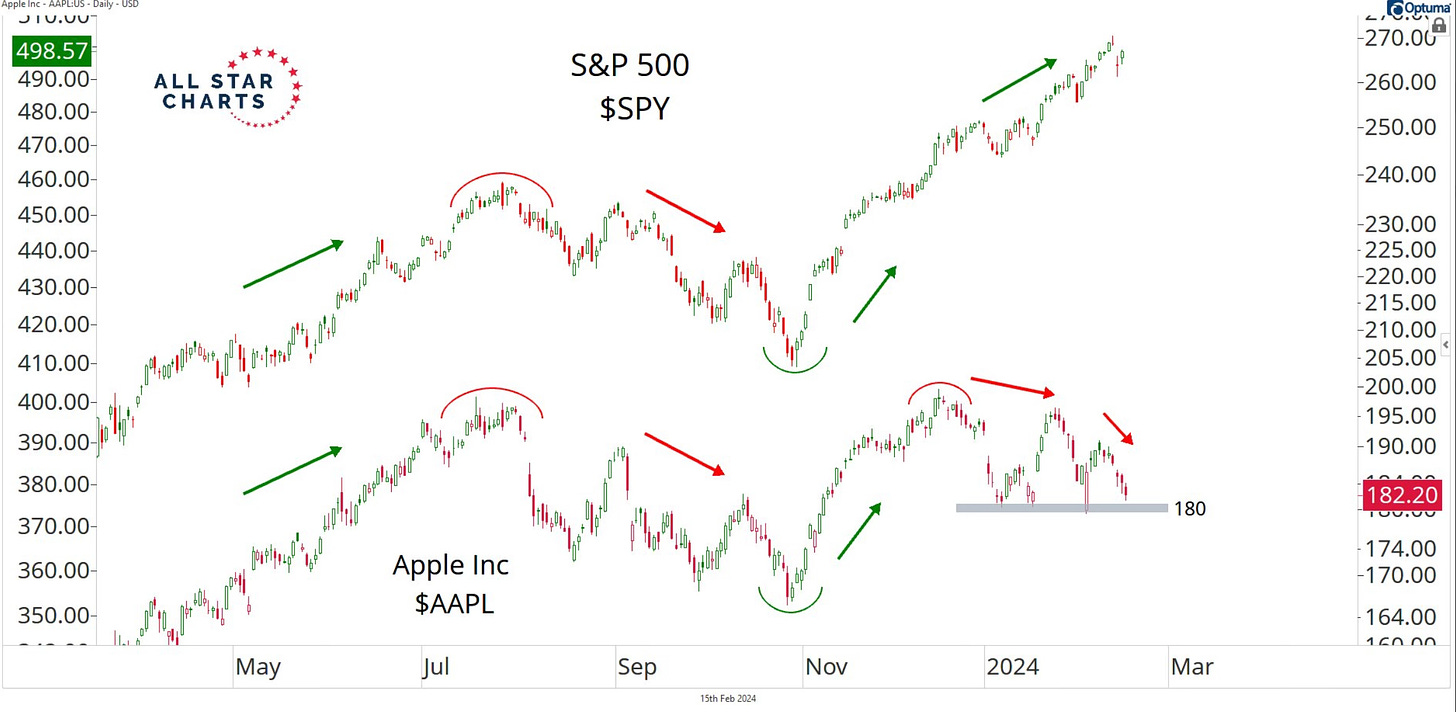
As I was reviewing stocks that I watch, one name that surprised me is Apple. YTD it’s actually -1.79%. It also closed the week below its 200-day moving average.
That caused me to do more work on it. For years many have said Apple is the key to the market. I believe in this current market cycle it’s Nvidia followed by Apple.
Apple relative to the S&P 500 does not look good. A textbook head and shoulders pattern is showing.
The same can be said with Apple against the Nasdaq.
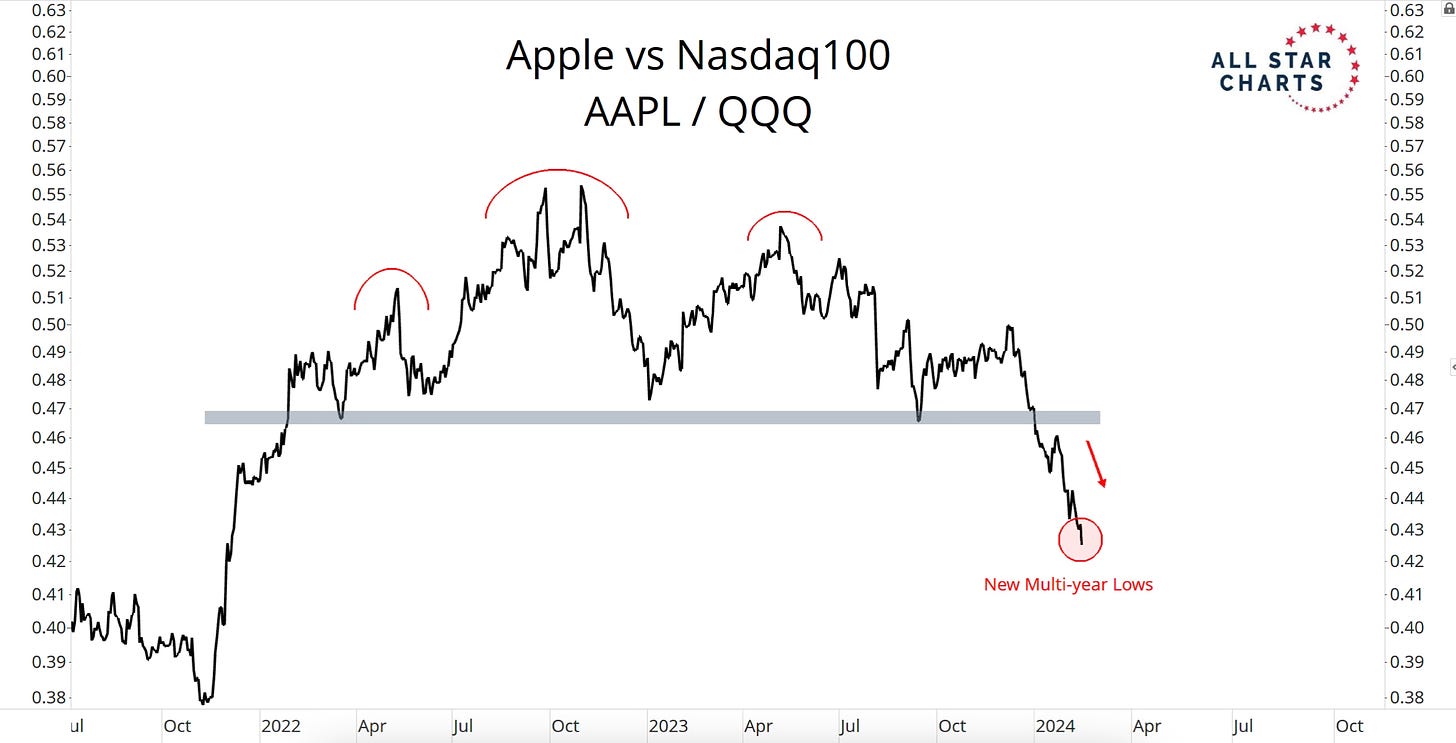
Seeing this clear of divergence from Apple does give a bit to think about and wonder what could be ahead for the broader market.
What Flows Are Telling Us
Watching where flows are moving is one way to see what areas of the market are seeing strength and what areas are seeing weakness. This is where I like to monitor trends or identify shifts under the surface which can paint a picture where the overall stock market, sectors and certain stocks may move in the shorter term.
I’ve talked a lot about money having to come into the stock market to play catchup. Investors had long been underweight stocks. Money almost had to come into stocks and it has. Allocation to stocks is now the highest since November 2021.
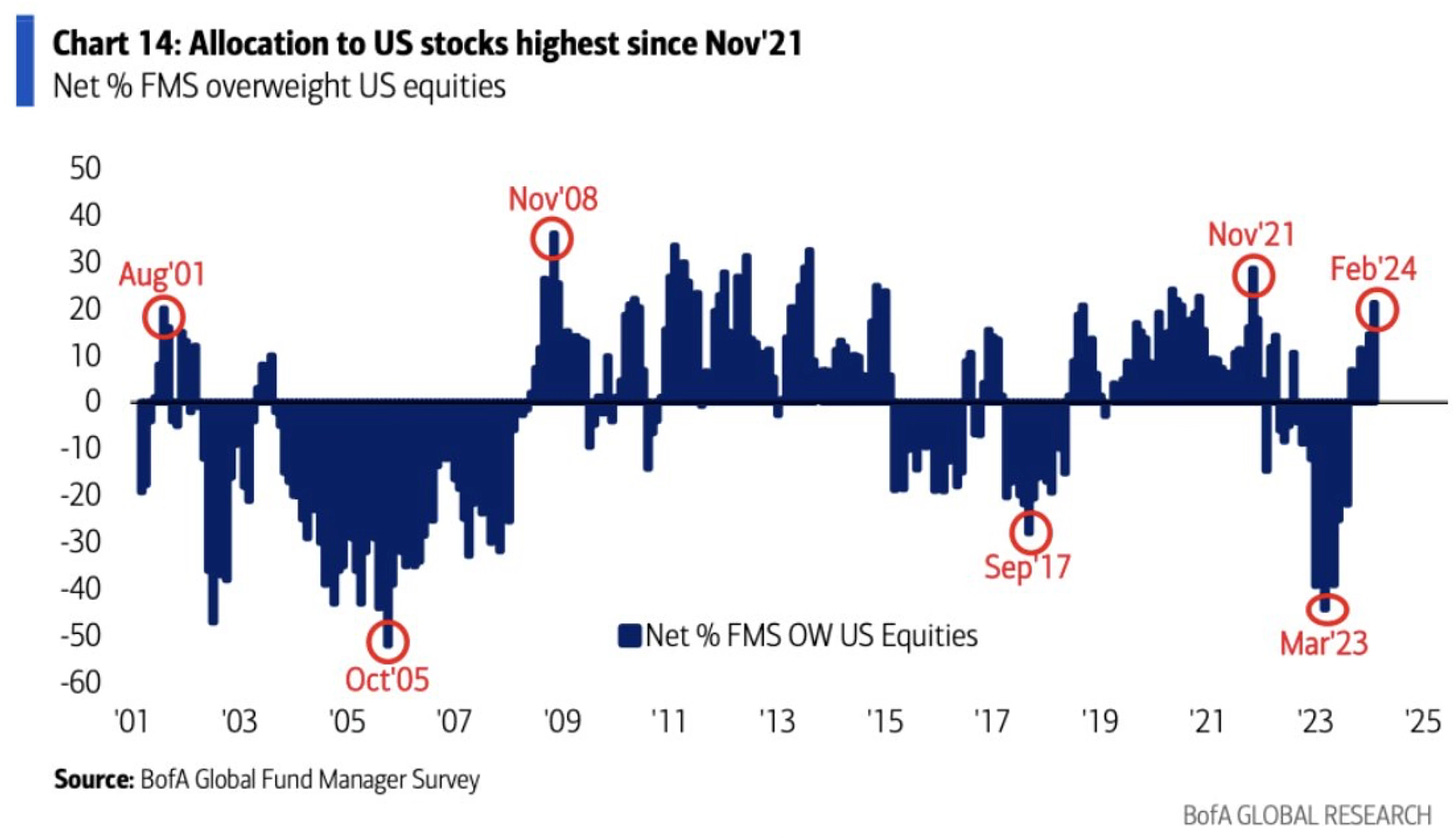
I’ve also talked about cash levels being high and that money is what would find its way into stocks. That’s exactly what looks to have happened. Investors have reduced their cash levels to 4.2%. That number has been reduced quickly. It’s now approaching the sell level signal of 4%.
You can read where I have talked about cash levels eventually finding their way into the market in Investing Update: 2023 Recap & 2024 Outlook & The Mountain of Cash.

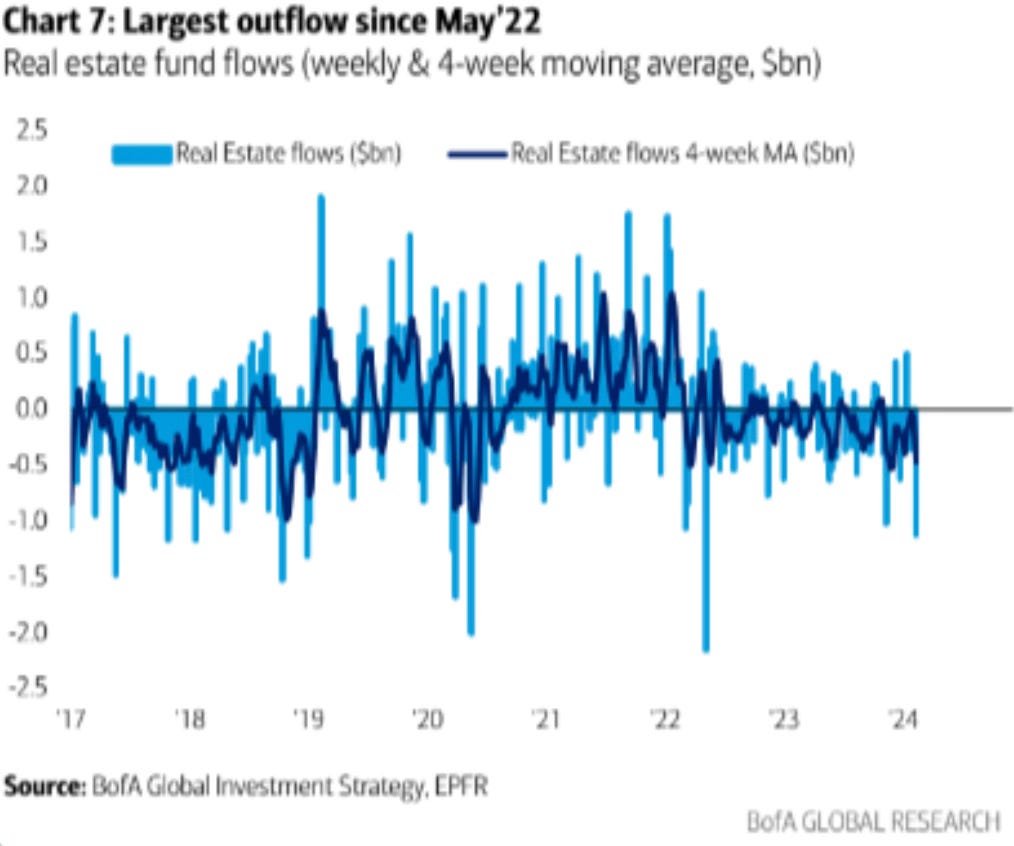
The renewed worries over commercial real estate may have spooked some investors to rotate out of real estate funds. They’re now seeing the largest outflows since May 2022. Those are bigger outflows than during the SVB and Signature Bank failures of last year. This big of outflows really makes me wonder a bit.
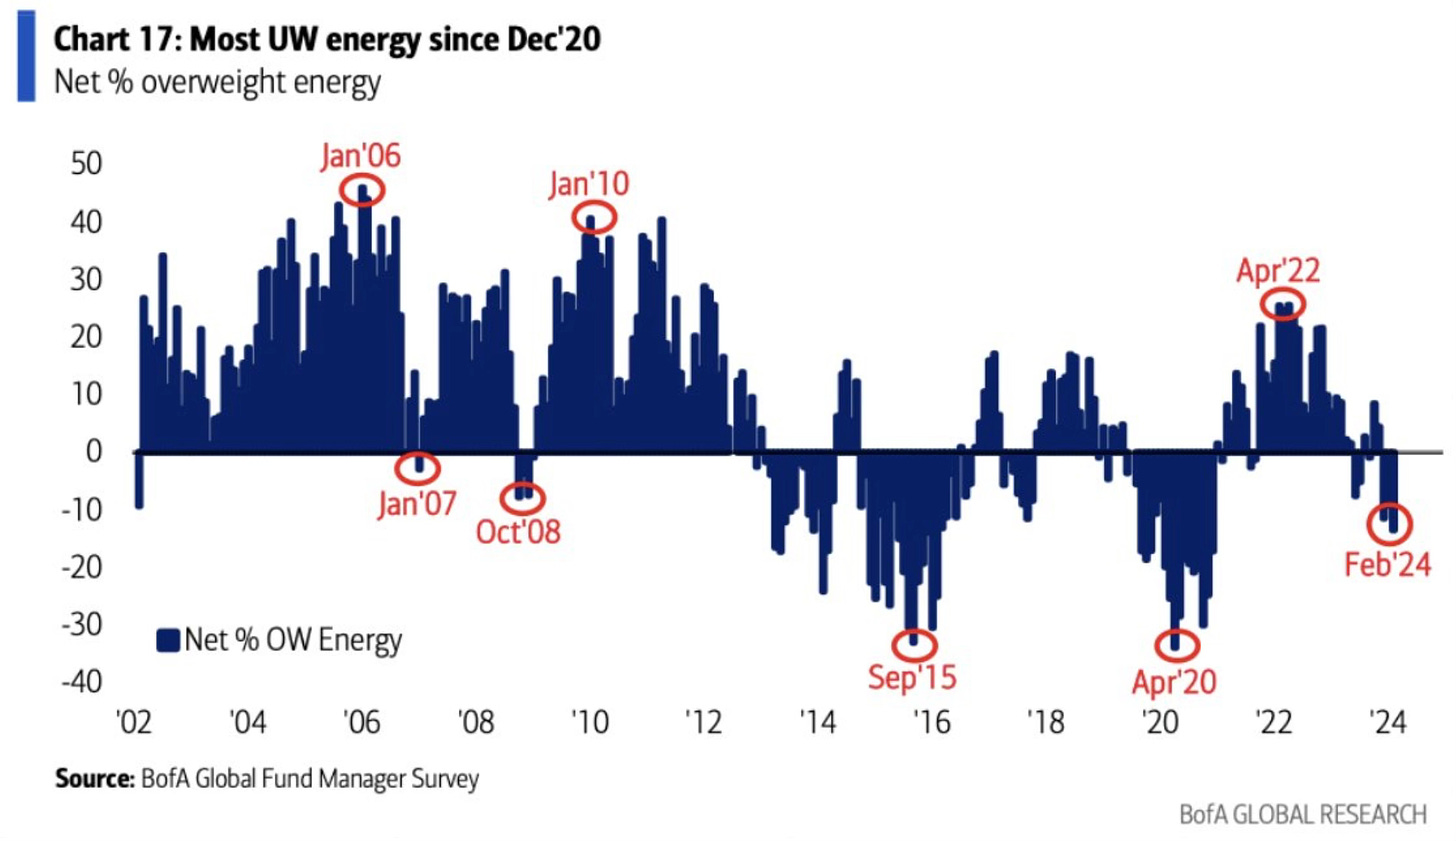
Another sector that can’t get going is energy. We now see energy the most underweight since December 2020. This is becoming a sector that may provide some opportunity.
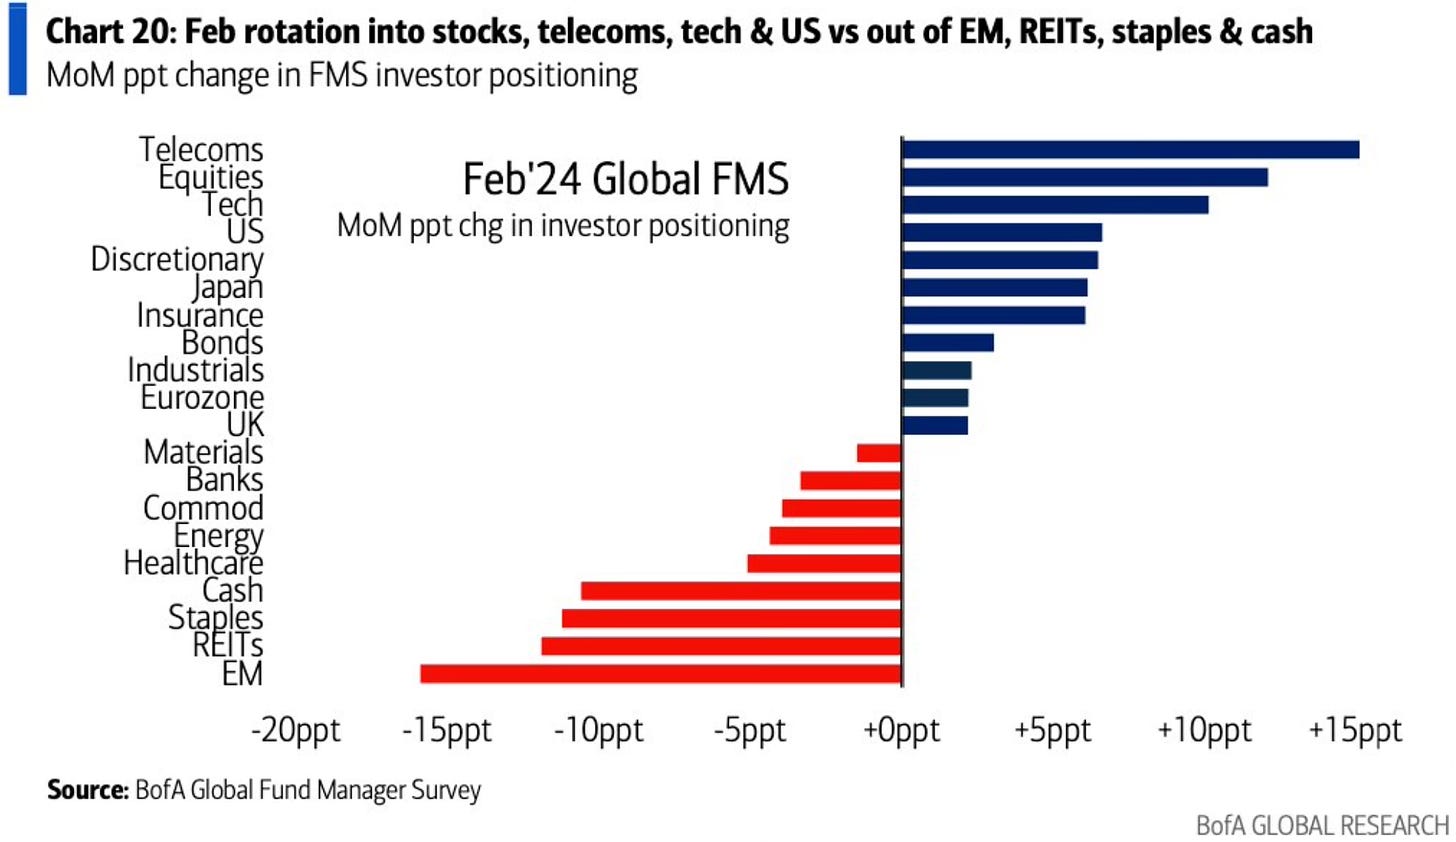
This takes us to where the current investor positioning is. Strength in US stocks which is mainly technology and weakness in the REITs, emerging markets, staples and cash.
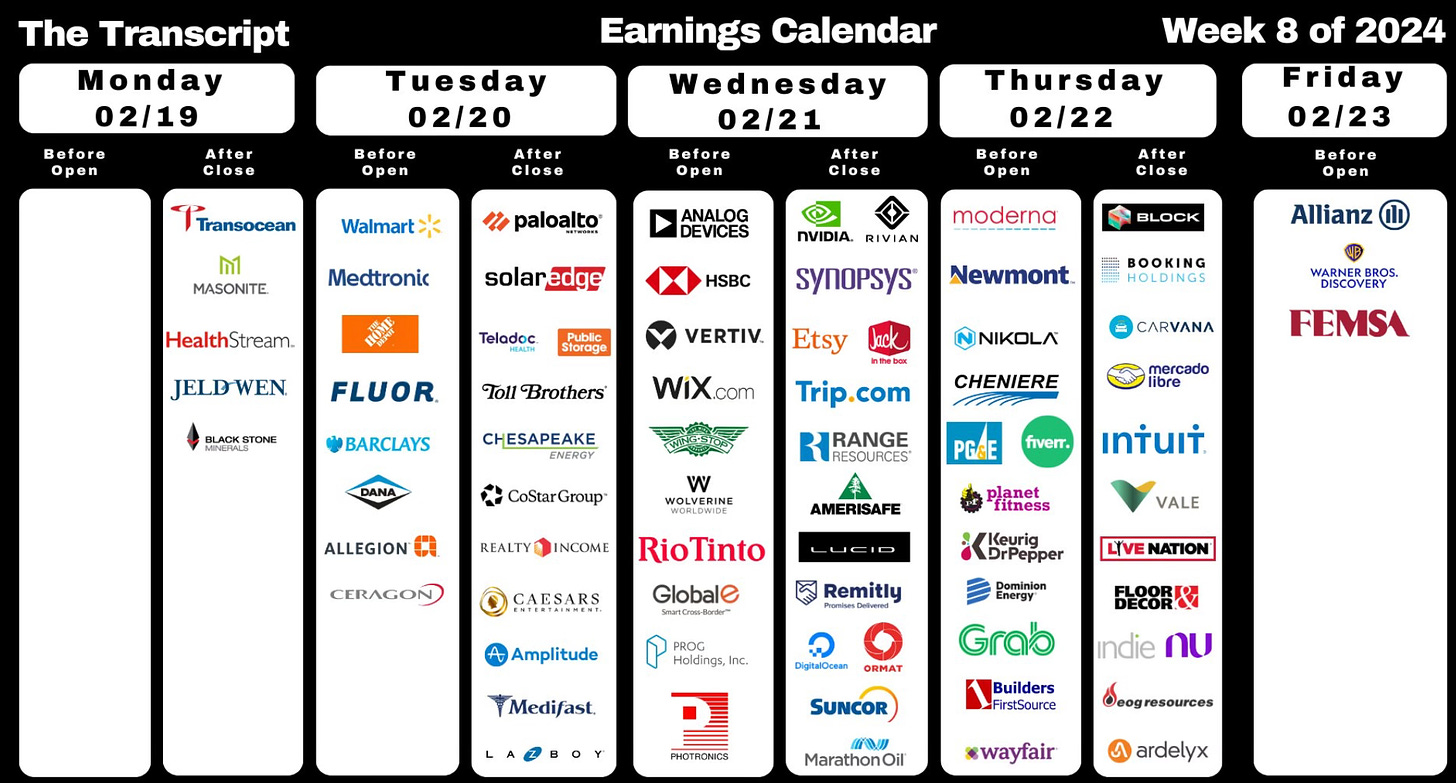
Upcoming Earnings
The Coffee Table ☕
I loved this article from my friend Sam Ro over at
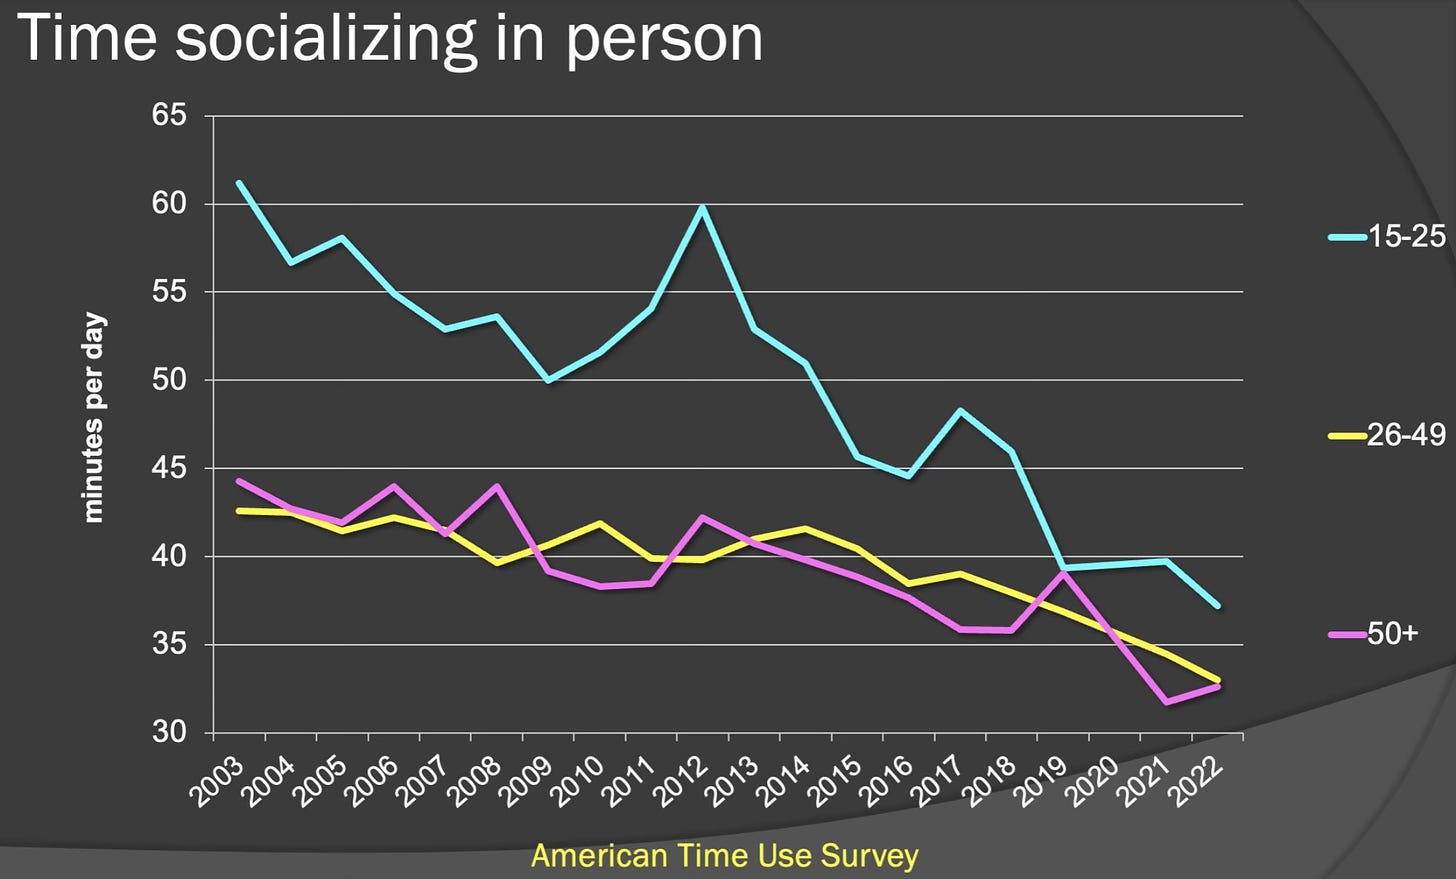
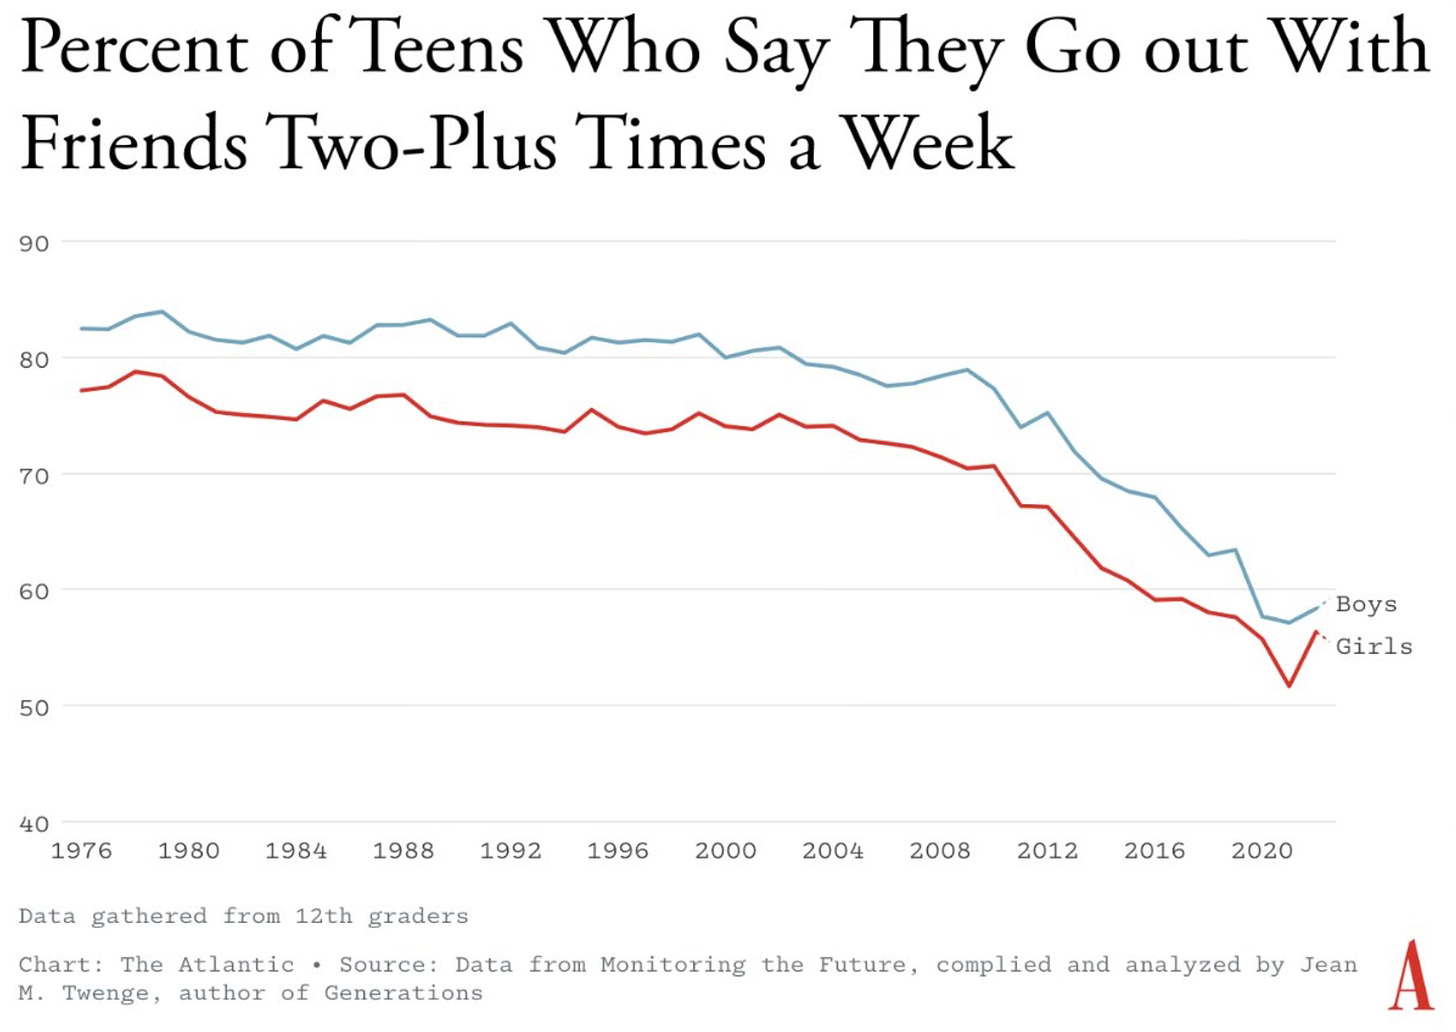
. 12 charts to consider with the stock market near record highs. This is something every investor should read as it speaks right to the environment we’re in and what may be ahead relative to what history tells us. He tells us that story through his charts and data.Ben Thompson wrote one of the best articles that I’ve read in a long time called, Why Americans Suddenly Stopped Hanging Out. It’s just a fascinating piece from one of the best writers. Here were two charts from his story that really stuck with me.
Thank you for reading! If you enjoyed Spilled Coffee, please subscribe.
Spilled Coffee grows through word of mouth. Please consider sharing this post with someone who might appreciate it.
Order my book, Two-Way Street below.


