Investing Update: Why Are Investors Scared?
What I'm buying, selling & watching
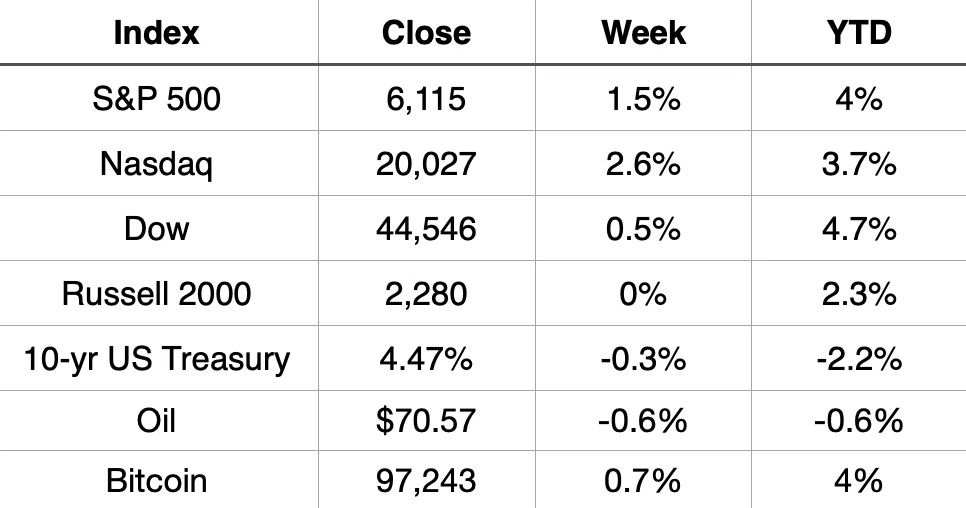
This week saw the S&P 500 bounce back finishing up 1.5%. The Nasdaq was up 2.6%. For 2025, the S&P 500 is now up 4% and the Nasdaq up 3.7%. The Dow actually leads the way so far in 2025, up 4.7%.
Market Recap
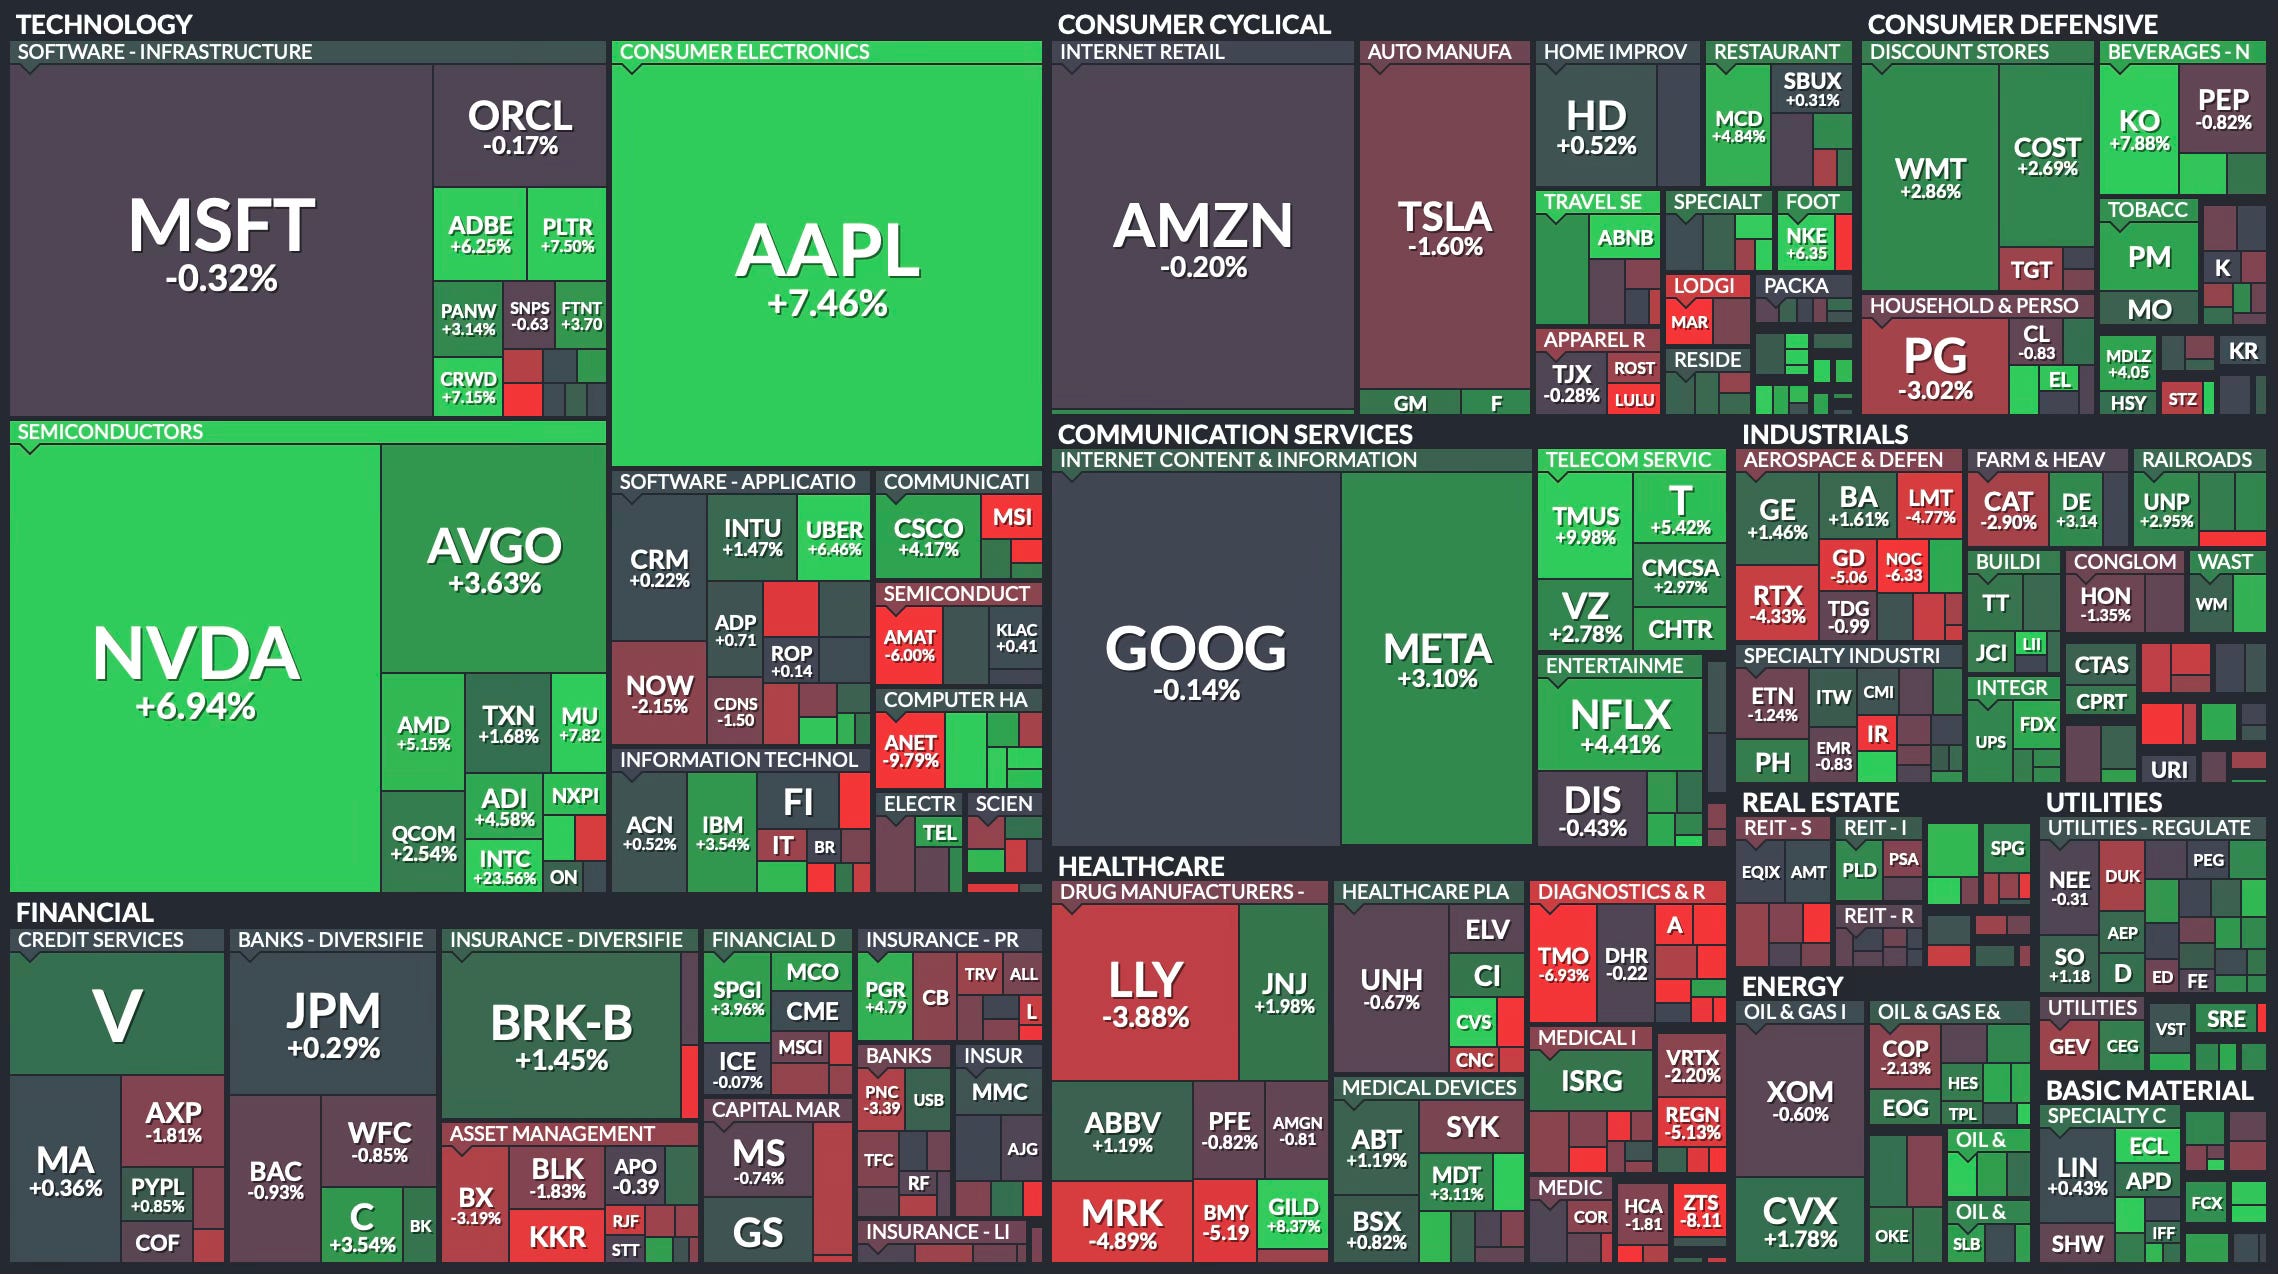
Weekly Heat Map Of Stocks
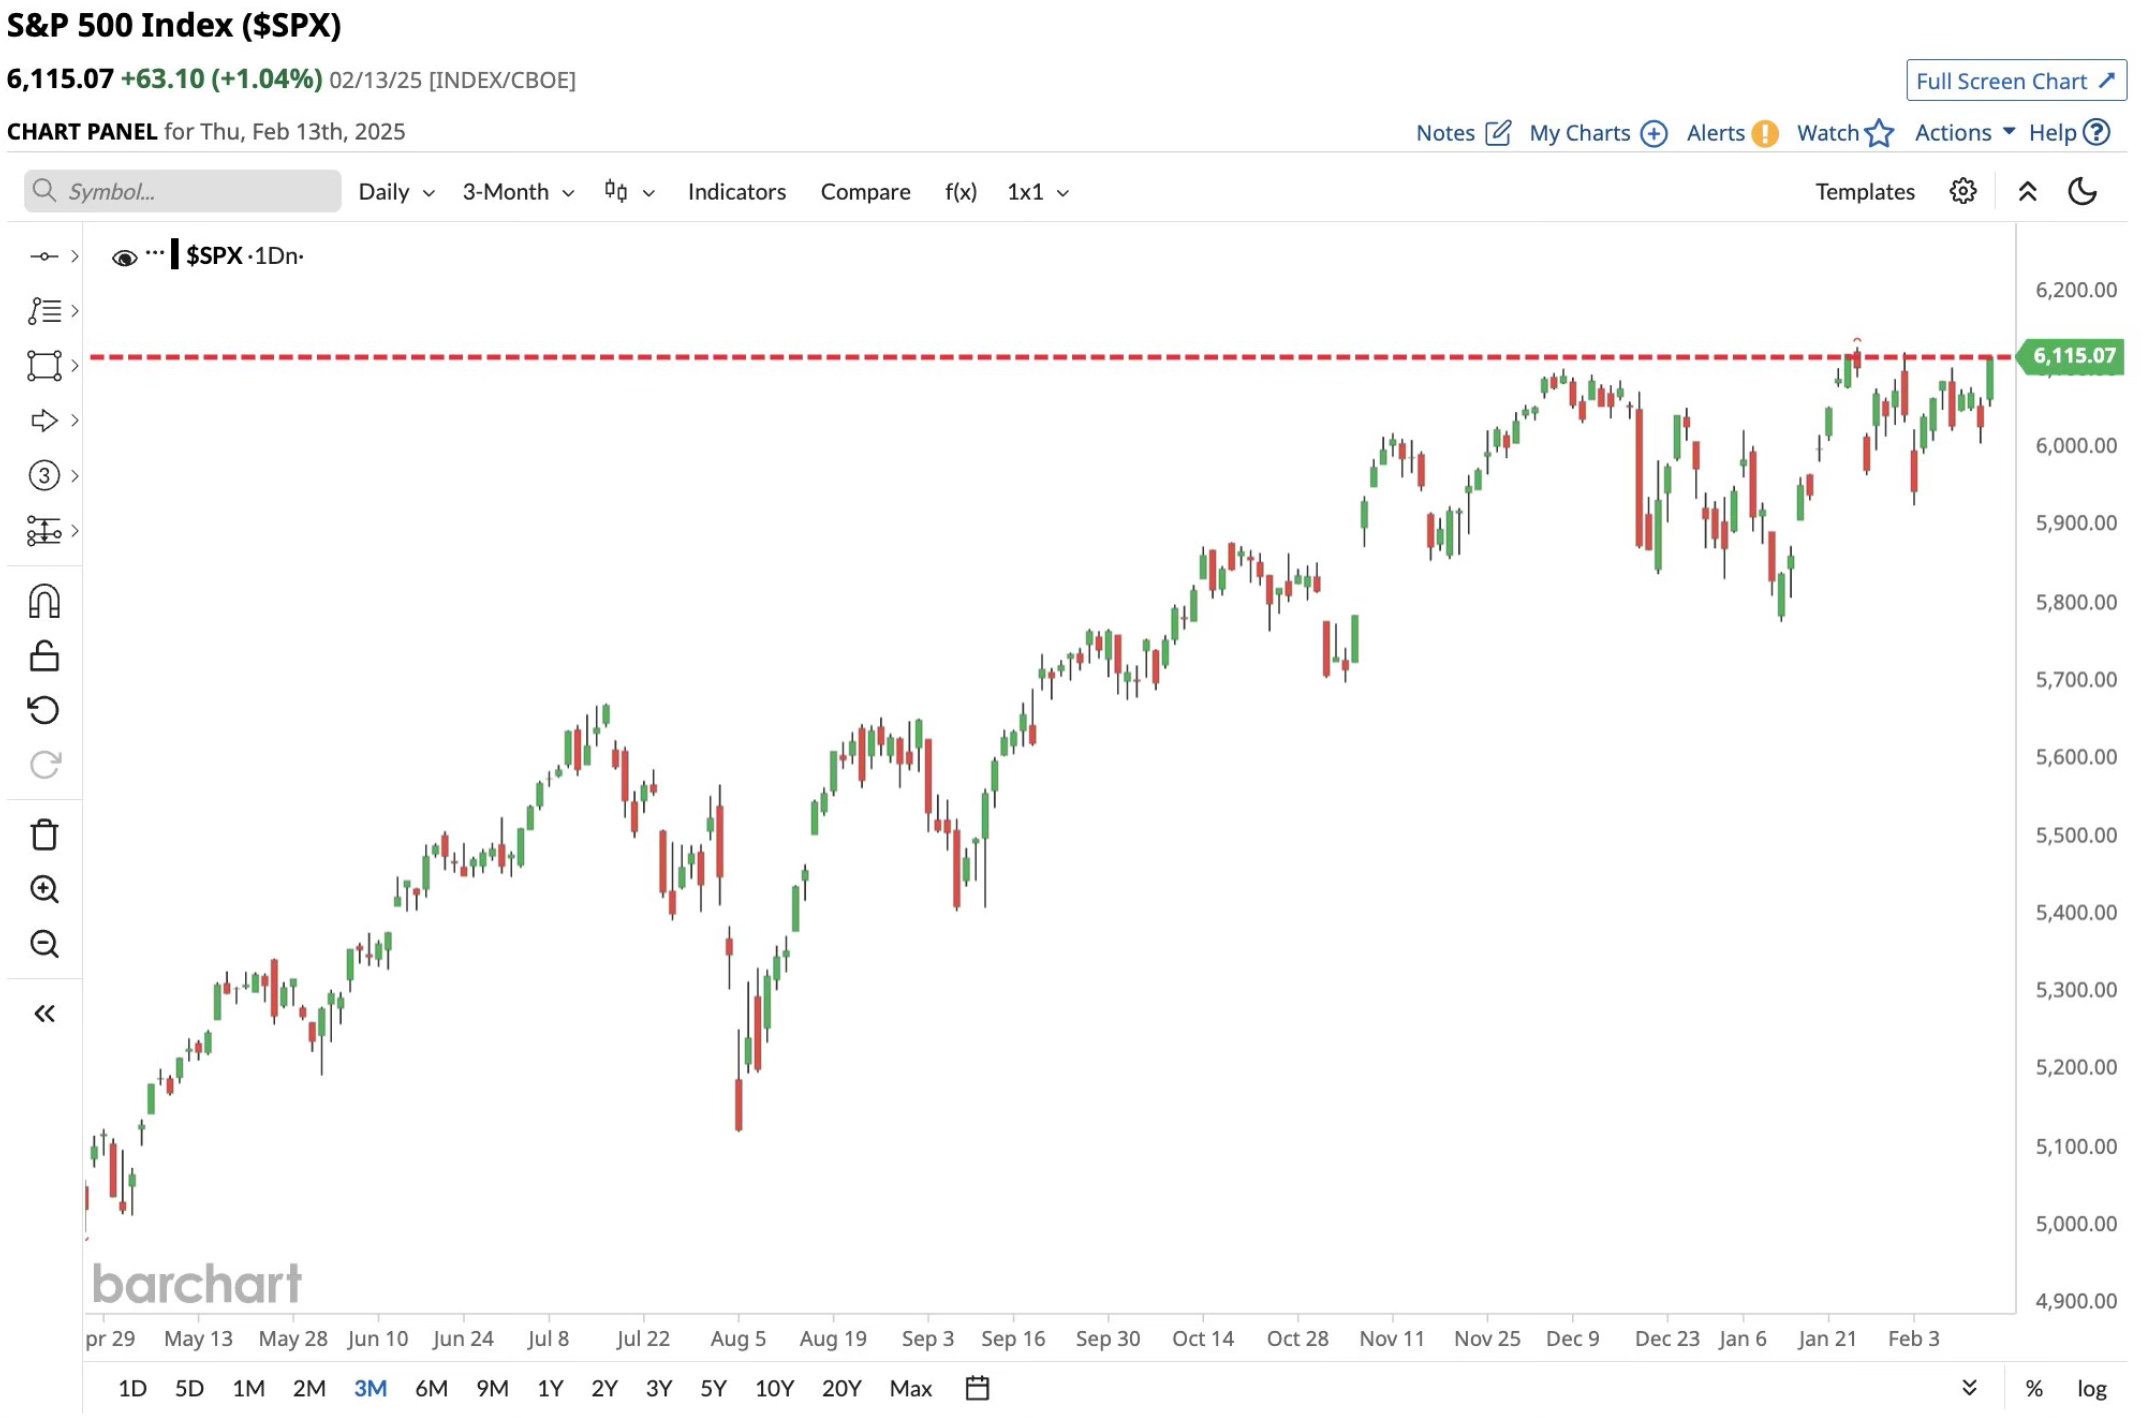
The S&P 500 actually stands only 0.5% below a new all-time high.
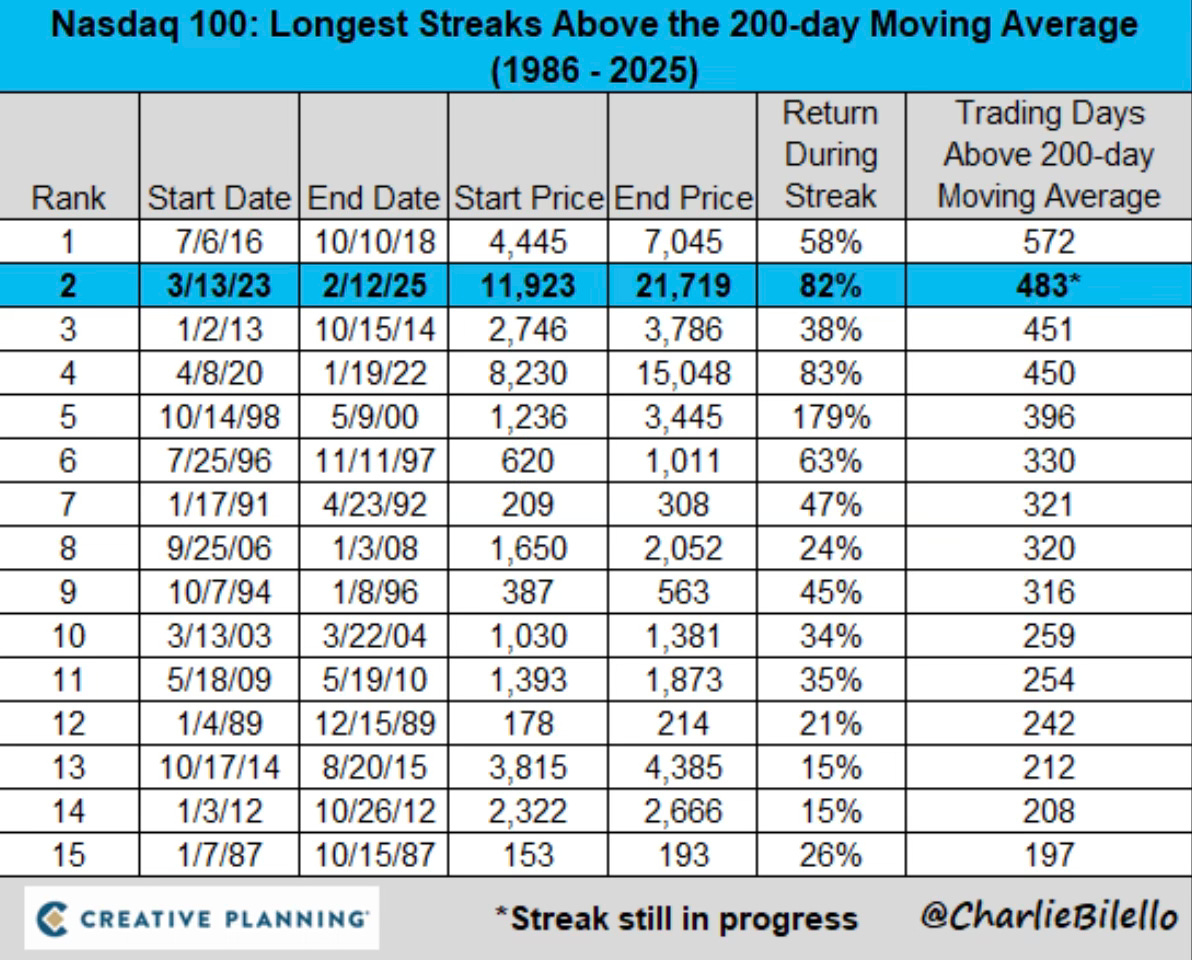
The Nasdaq continues to be on an all-time winning streak. It has now closed above the 200-day for 483 straight trading days. The second most in history.
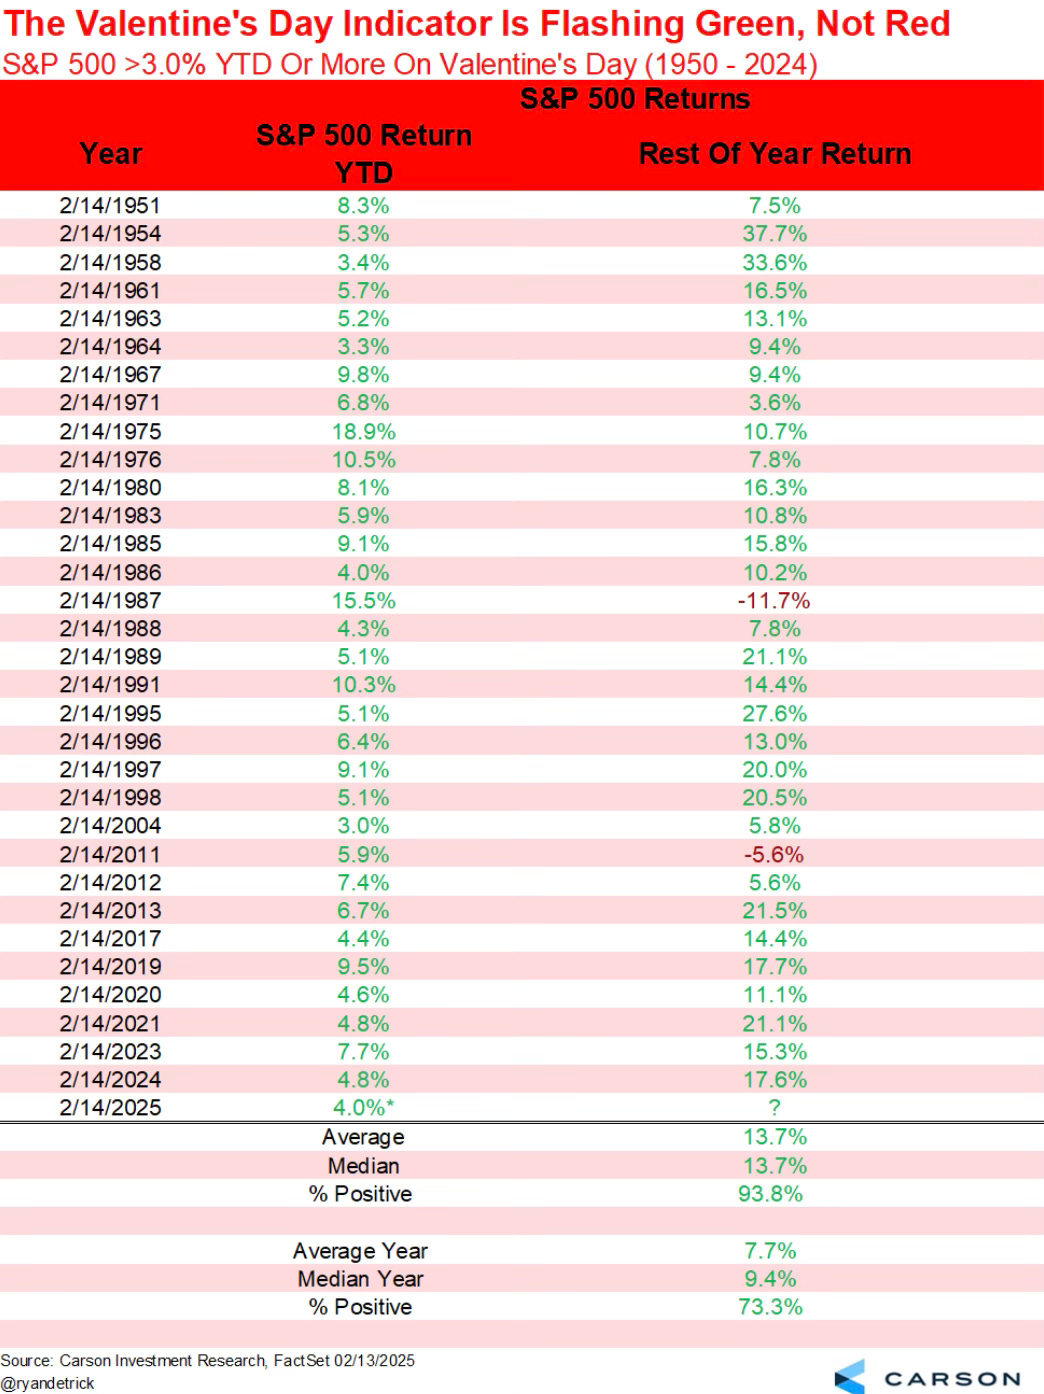
I love this Valentine’s Day themed chart from Ryan Detrick. He called it The Valentine’s Day Indicator.
It shows that when the S&P 500 is up 3% or more YTD on Valentine’s Day. Which it is. The 32 years since 1950 that this has happened, the S&P 500 was higher the rest of the year in 30 of those years. That’s 93.8% of the time.
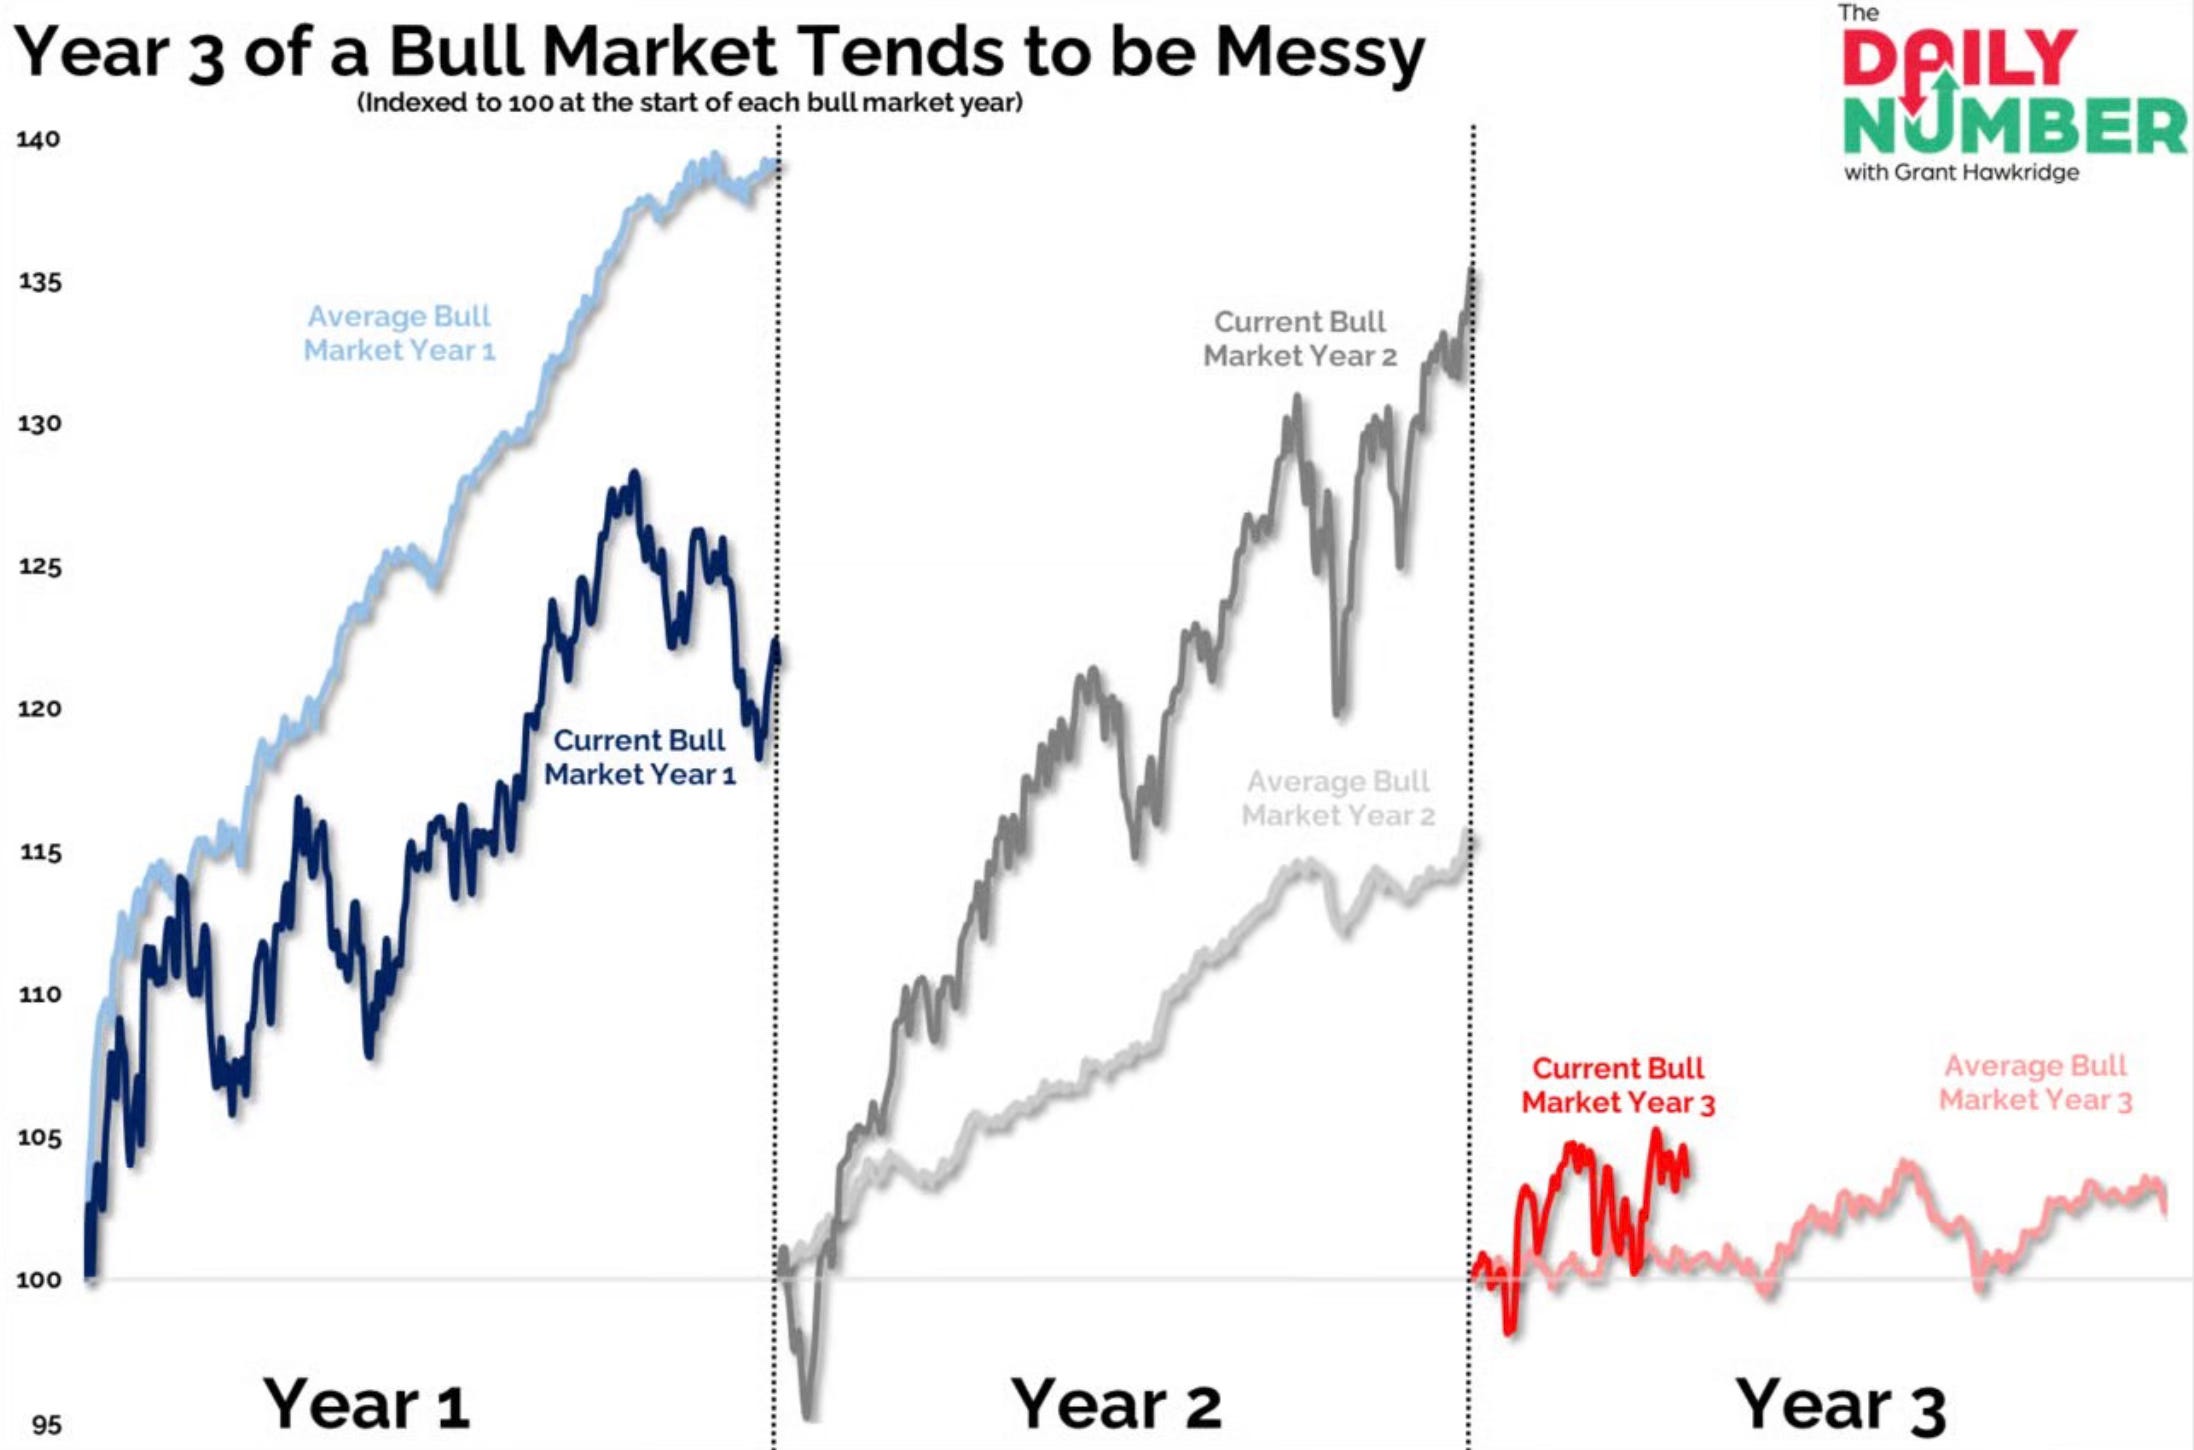
In comparing the average year 3 of a bull market to this current bull market, you can see this current bull market is performing well above the average.
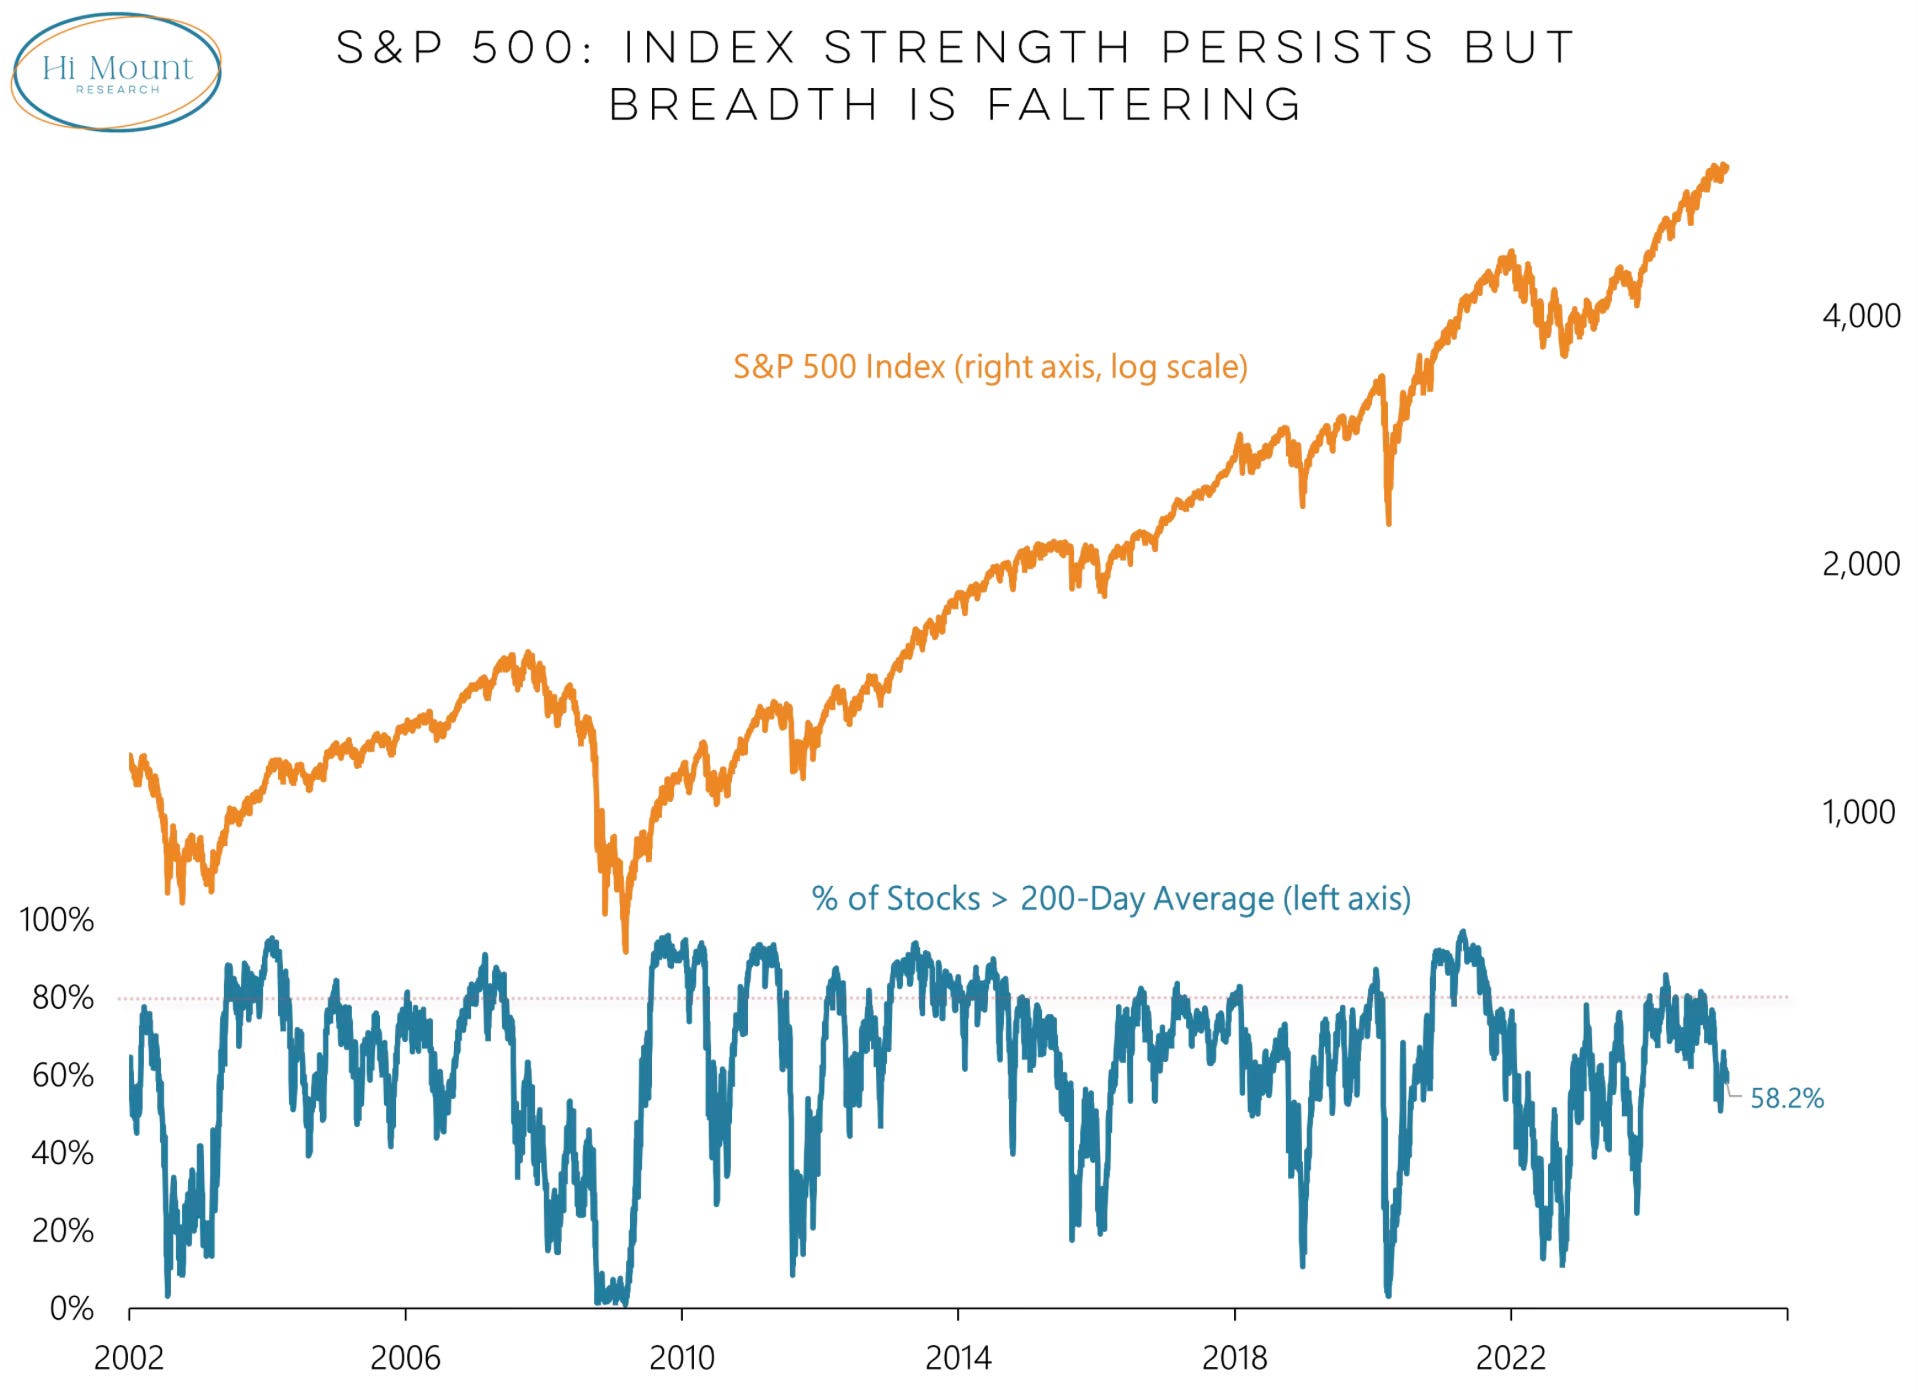
One surprising thing that I wasn’t aware of until Willie Delwiche pointed it out was the current breadth.
Even thought the S&P 500 is right at all-time highs, we’re seeing some under the hood struggles. More than 40% of stocks are not above their 200-day. This is something worth watching.