Reasons To Sell
They're always present and never go away
You don’t ever have to look very hard for reasons to sell stocks. They’re always present and never go away.
Have you watched any news? Fear sells. Good news gets lost. External events and bad news capture the headlines. Watching the news will give you instant reasons to want to sell.
Going off all the reasons to sell would cause you to never buy.
I took a look at some of the most common reasons people look to sell stocks due to overall market or macro events and if it makes sense to sell for those reasons.
There is bad news such as a crisis or event. I better sell. Not so.
This is a great chart of the S&P 500 showing the crisis and events since 1970. Meanwhile, during that time the average total annual return from 1970 to 2024 was 10.83%.

Stocks are starting to fall and it’s looking like a drawdown or pull back is happening. I think I should sell. Not so.
This chart shows that every year the S&P 500 experiences a drop. Going back to 1980 the average intra-year drop is 14.2%. Despite that, annual returns have been positive in 33 of 44 years. Volatility is a piece of investing, it’s perfectly normal and healthy.

There is a geopolitical risk or event happening that’s going to take down the market. I better sell. Not so.
Here is a chart of the S&P 500 back to 1928. There is always geopolitical risk. Whenever you’re reading this, there is in a likelihood some geopolitical risks and tensions currently happening. None of it has mattered over the long term.

They’re going to raise or lower interest rates. I better sell. Not so.
Here is the Dow going back to 1900. They’re have been many interest rate changes during this time. Over the long term, it hasn’t mattered.

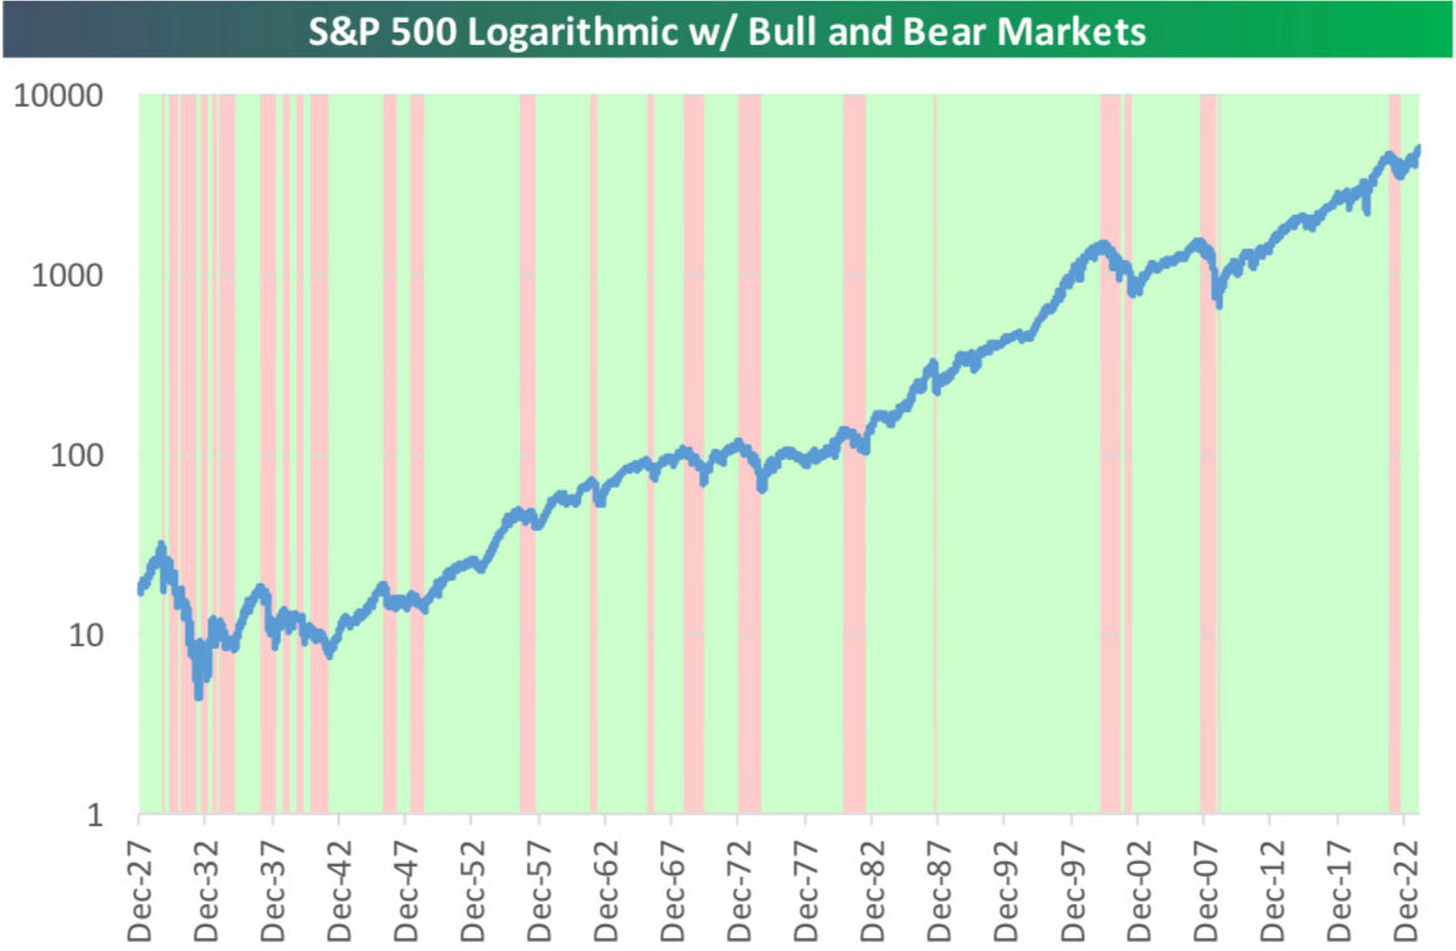
I think a bear market may be starting, I should sell. Not so.
This chart shows all the bear and bull markets since 1927. Notice the bear markets end and the stock market continues to move even higher.
Plus, when do you know the right time to sell is and when to get back in? You don’t, nobody does. A bell isn’t rung at the tops and bottoms. You’re just guessing. Guessing wrong could be costly.
The stock market is at all-time highs, I should sell. Not so.
This chart shows that you actually get a better return over time by investing at all-time highs in the S&P 500 compared to any other day.

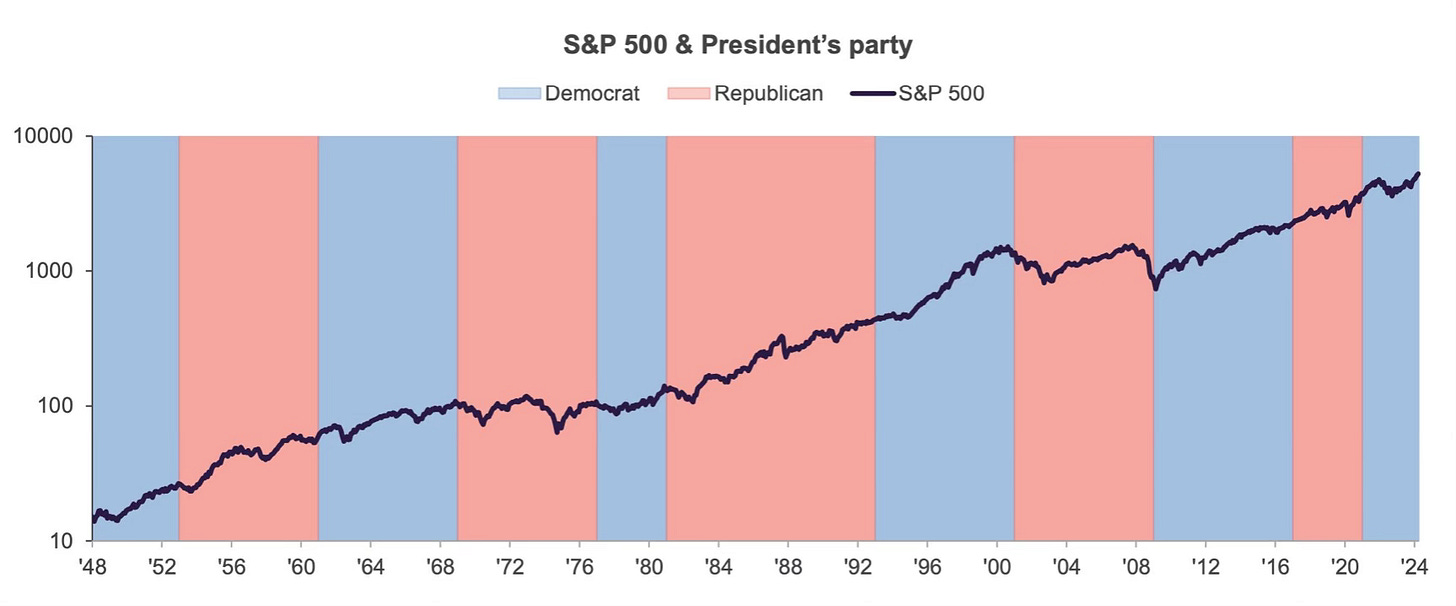
The president is changing. I must have to sell because I think one political party is better than the other. Not so.
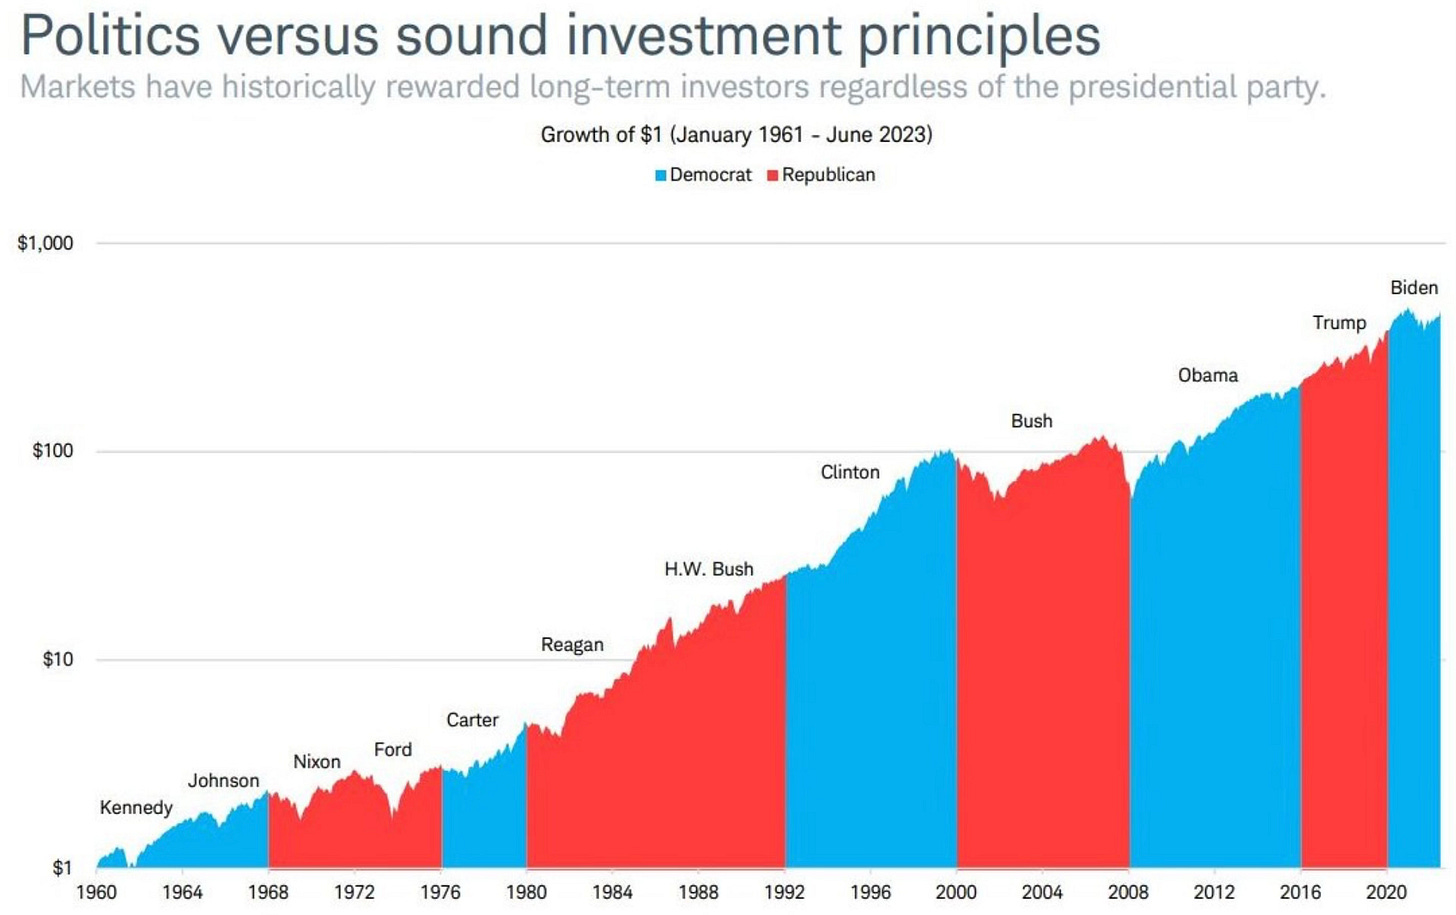
This chart shows that whether blue or red the stock market doesn’t care who’s in the White House.
Here is the breakdown by president/party going back to 1961. Up and to the right through them all.
The fact remains that $1 invested in 1950 into a no-fee S&P 500 fund, would now be worth $317. $100 would be worth $31,700. $1,000 would be worth $317,000. $10,000 would be with $3,170,000. All by doing nothing other than waiting.
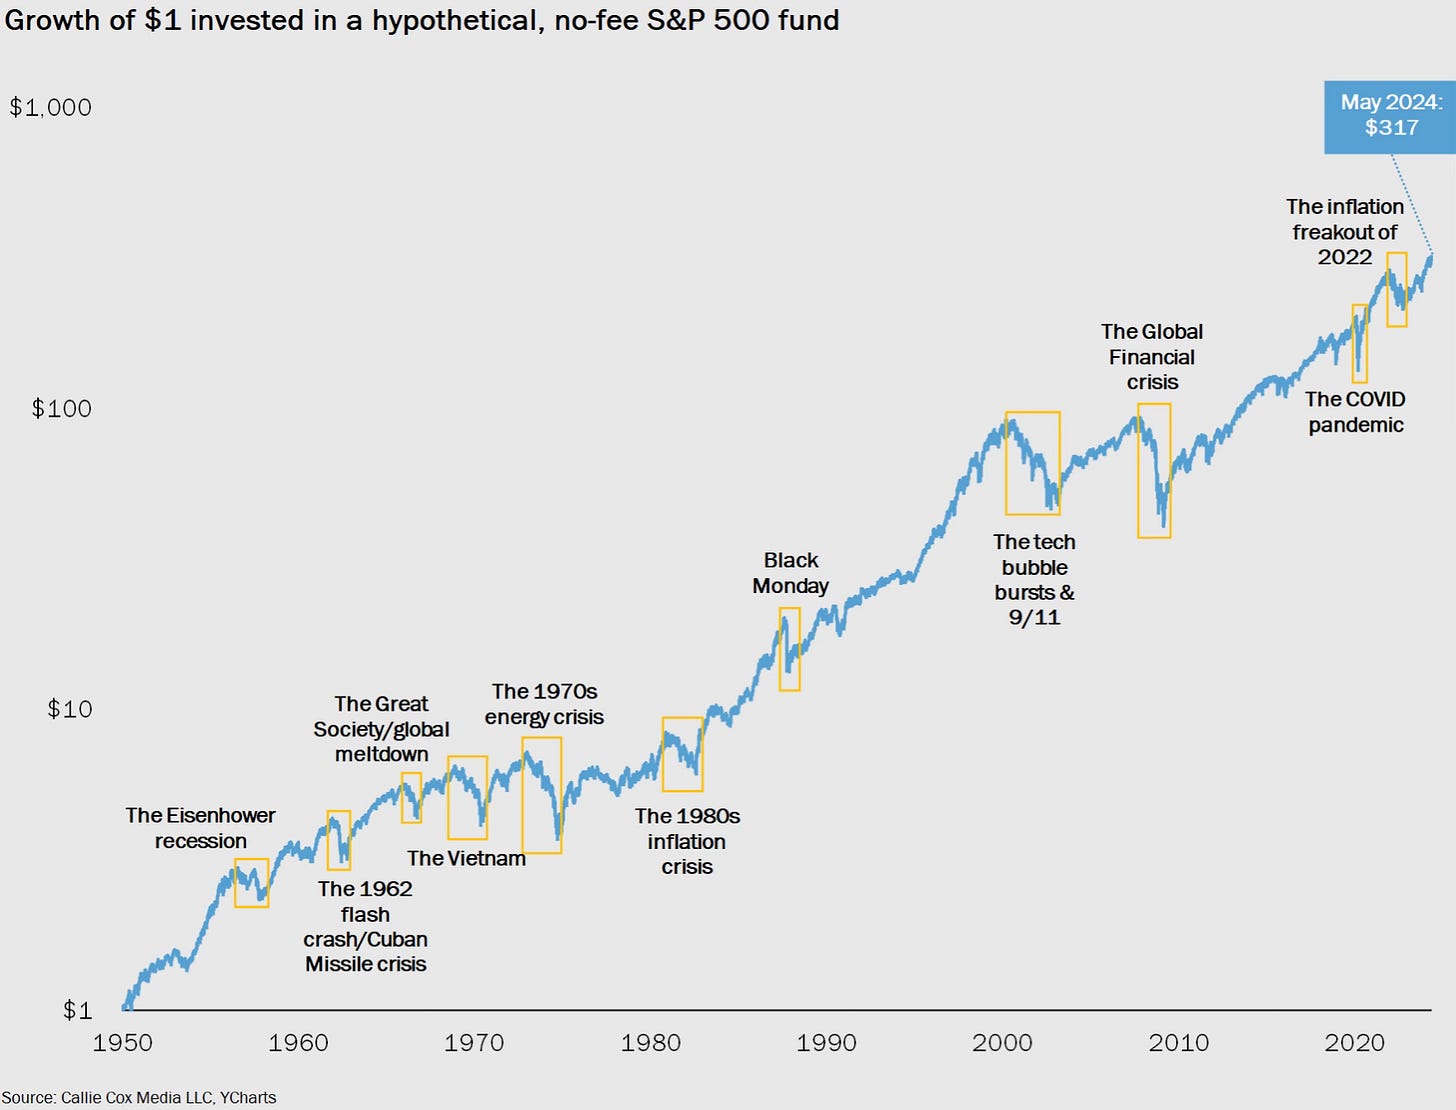
It never seems like a good time to buy. But in reality, it has always been a good time to buy, not to sell.
Traders will go in and out of the market by trying to time it. That’s their job and they’re professionals. It’s very hard to do.
Long term investors realize that you continue to plug your nose, cover your ears and buy. Buy month after month and year after year. History shows us that’s the one guaranteed way to be a successful investor.
There is always short term risks to the market. You can always find a reason to sell today, tomorrow or any day.
That doesn’t mean it’s a reason to do so.
The Coffee Table ☕
My family and I loved our time in Boston. It’s one of the best cities in the country. I received a lot of good recommendations on places to eat. Our 3 favorite spots were Giulia, Mamma Maria and Grill 23. Giulia is one of the best places we’ve been. It’s the hardest reservation to get in Boston and I can see why. Find a way to get a table if you’re in Boston. It’s that good!
I didn’t do much reading on our trip until we found ourselves delayed in an airport on our way home. The piece I enjoyed most was Some Things I Don’t Want When I Grow Up by Ben Carlson. The two that made me laugh the most were “I don’t want to become a grey-haired permabear” and “I don’t want to be a rich guy who complains about taxes.”
We’ve all heard what inflation has done to dining out. This is a great chart that shows inflation across U.S. fast food chains from 2014 to 2024.
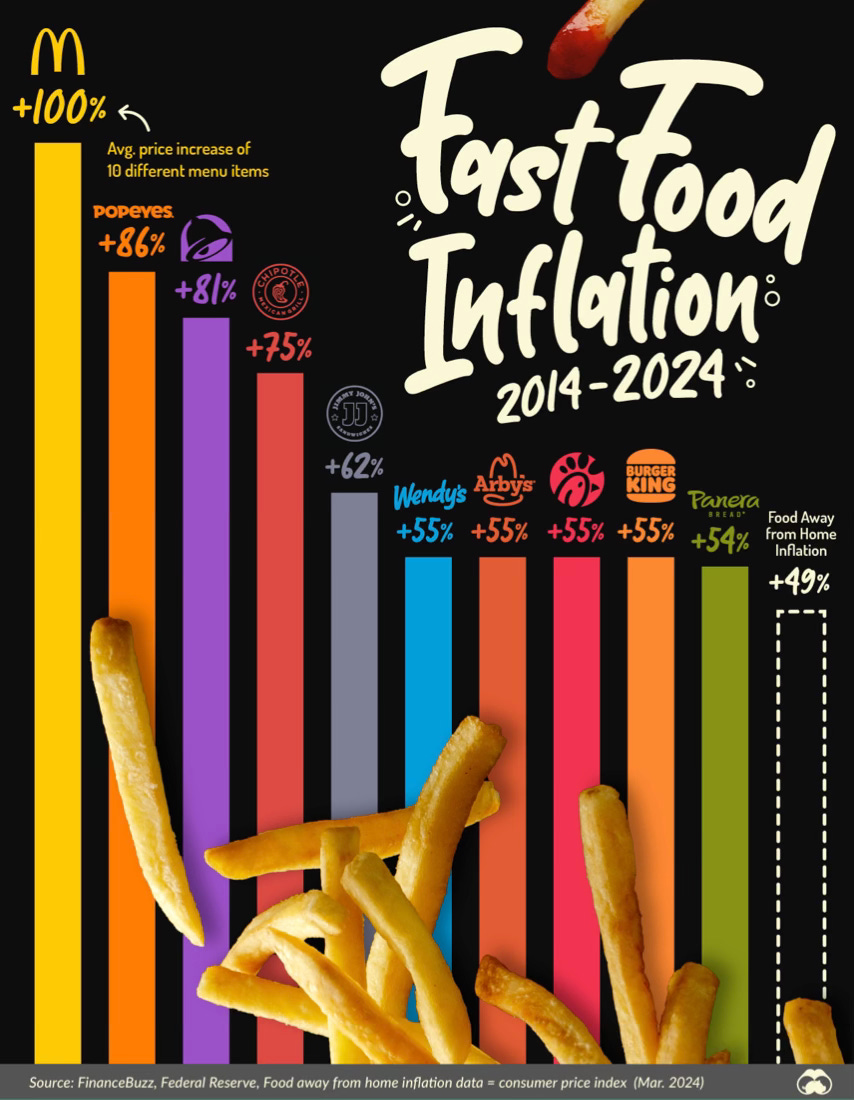
Source: Visual Capitalist
Thank you for reading! If you enjoyed Spilled Coffee, please subscribe.
Spilled Coffee grows through word of mouth. Please consider sharing this post with someone who might appreciate it.
Order my book, Two-Way Street below.

