If you had told me a couple years ago when mortgage rates were below 3%, that mortgage rates were going to hit 8% and that home values will be actually be higher, I would have said you have to be drunk.
Nobody would have believed it. Yet here we are.
Mortgage rates continue to hover between 7-8%. As I write this, the 30-year mortgage rate is at 7.16%. That’s the highest level since November 2023.
This is a historical look at the 30-year mortgage rate.
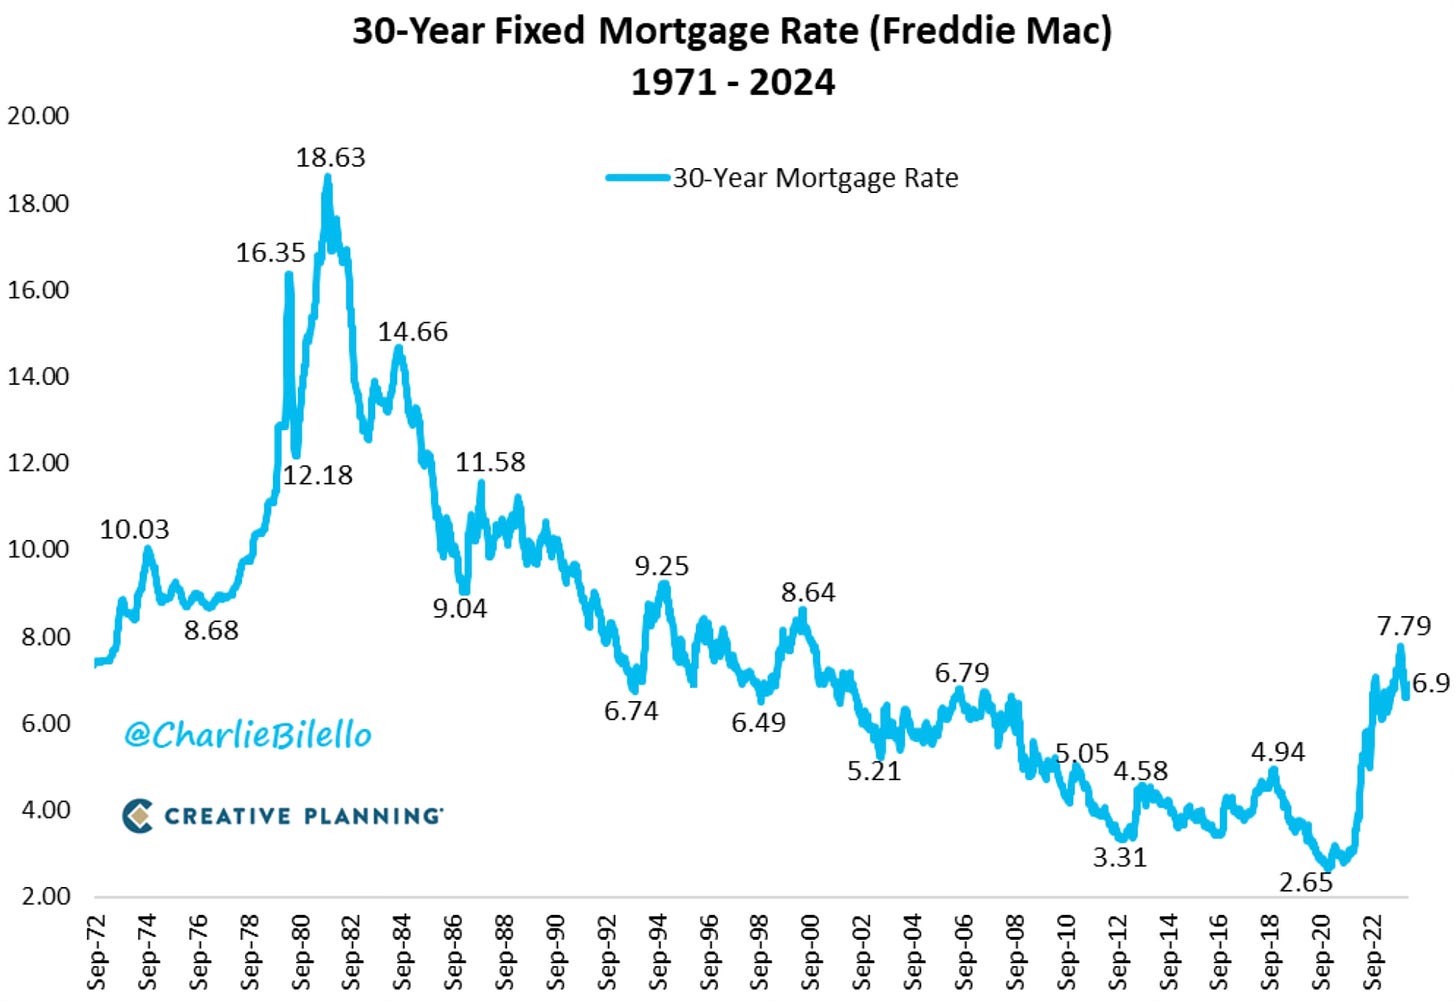
With all the people who have a locked in 3% or less mortgage, it isn’t allowing for much inventory to really hit the market. Why would anyone want to give that up?
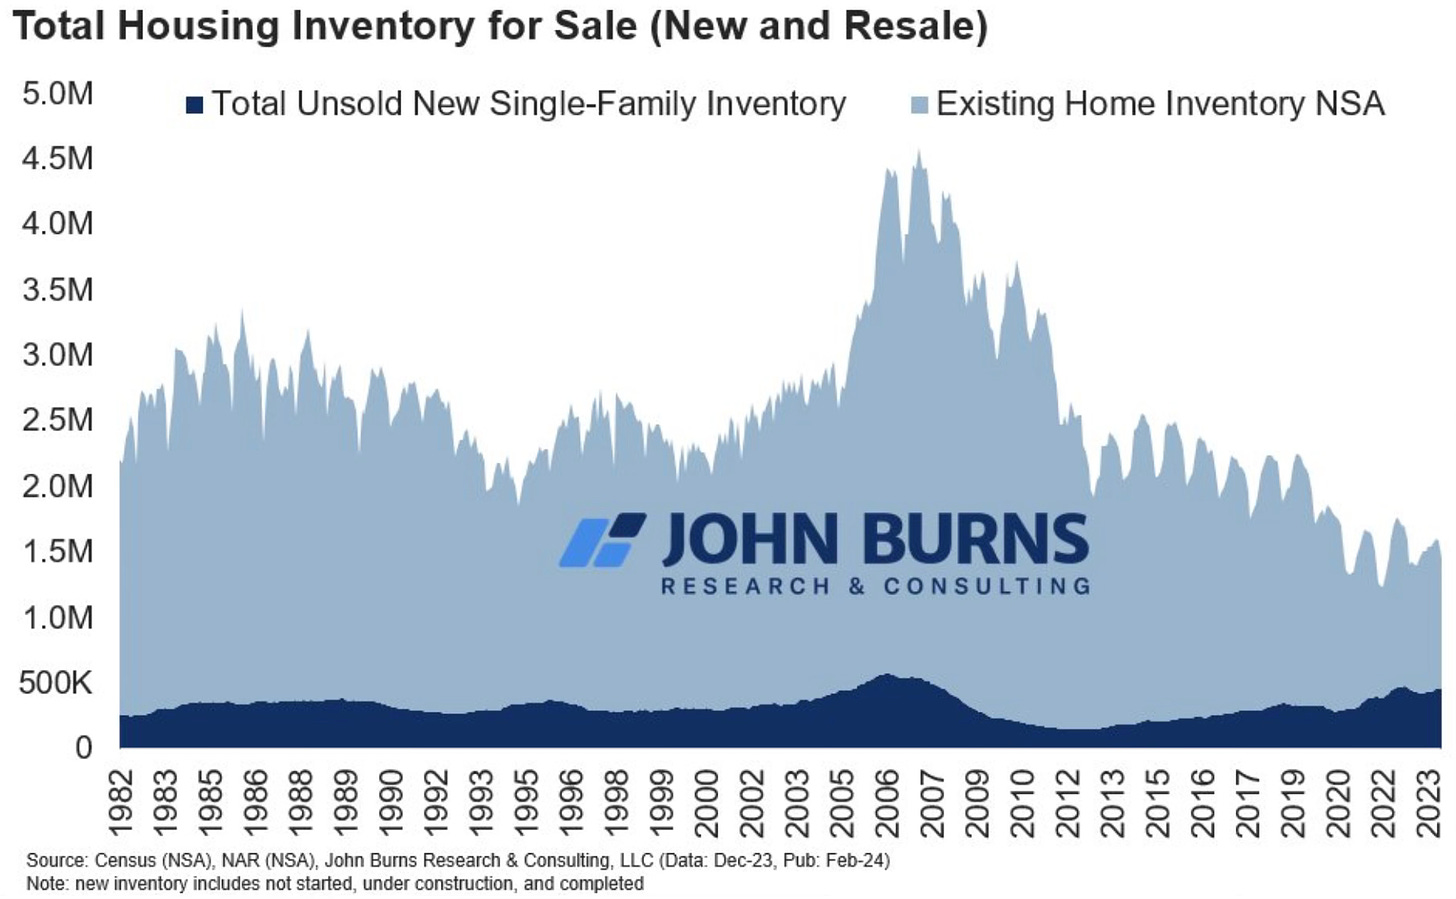
That’s a reason there such an inventory shortage. When you talk about housing inventory, here is a chart that looks back historically and you can see the lack of supply.
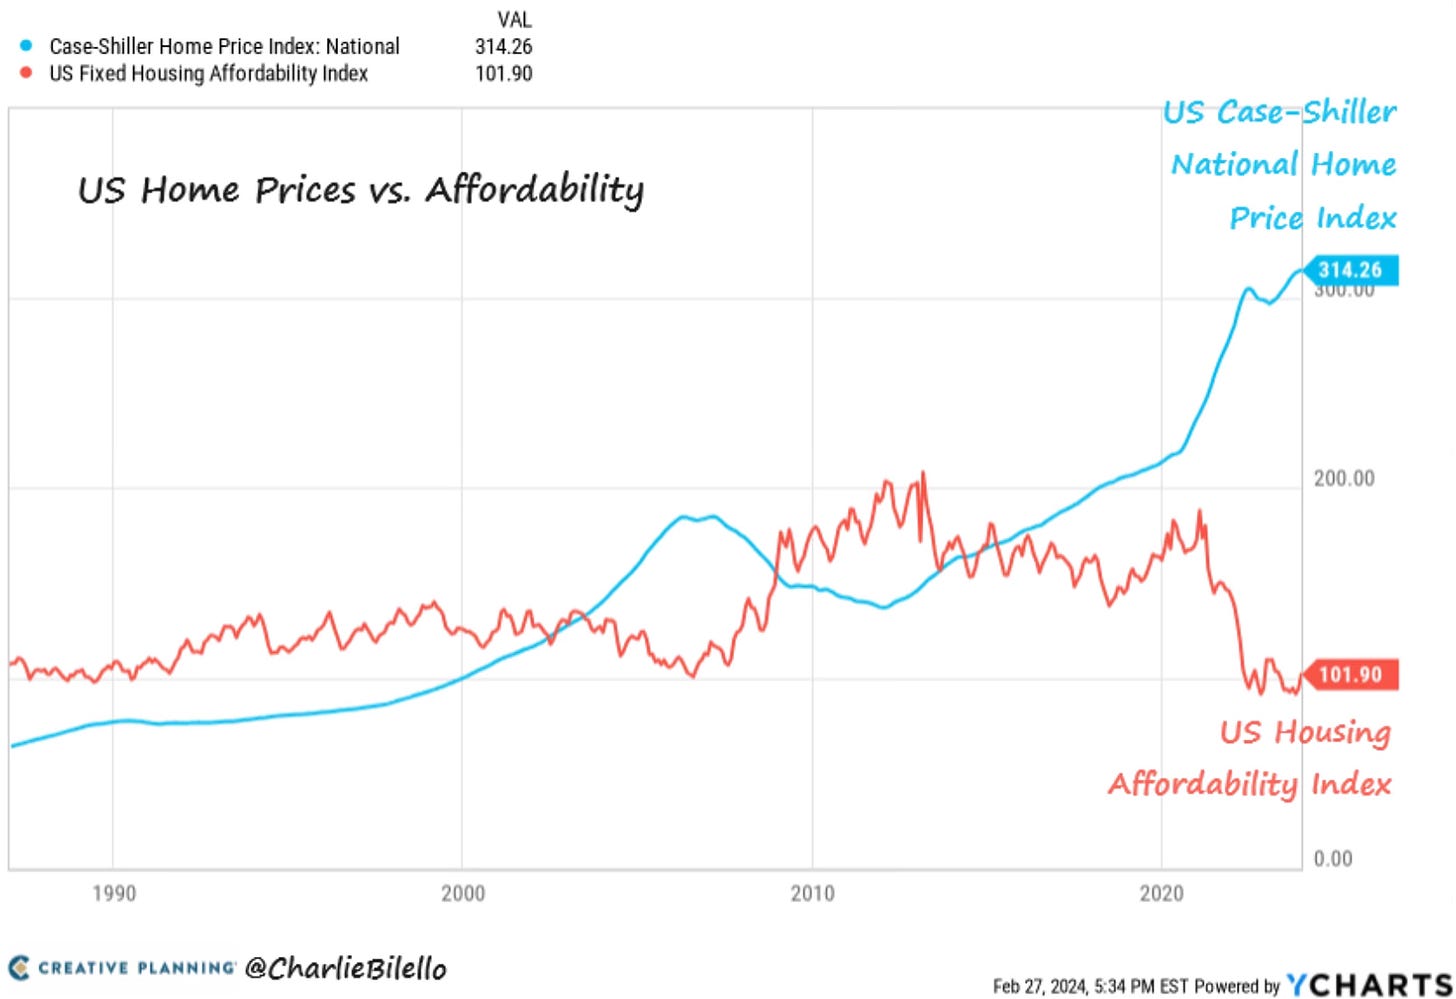
That has led to an all-time high in prices despite an all-time lows in housing affordability. Affordability continues to get worse while prices continue to rise. US home prices have now had 11 straight months of price jumps.
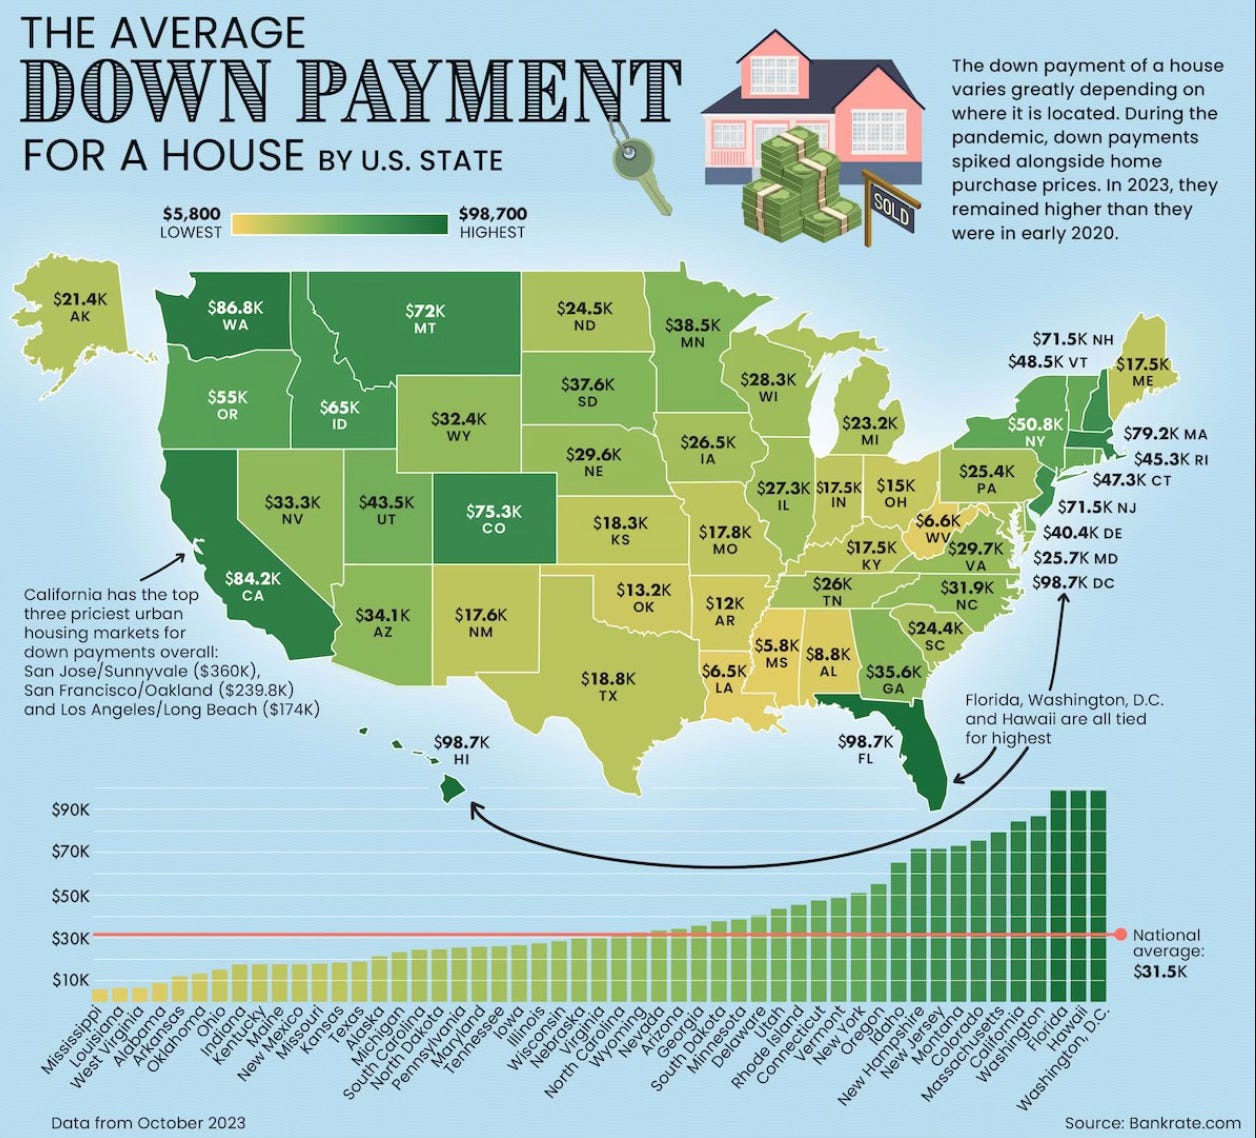
The all-time low affordability has driven up the average down payment needed. Here is a look at the average down payment needed for a house by state.
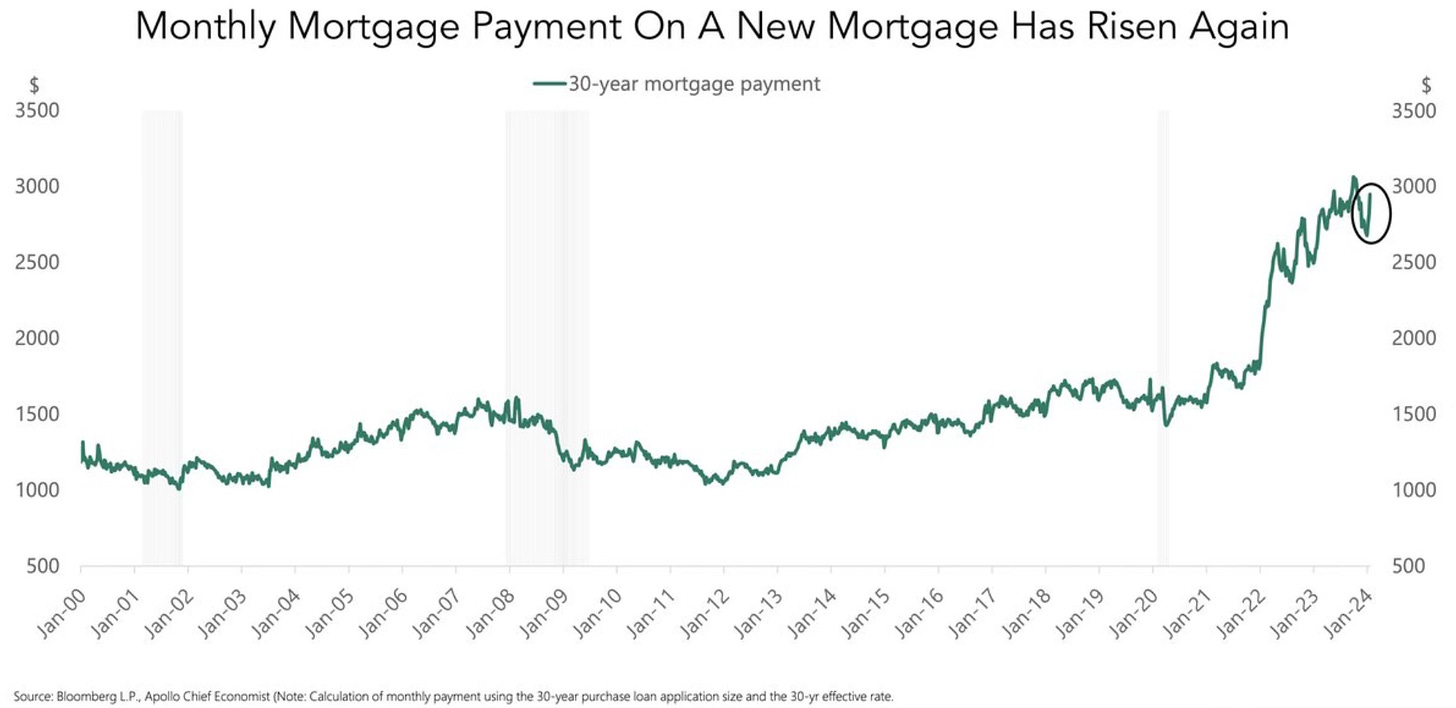
You can see what this has done to the monthly mortgage payment on a new mortgage. It’s becoming very expensive and it’s pushing many hopeful home buyers to the sidelines.
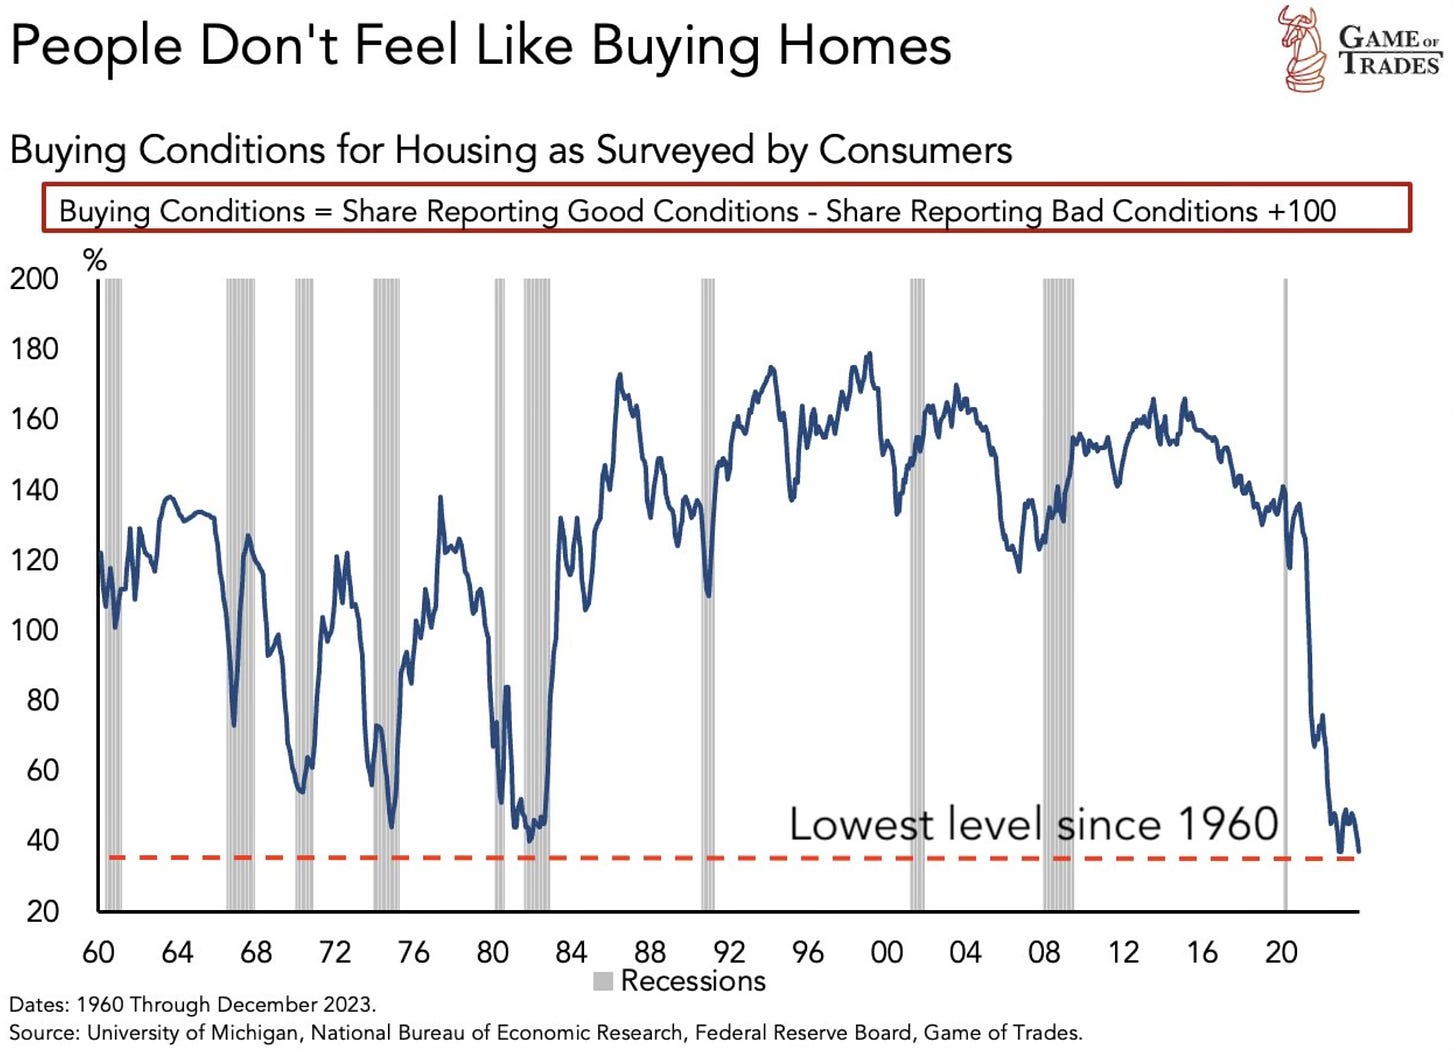
Does this make you want to go rush to buy a home? I didn’t think so. This chart shows just that sentiment among consumers.
Despite all these things, you would have thought it would have hurt the housing market. It hasn’t. Housing has overcome it all. It’s extremely surprising really.
In the US from December 2022 through December 2023 home prices rose 3.2%. That now makes 12 consecutive years of gains for home prices.
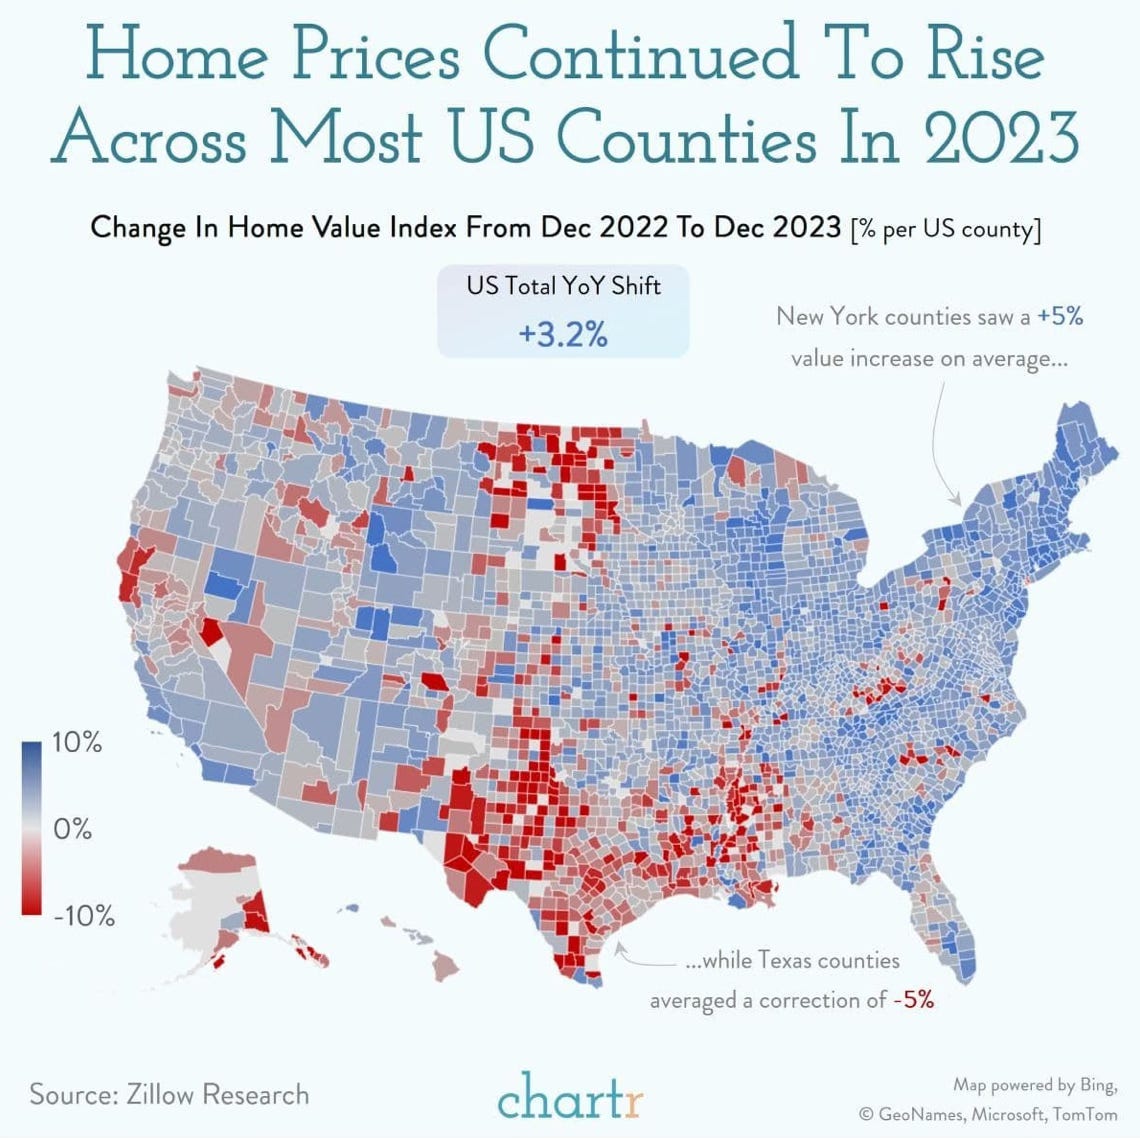
According to the Zillow Home Value Index in January, home prices are up in 47 of the 50 largest housing markets in the country.
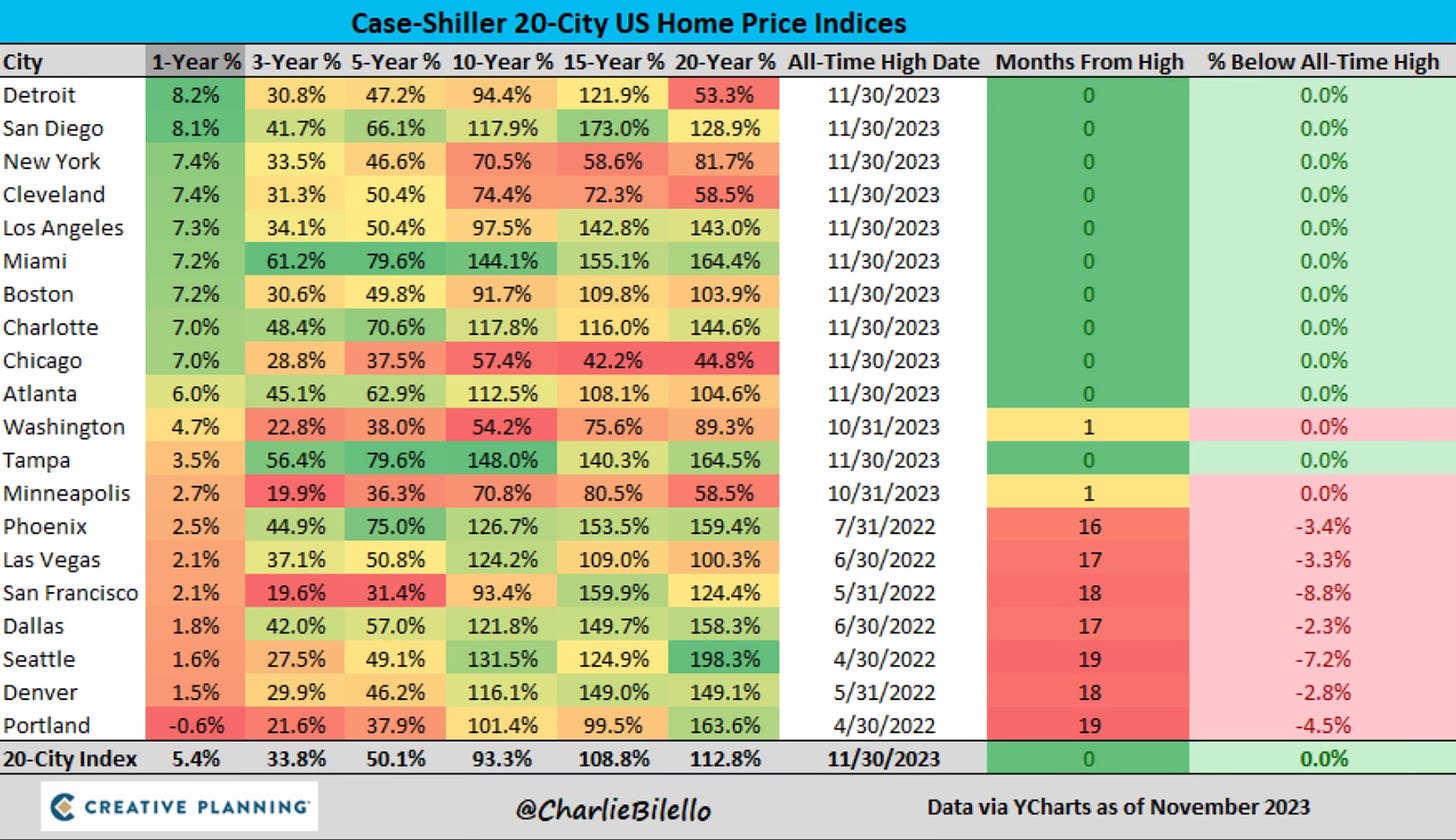
Here is the historical look back at the 20 US cities in the Case-Shiller 20-City Index. The past year saw 19 of the 20 cities experience gains. But just look at where the 3, 5, 10, 15 and 20-year gains are at.
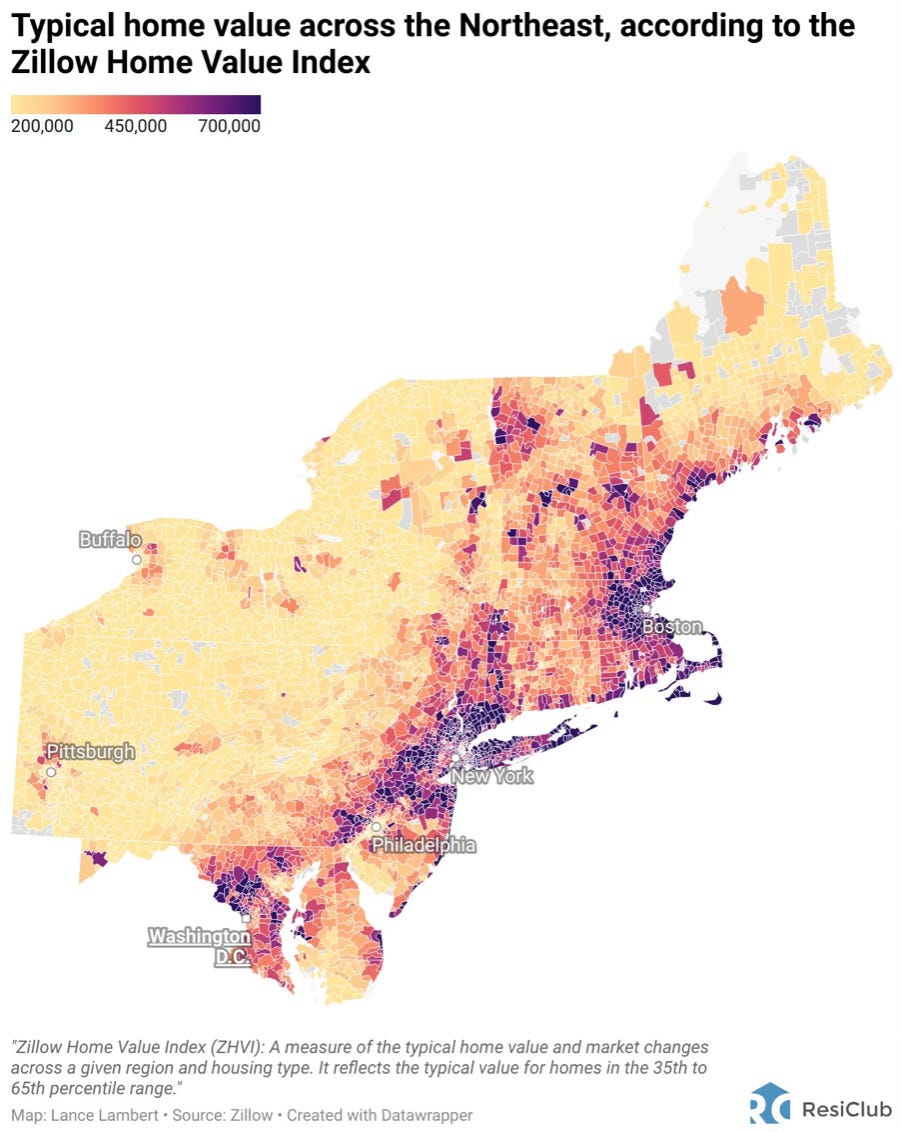
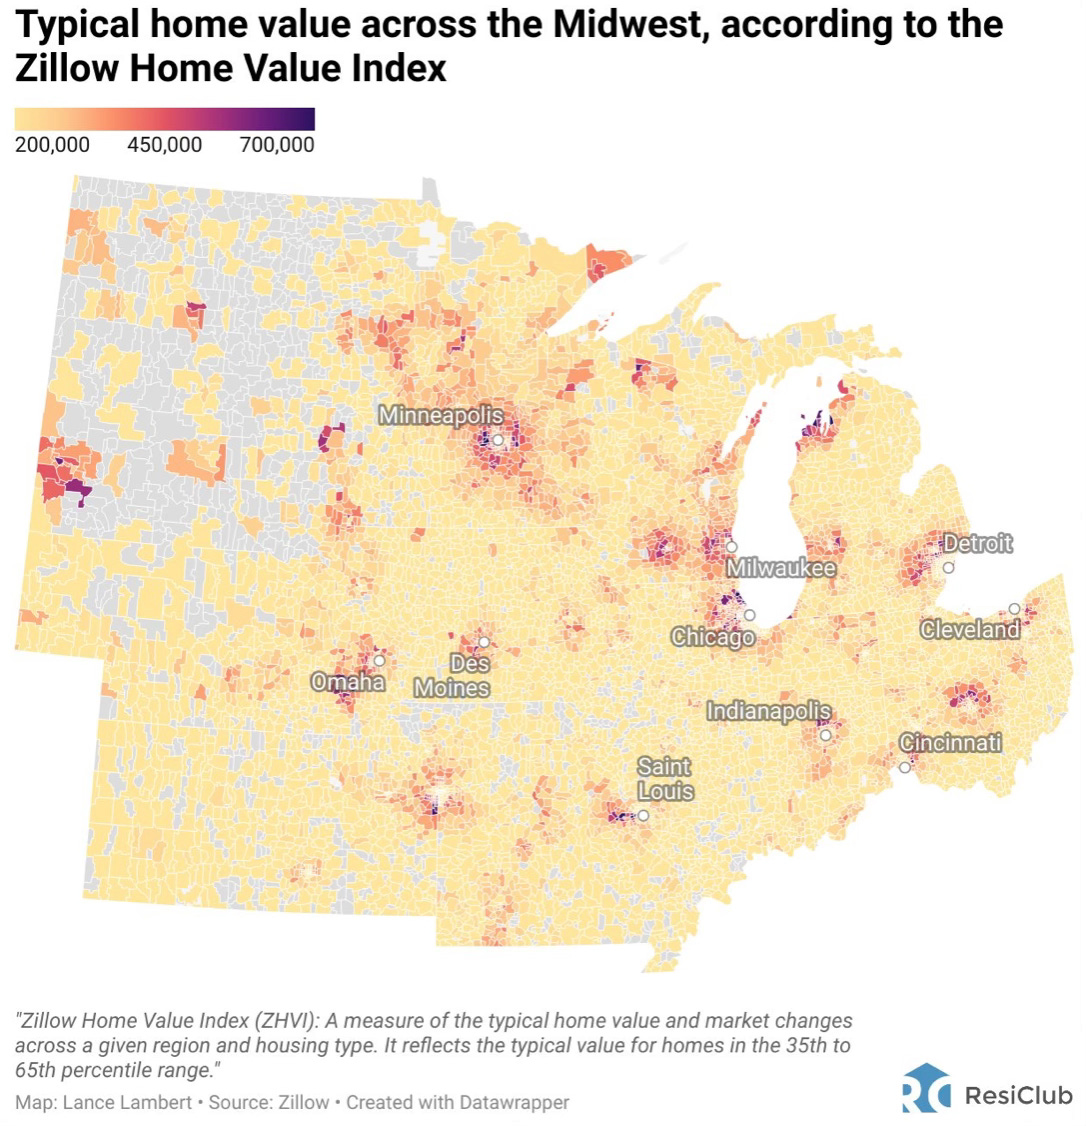
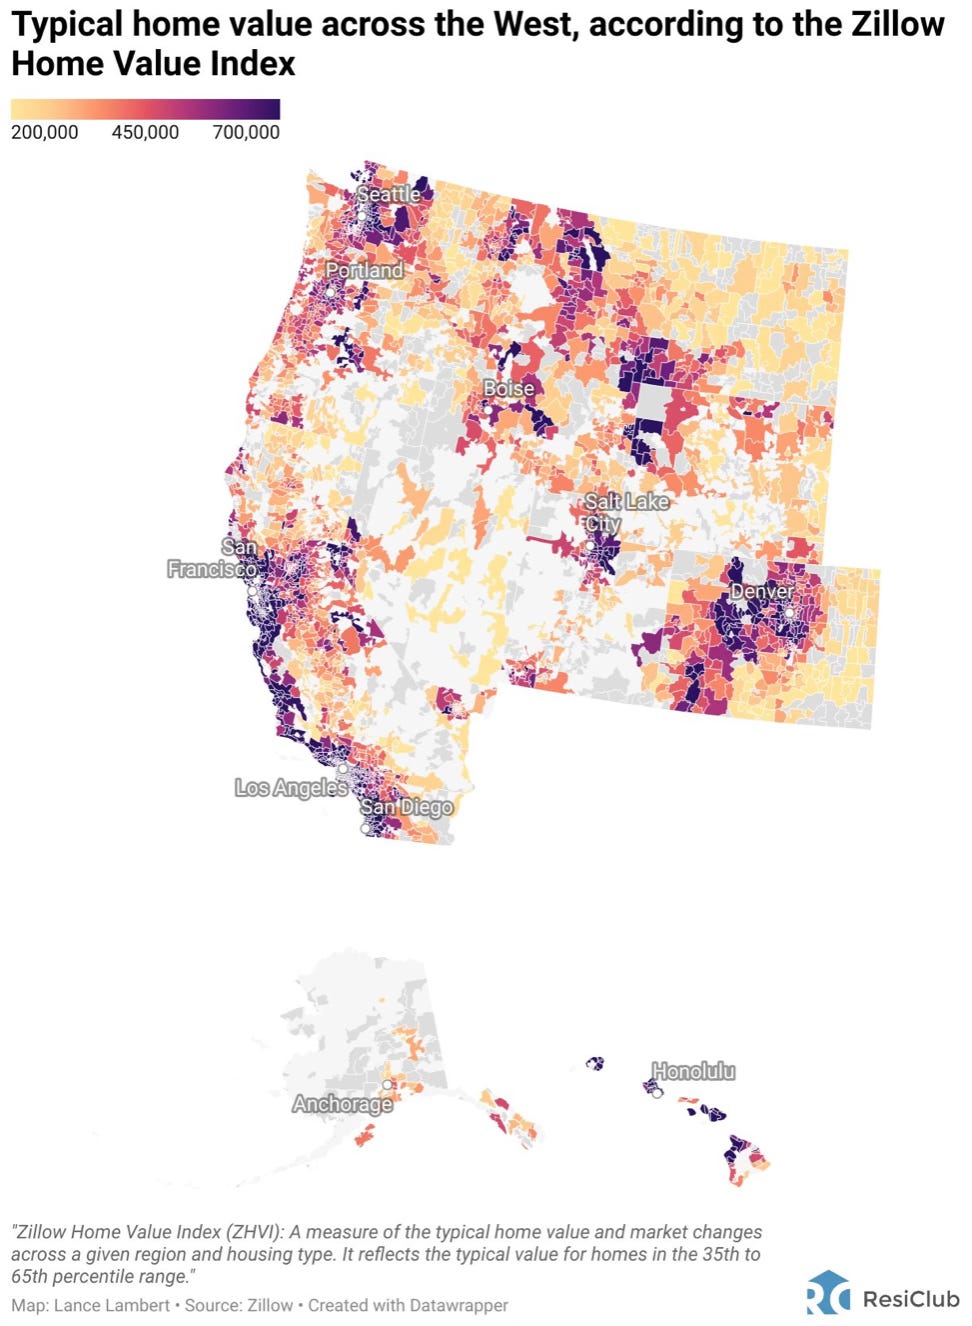
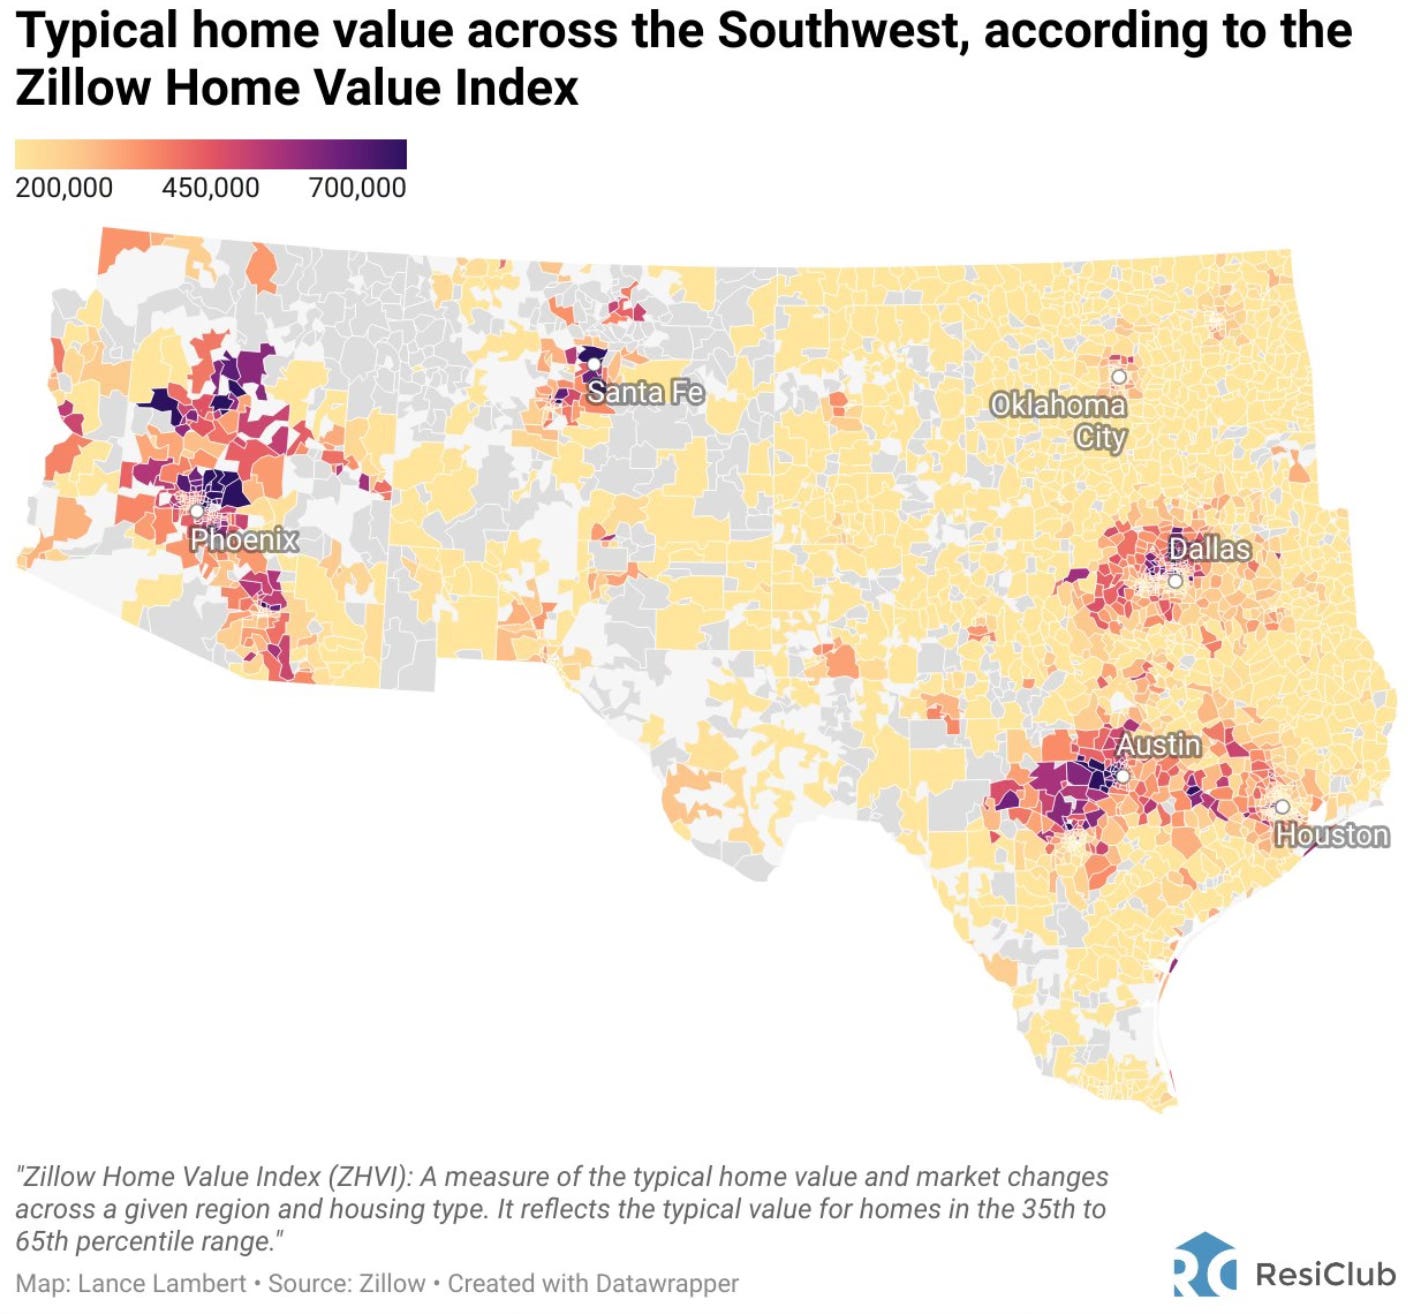
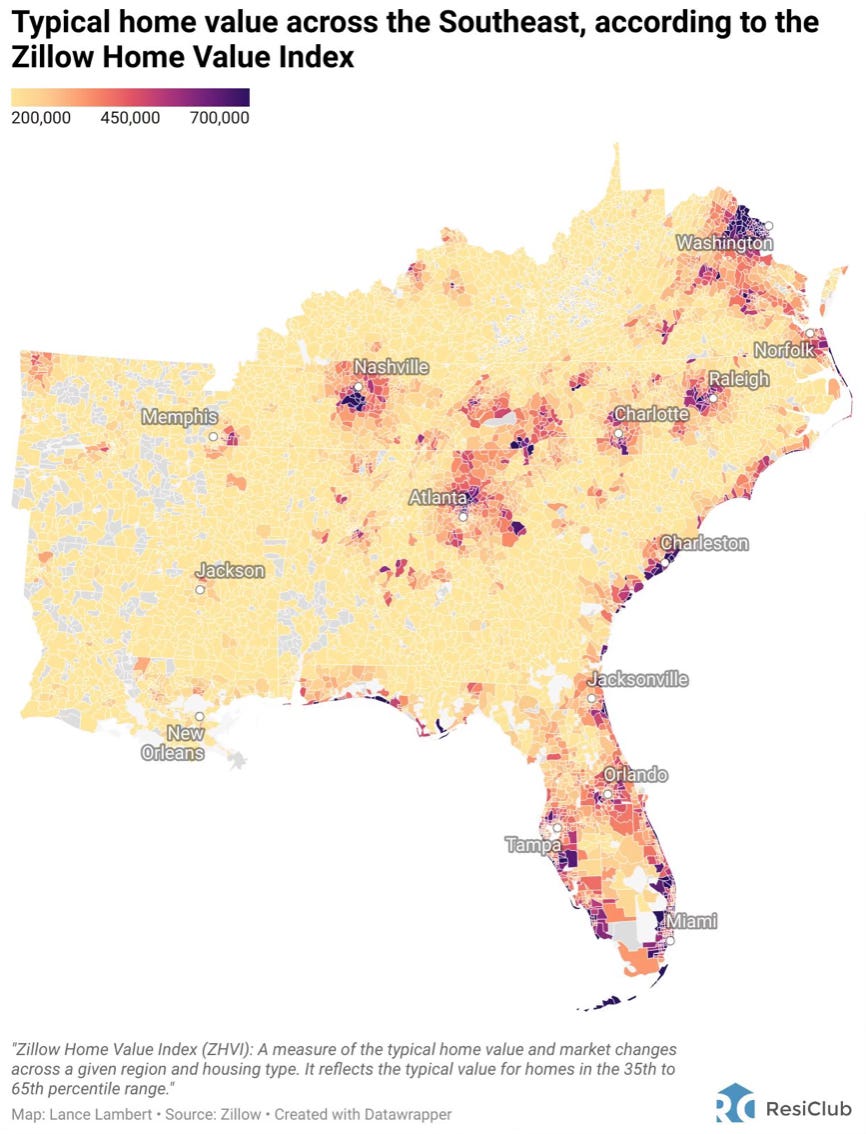
As we zoom in at various parts of the country, you can see the levels of home values by region and down to the zip code level.
First the Northeast.
The Midwest.
The West.
The Southwest.
The Southeast.
If the jump in interest rates and all-time low affordability has not thrown the rise in US home prices off track, I’m not quite sure what will minus a black swan type event like the Great Financial Crisis (GFC).
Even if rates rise, I don’t think the trajectory changes very much with prices. On the flip side, how much of a rise in prices would we see if mortgage rates fall? We could experience a repeat of 2020 where home prices rose 10%, or 2021 when home prices rose 19%.
There is a continuing strength of demand and despite what is thrown at the housing market, the prices of homes just continue to grind higher. Right now there is nothing to suggest that path changes any time soon.
The Coffee Table ☕
In sticking with the housing theme, I found Ben Carlson’s post called What is the Historical Rate of Return on Housing? quite interesting. One of the hardest things to figure out is what is a true rate of return for your home. You need to live somewhere and think all the money you put into it (repairs, taxes, insurance etc.) After reading this it made me think about my house and how impossible it really is to truly figure out.
If you’re into traveling, this is a great article about the best places to go in the world from Conde Nast in 2024. The 24 Best Places to Go in 2024 Some of these places are just incredible.
Thank you for reading! If you enjoyed Spilled Coffee, please subscribe.
Spilled Coffee grows through word of mouth. Please consider sharing this post with someone who might appreciate it.
Order my book, Two-Way Street below.


