Contrary to what you hear, the current stock market isn’t like the dotcom bubble. Nvidia isn’t like Cisco was.
Remember that words like bubble and crash create fear, which generates clicks and attention.
Let’s first look at the Nvidia to Cisco comparison being made.
Cisco’s forward P/E peak was 131 on March 27, 2000. Nvidia currently has a forward P/E of 45.
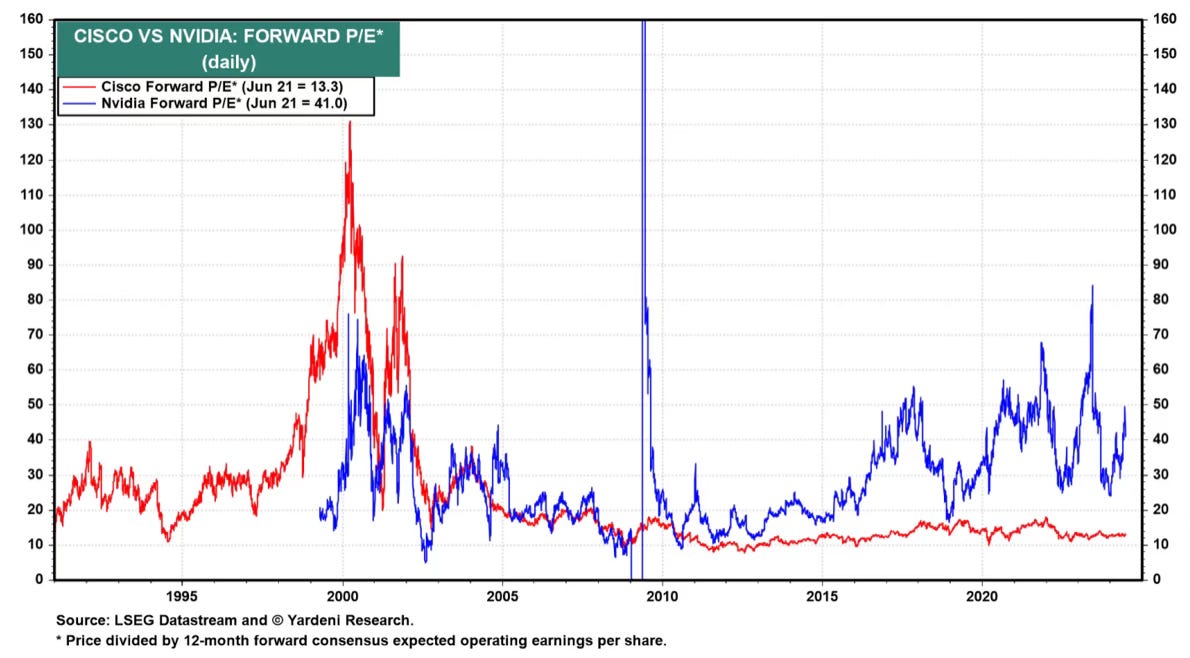
Nvidia isn’t cheap, but it’s nowhere near where Cisco was. It’s not even close to where Microsoft’s forward P/E was in 1999.
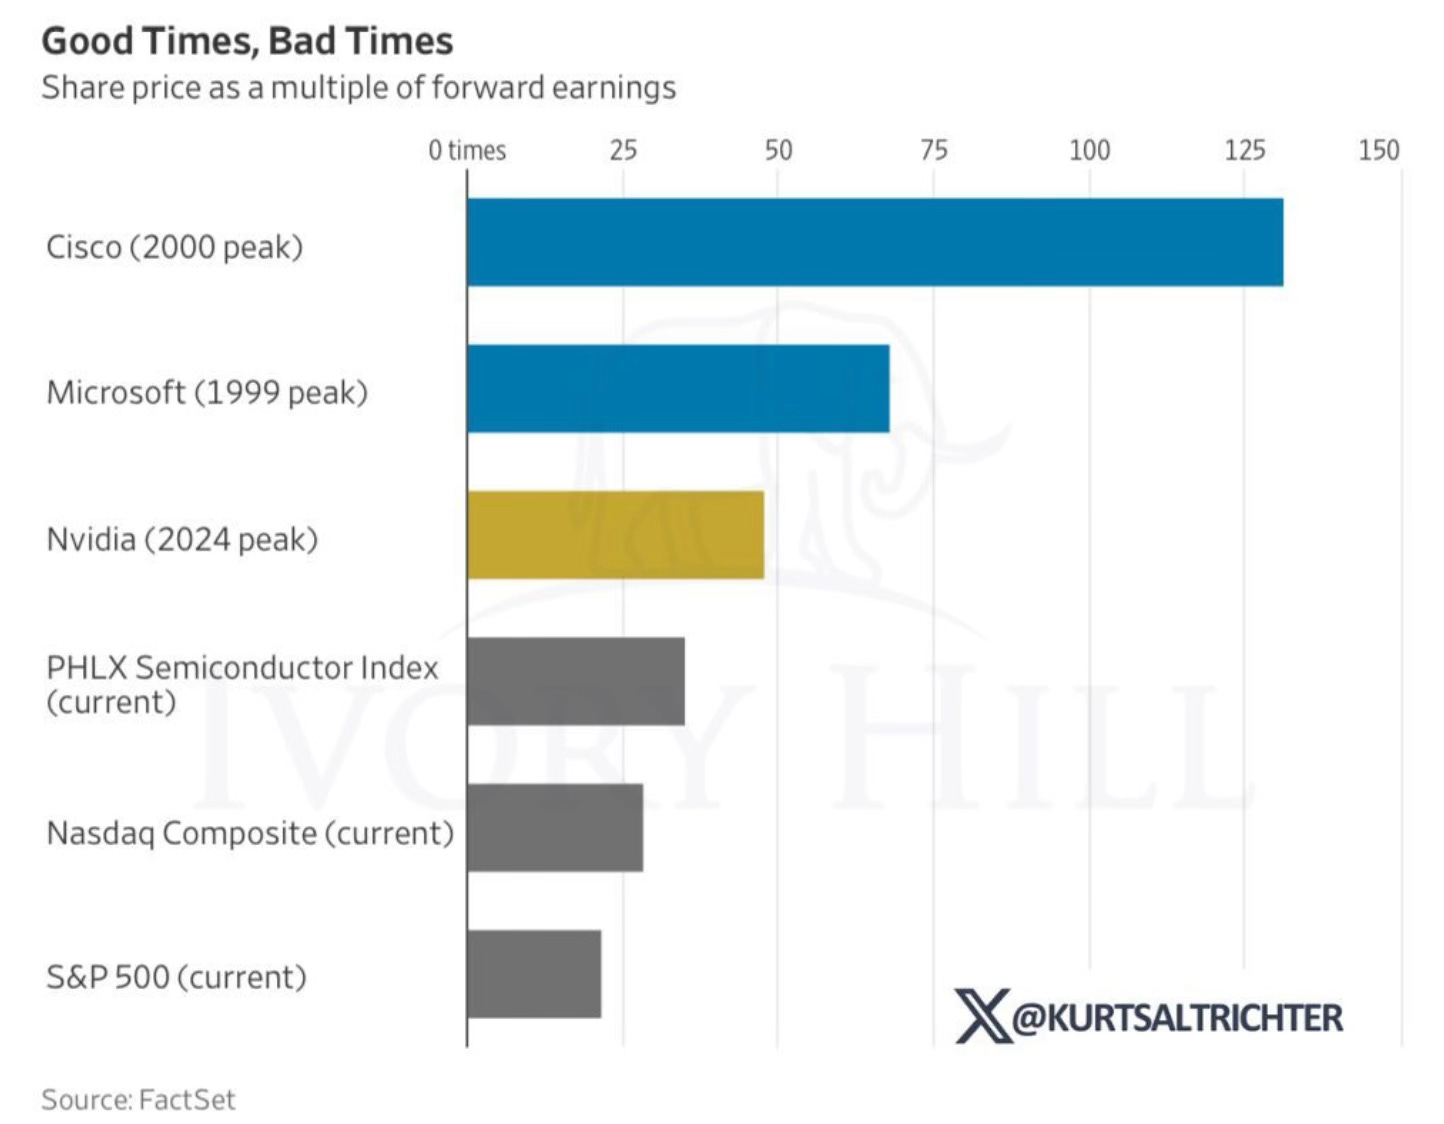
Just because a stock is on a historic run doesn’t mean it has to crash. It doesn’t have to follow the same path as another stock did 24 years ago. Not everything has to be repeated. We look for things that seem the same to make an easy comparison.
These are fundamentally two totally different companies with different stock valuations. Don’t make this lazy comparison.
Now that we have that out of the way, let’s shift to the overall market.
A lot of focus has been on the largest stocks in the market. We’ve seen the mega-cap tech stocks lead this bull market. Then they have to be overvalued, don’t they? After all, this is supposed to be another dotcom bubble, which means those have to be ready to pop? Just like Nvidia, right?
Nope. Incorrect.
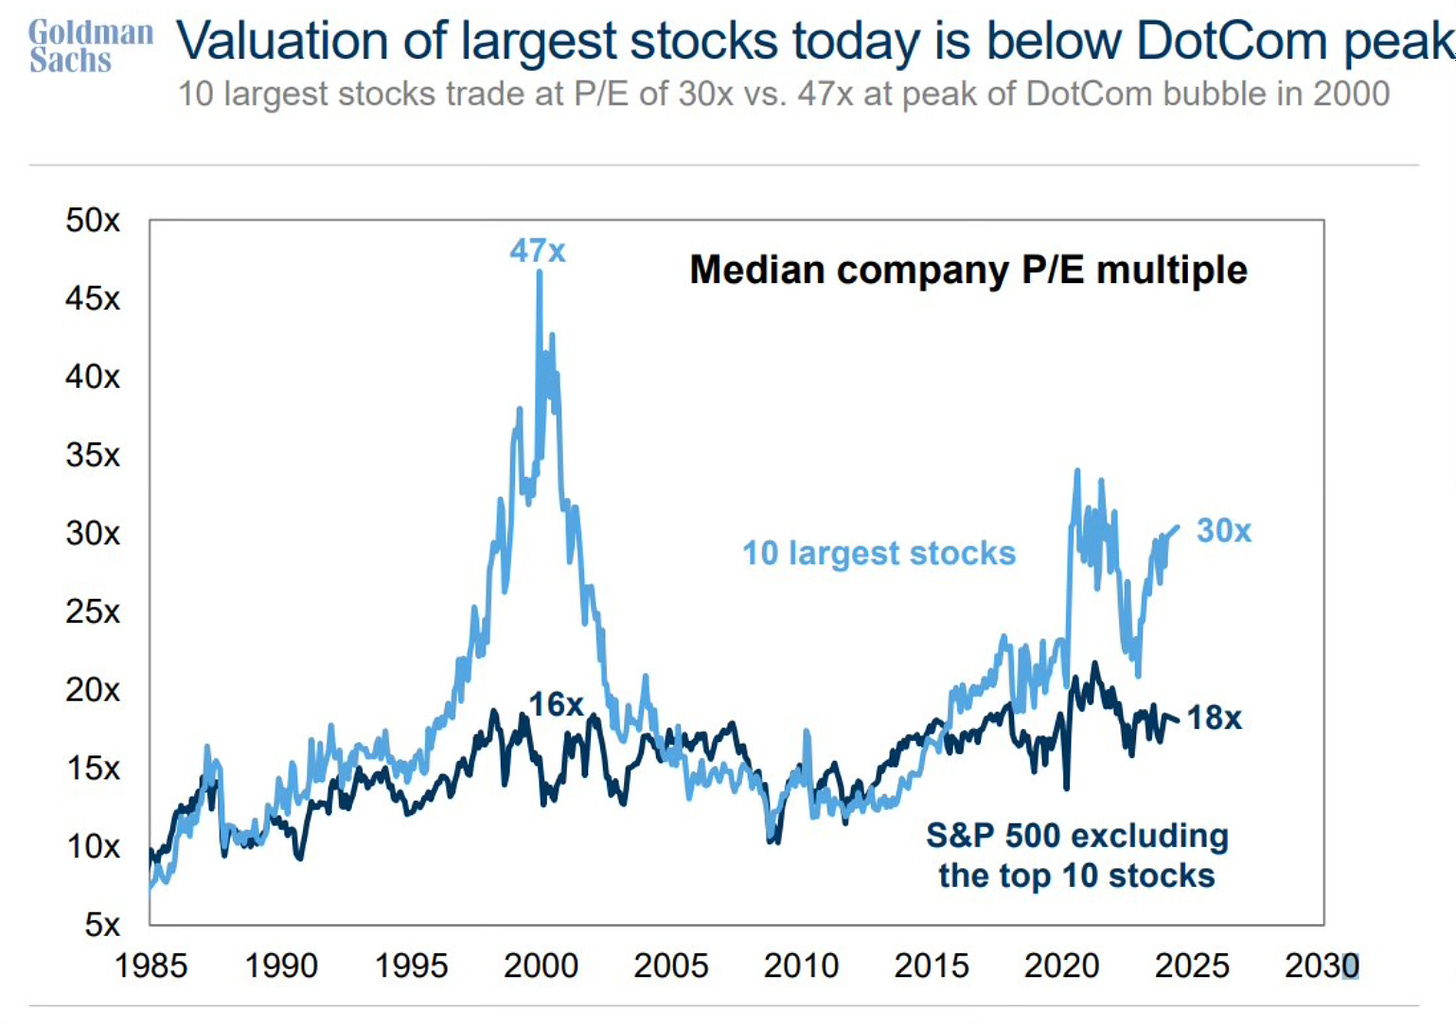
The 10 largest stocks today trade at a P/E of 30x. In 2000 the 10 largest stocks traded at a P/E of 47x. Take those top 10 stocks out and today the S&P 490 trades at 18x. In 2000 it was 16x.
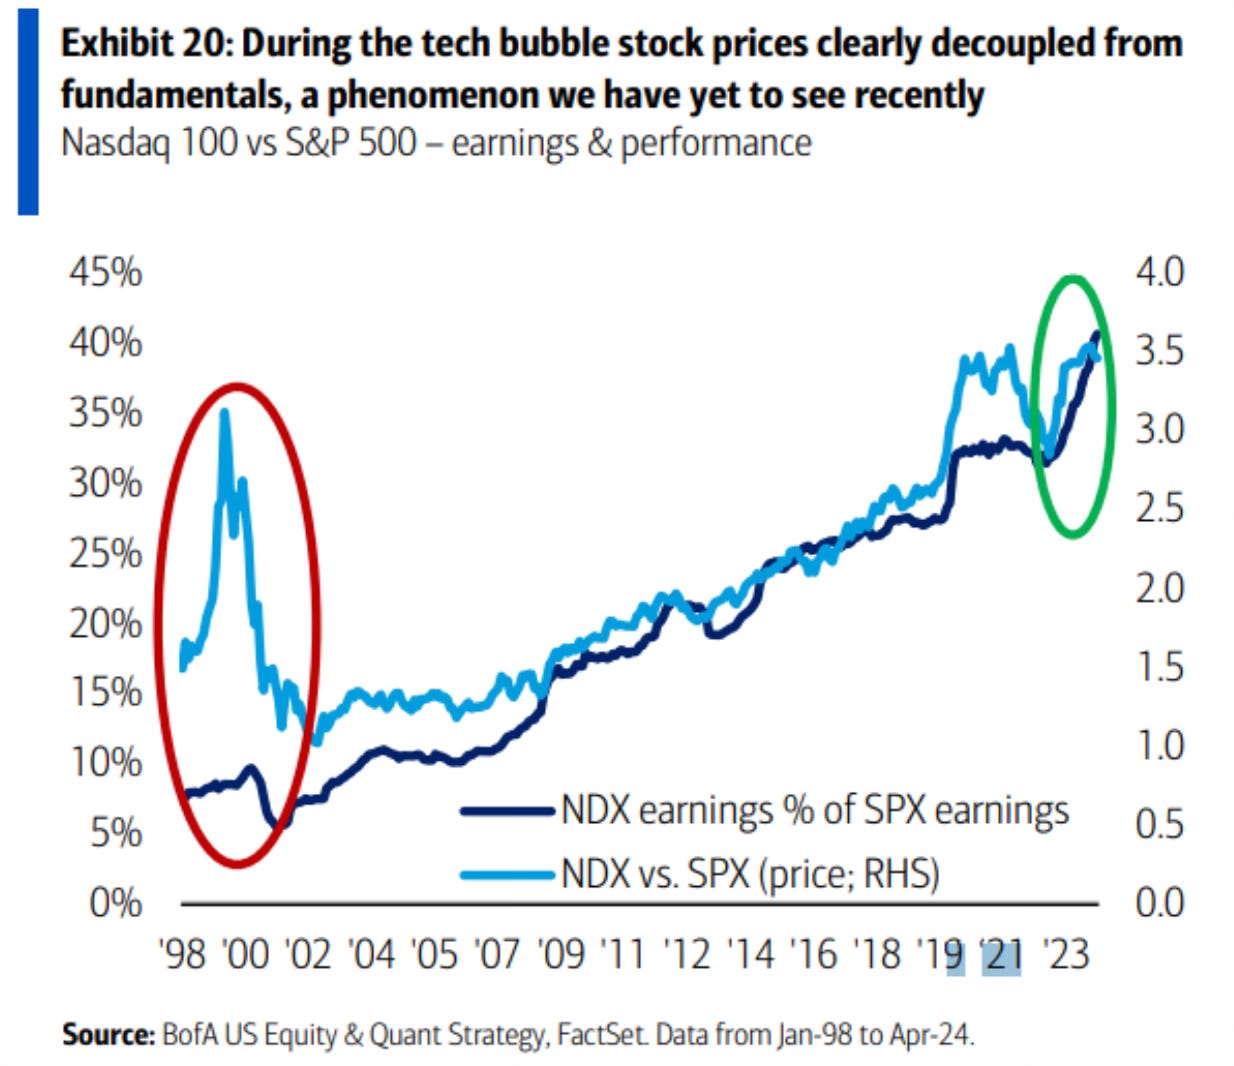
This chart of the Nasdaq 100 vs S&P 500 earnings and performance, shows that the fundamentals became completely disconnected from stock prices in the dotcom bubble. Just severely out of whack. Currently those fundamentals have remained in line with the earnings they’re generating.
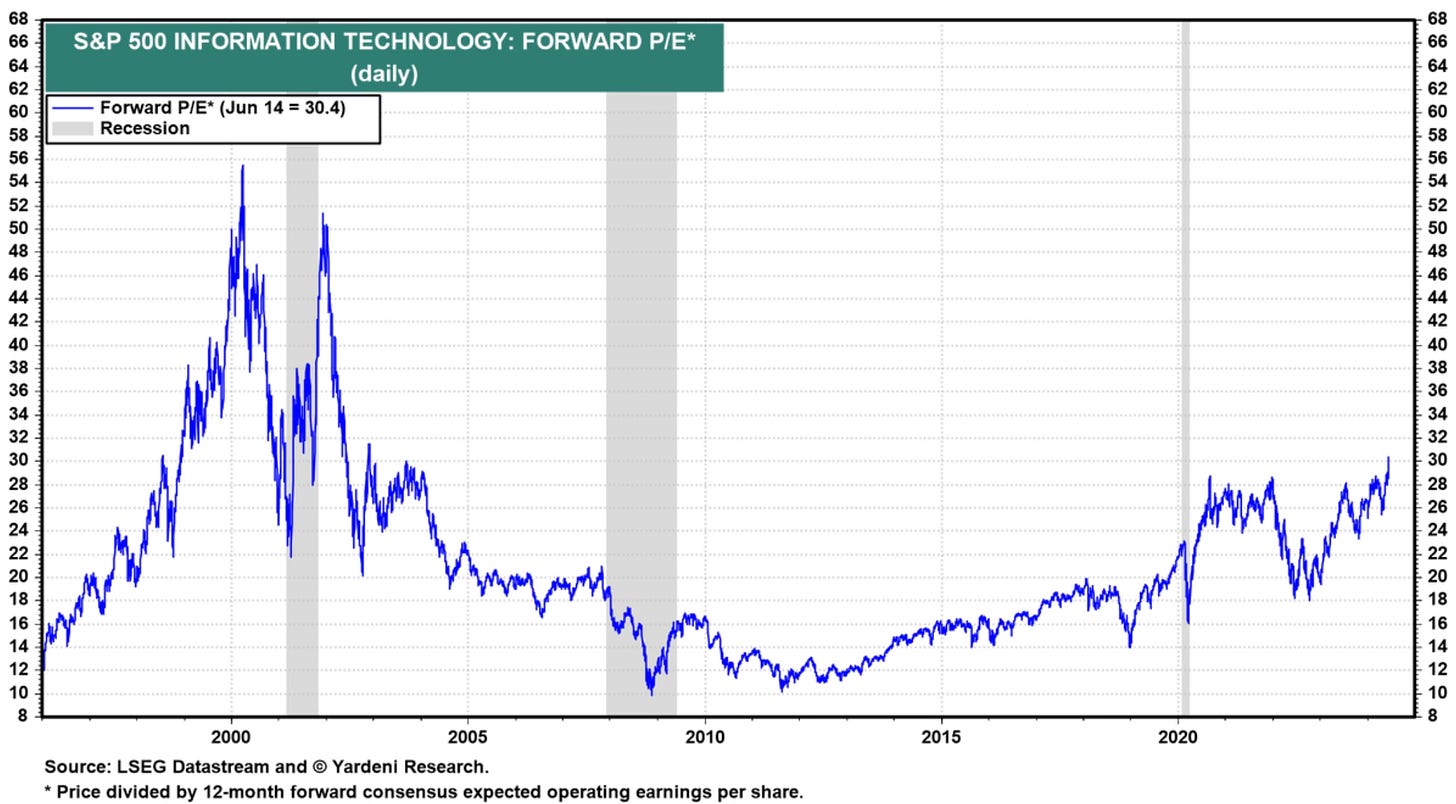
If we look from a forward P/E standpoint. Right now the tech sector is trading at a 30.4 times forward earnings. On March 27, 2000 that number was at 55.5, before it burst.
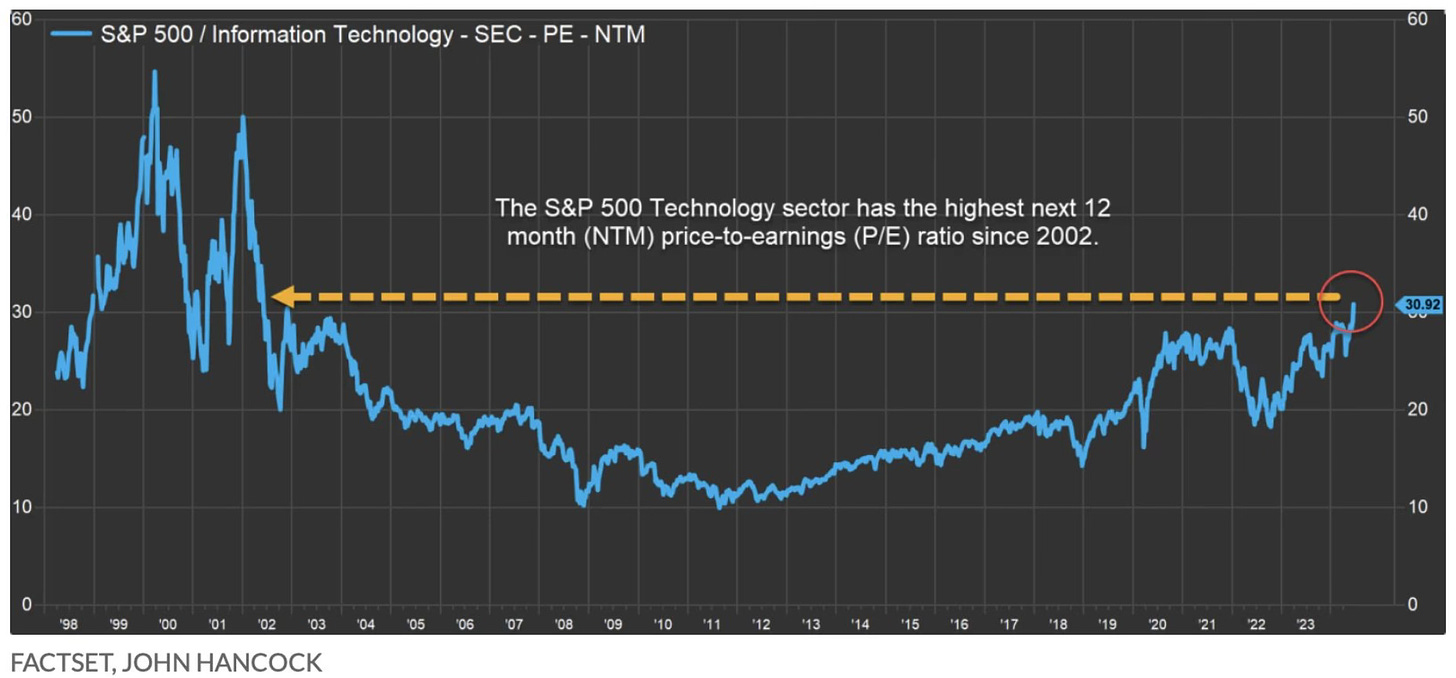
Barchart points outs the following.
Tech Stocks Forward P/E Ratio jumps to 30.9, the highest since 2002.
But look how much farther it has to go to reach the levels in 1999-2000.
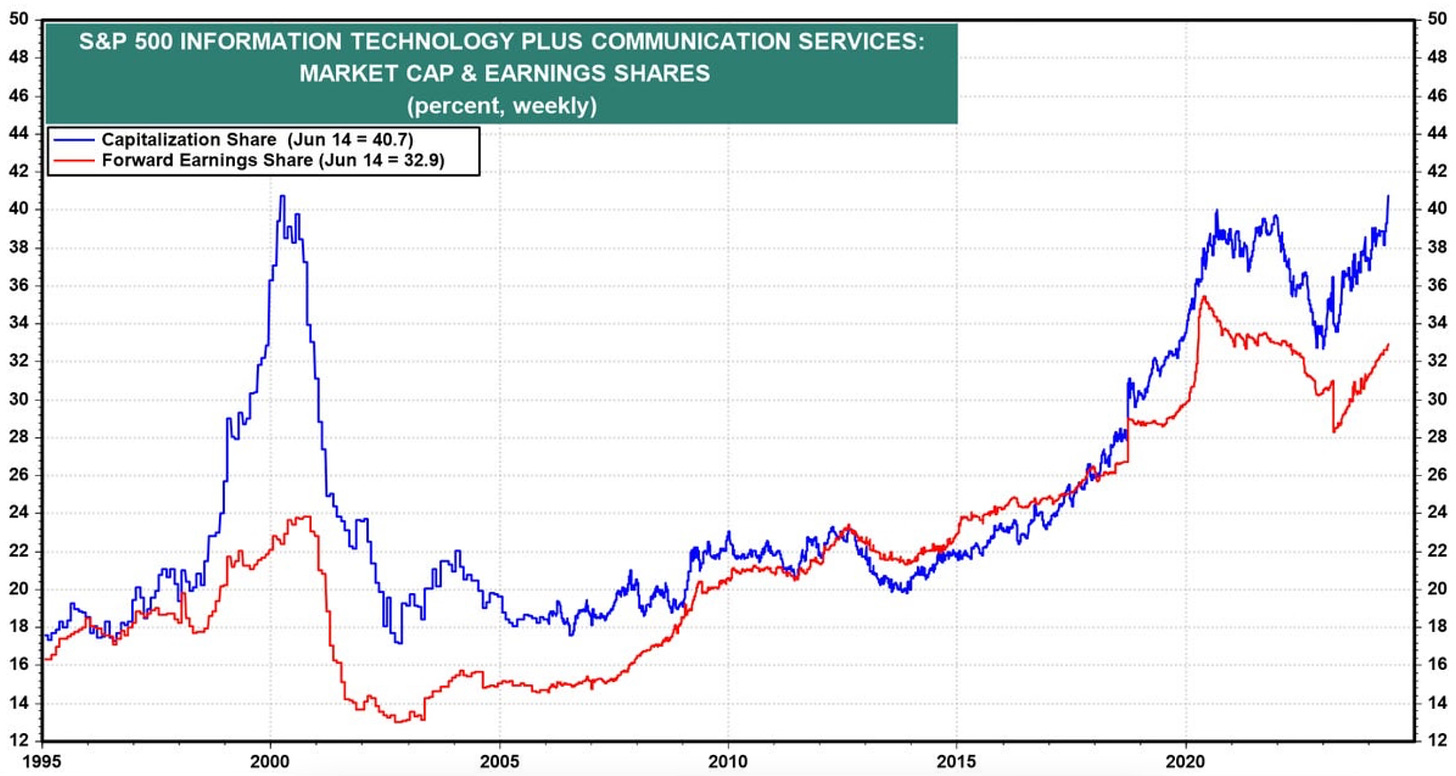
Now let’s add in communication services along with technology from Yardeni Research/Eric Wallerstein.
Tech and Communications account for 40.7% of the S&P 500's market cap today, which is similar to Dotcom levels. However, they currently account for 32.9% of the index's forward earnings compared with just 24% in 2000.
Again, better fundamentals by accounting for much more of the index’s earnings today.
Sam Ro shared the following from UBS.
"P/Es today are a full standard deviation lower than in the late 90s. On a FCF basis, the S&P 500 is 2 standard deviations cheaper." - UBS
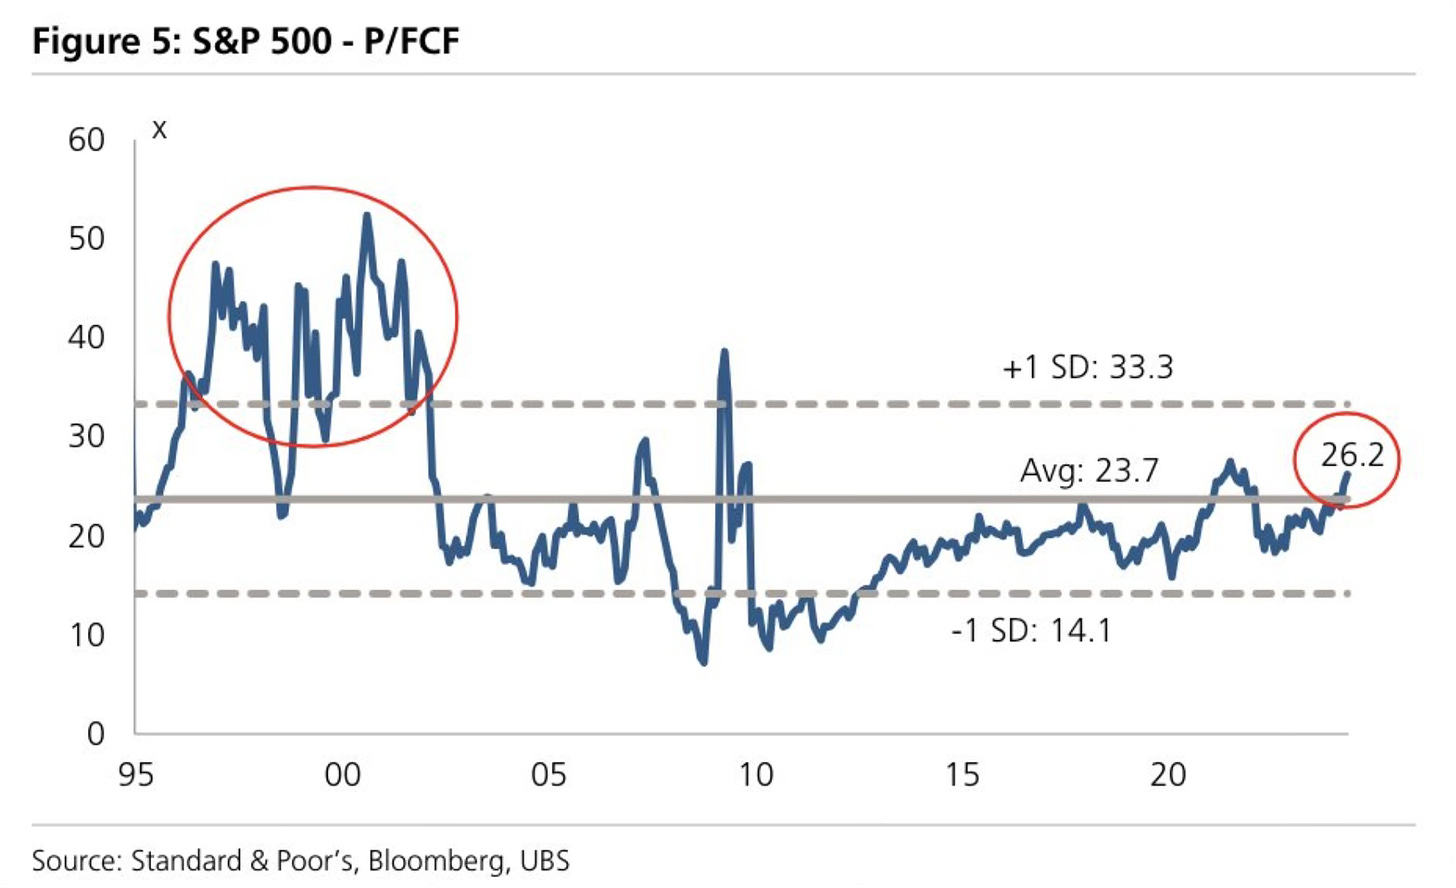
Just to reiterate. Today on a free cash flow basis, the S&P 500 is 2 deviations cheaper than it was during the dotcome bubble.
Last is this chart of the Nasdaq. It compares the 1996 low point to the dot-com high and the pandemic crash low to today. From July 1996 to March 2000 the Nasdaq rallied 700%. Since the March 2020 low to now, the Nasdaq has only rallied 200%.
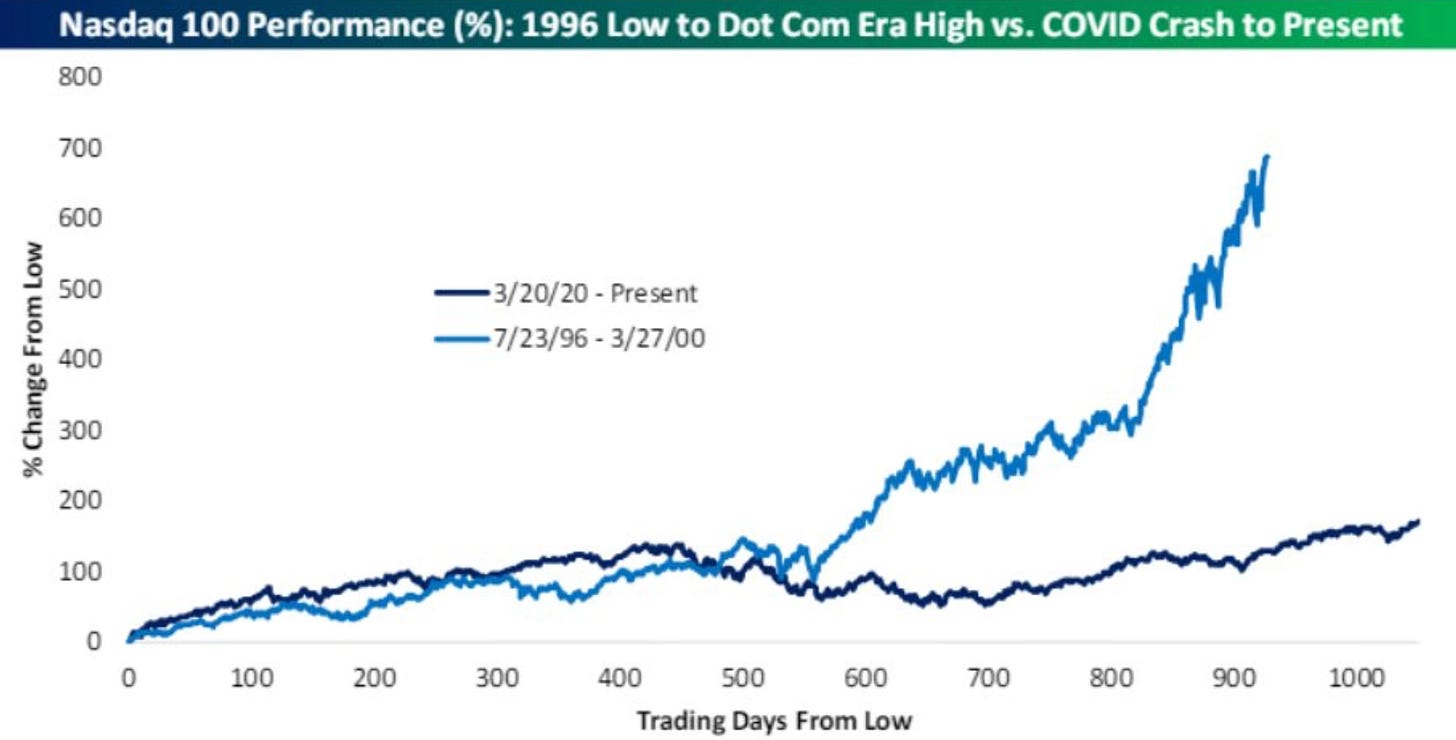
It’s really not even comparable. At least not yet. The dotcom crash was truly a unique time in history.
I wrote the following on June 8th in Investing Update: No This Isn’t A Bubble.
To me this current bull market is only like the dot-com bubble in three ways. None of which are correlated by data. There is a new technology coming out. This time it’s AI, back then it was the internet. There is one hot stock leading the way right now in Nvidia, back then it was Cisco. The last is that the market is at all-time highs just like back then.
This is coincidental dot connecting. Not comparable data and fundamentals. That’s a big difference.
Don’t fall for the bubble talk and that the stock market has to come crashing down. Nothing supports that right now other than the fearmongers who are trying to spread fear and connect dots. So please stop throwing around the bubble talk so loosely.
What I said I still completely believe.
I’ve yet to come across anything to prove otherwise. Yes, at some point it may change. But the data just doesn’t support or show it right now. Trust me, I’ve looked and continue to.
The noise is still just as loud. It will probably get louder. We will likely see more dotcom bubble and crash talk ahead. They’ll try connecting dots that just aren’t there and don’t connect.
Just remember, fear sells. It’s all to get attention, clicks and views. Don’t fall for it.
The Coffee Table ☕
Ryan Holiday wrote a great post called 37 (Or So) Lessons From A 37 Year Old. Being about the same age as Ryan, I agree with a lot of what he says. He’s such a good writer and like most he writes this is worth reading.
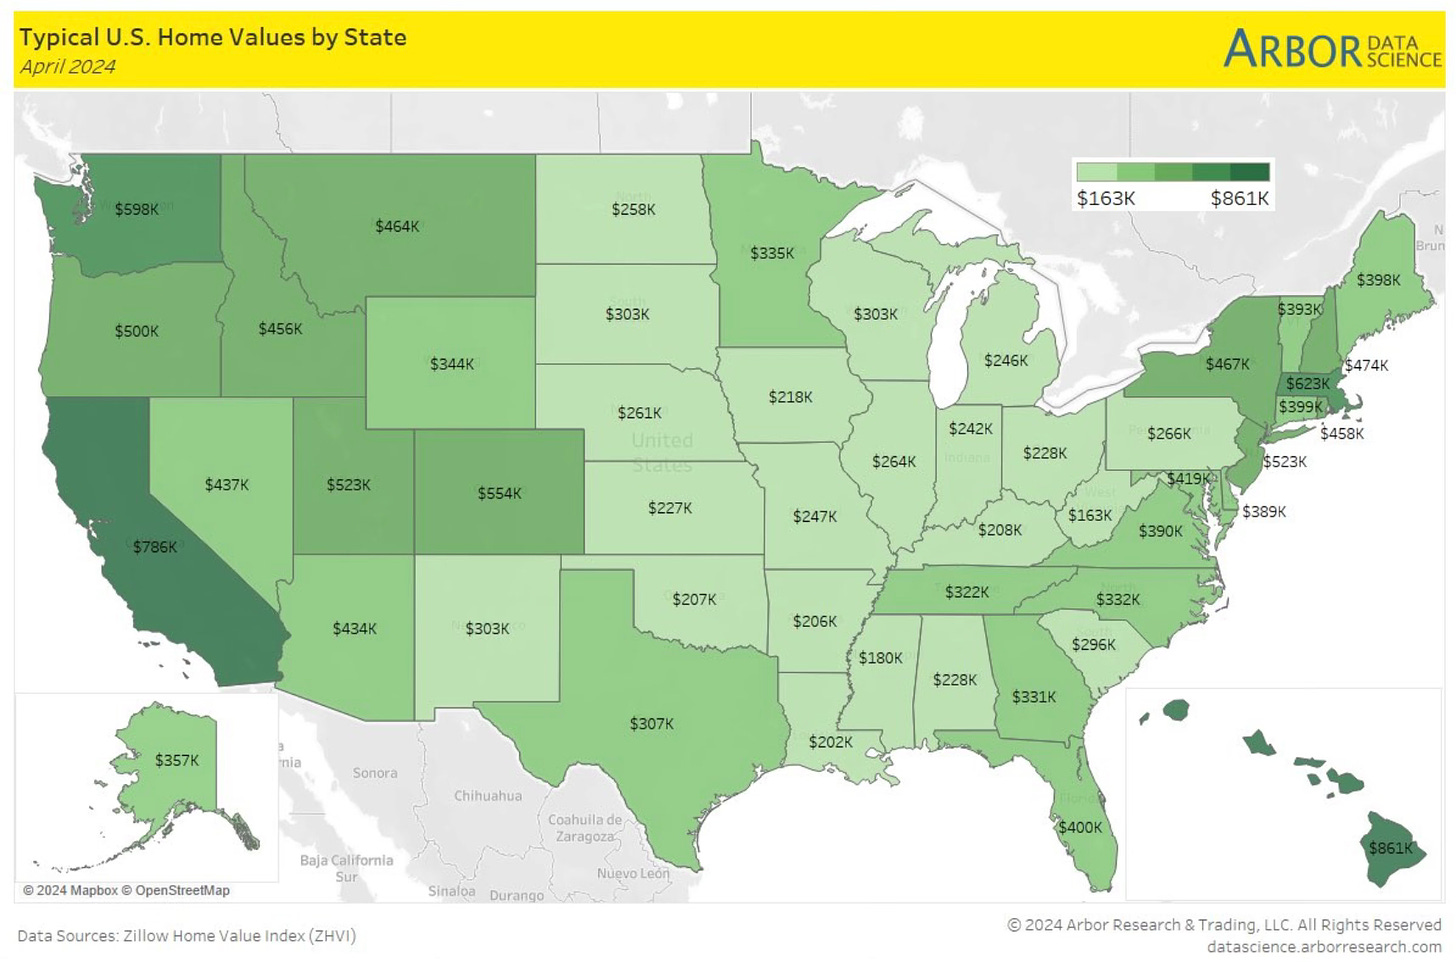
Ever wonder which state had the highest average home value? It’s Hawaii at $861,000. The lowest? West Virginia at $163,000.
Thank you for reading! If you enjoyed Spilled Coffee, please subscribe.
Spilled Coffee grows through word of mouth. Please consider sharing this post with someone who might appreciate it.
Order my book, Two-Way Street below.


